Support Confluence Revives Bullish Outlook
Salesforce, Inc. (CRM), a leading cloud-based enterprise software company, recently completed its first pullback after a significant breakout, finding support at a confluence of technical indicators before strengthening. A weekly bullish reversal signal triggered this week on a rally above last week’s high of $235.02, thereby confirming a higher swing low and establishing key structural support at $220.29.
That support area is reinforced by price structure, the 38.2% Fibonacci retracement of the prior advance, and the 50-day moving average, currently near $228 and rising. This confluence strengthens the case that the pullback may have ended and that the broader recovery could resume.

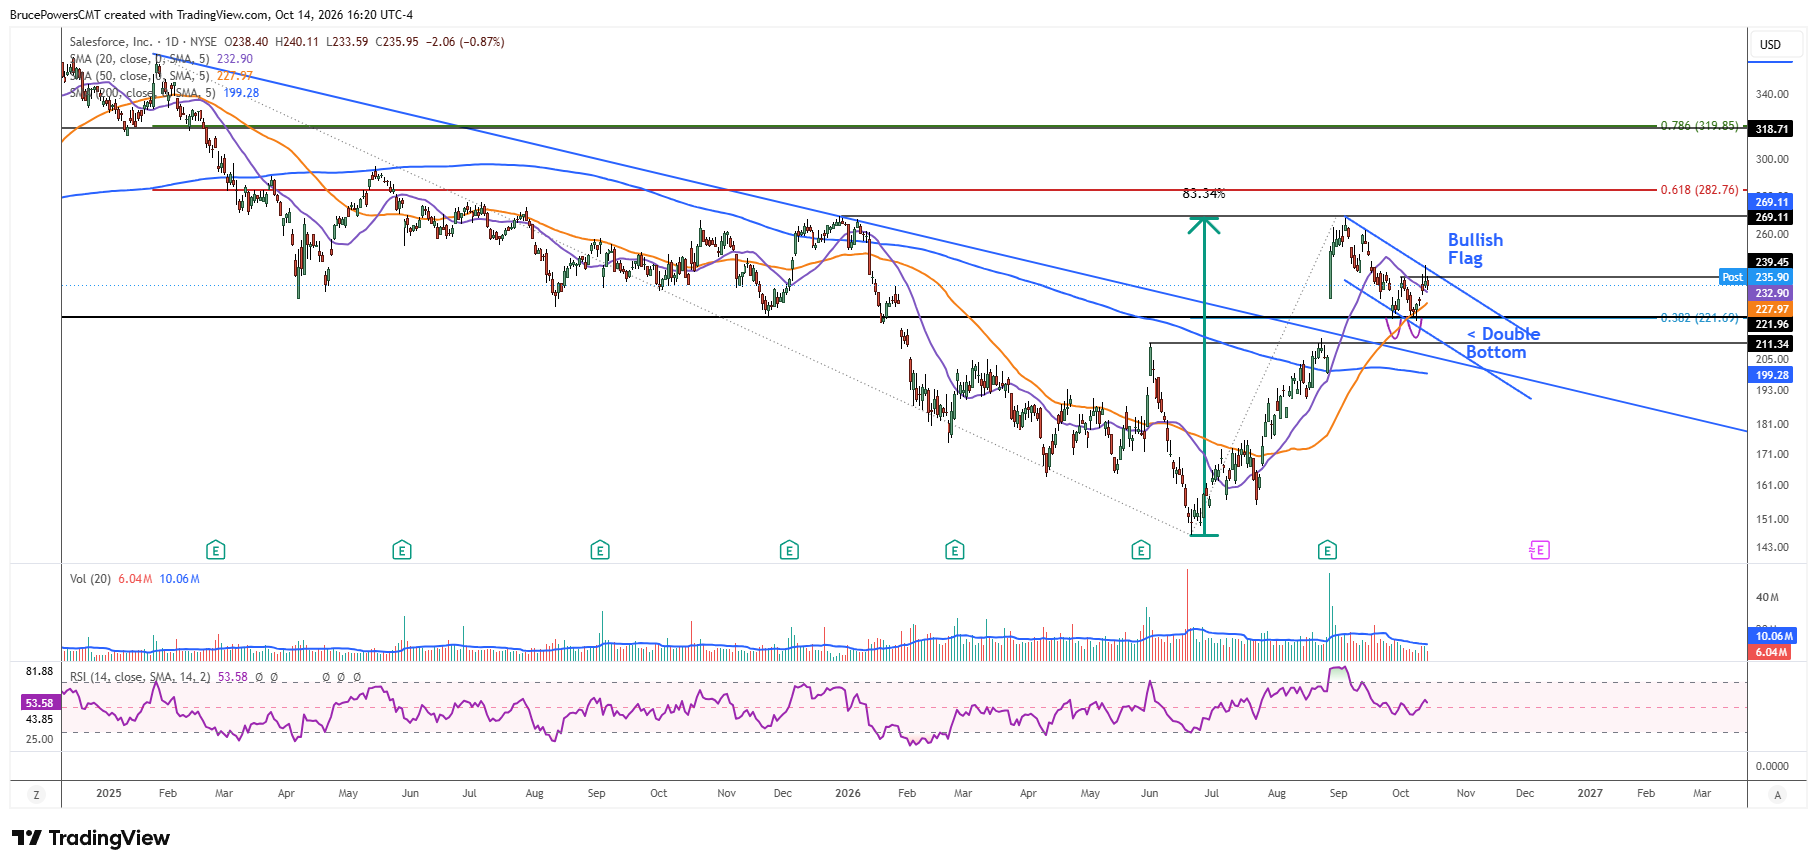
Double Bottom Builds on June Recovery
The weekly bullish signal was accompanied by a double bottom breakout on the daily chart above $239.45 and a reclaim of the 20-day moving average as support. Both signals add to the developing bullish technical evidence for CRM. However, the double bottom breakout has not yet been confirmed by a daily close above the breakout level. Nonetheless, the completion of the pullback could set the stage for a second impulse leg higher, following the June low of $146.32 that marked the bottom of the larger correction.
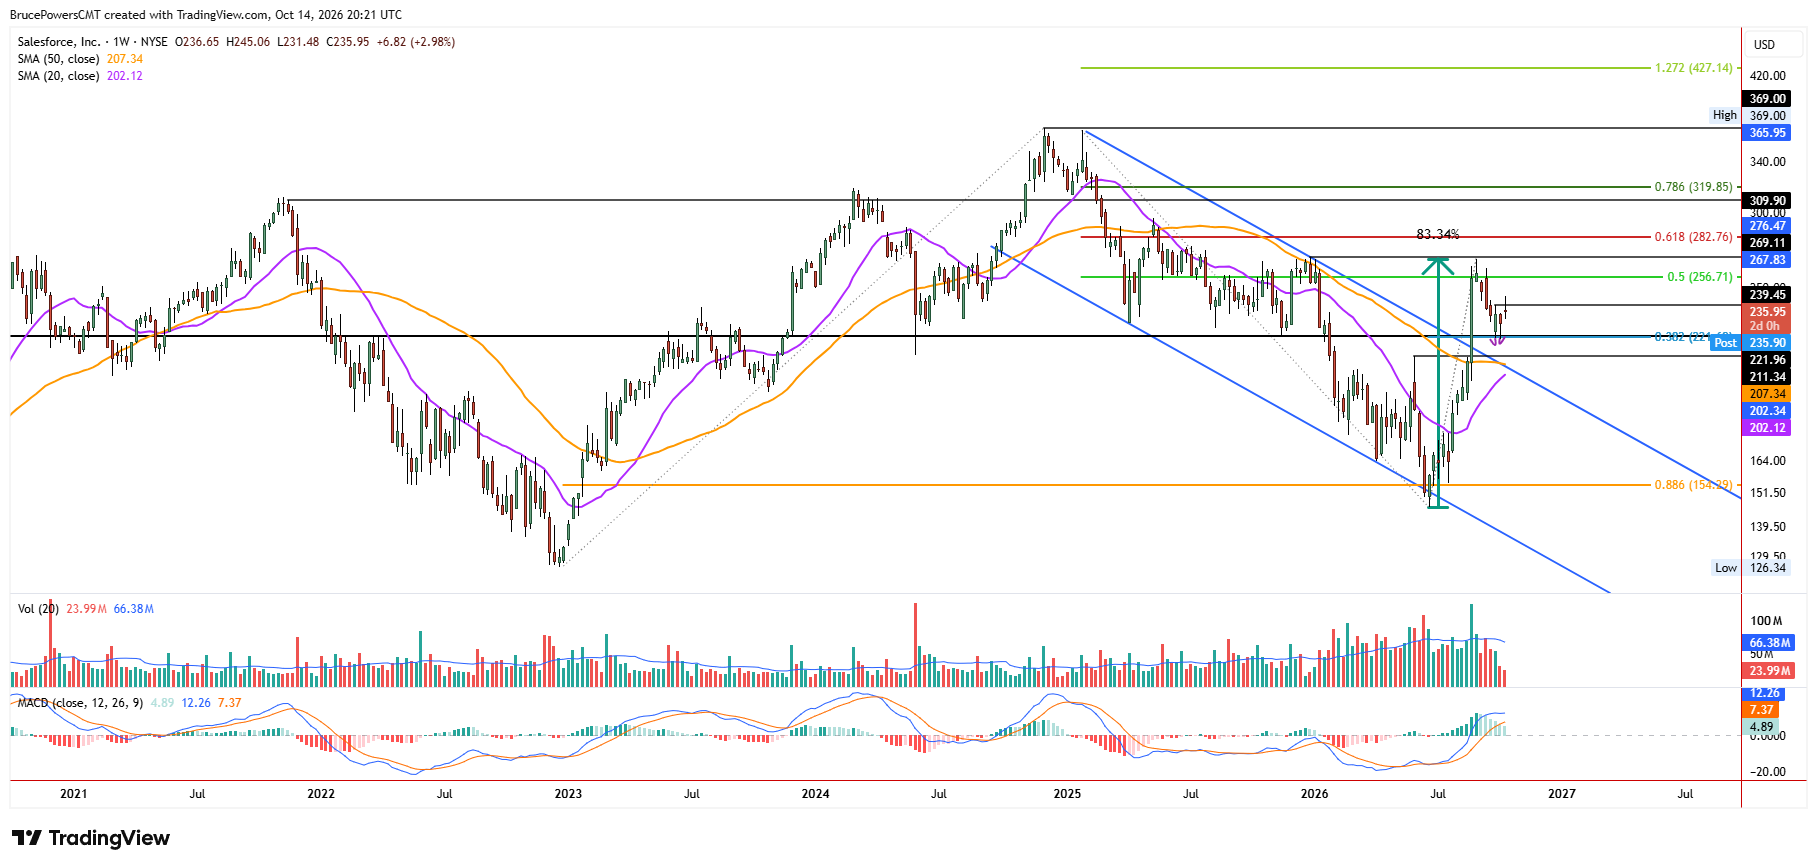
Following the June low, CRM advanced by approximately 83% in 10 weeks to a high of $268.27, reached in September before a pullback began. That sharp advance was supported by a bullish reaction to its Q2 fiscal 2027 results reported after the market closed on August 26. A gap up and rally followed the report, triggering a breakout above the downtrend line, a bullish reversal signal above the lower swing high of $211.34, and a reclaim of the 200-day moving average. The reclaim followed an initial bullish signal six days earlier.
Bullish Flag Breakout Remains Possible
In addition, the double bottom pattern is contained within a possible bullish flag that formed during the pullback from the September high. This week’s high of $245.06 tested resistance near the flag’s upper boundary, reinforcing its significance. The flag remains an important consideration because price has now tested and validated one of its boundaries.
A decisive breakout above this week’s high would strengthen the bullish case by confirming a move above both the double bottom breakout level and the flag’s upper boundary. Such a move would provide further evidence that the pullback has ended and that CRM may be preparing to extend its recovery from the June low.
If you’d like to know more about technical analysis and how traders use it, please visit our educational area.