Gold: Hot Inflation Revives Fed Risk, but Yields Offer Relief
Gold has an attractive fundamental backdrop as U.S. inflation remains persistent and the demand environment shifts more defensive. September CPI data surprised to the upside, initially pushing the probability of an October rate hike by the Fed toward 50%, before it eased to 29%, compared with 22% before the report. Mary Daly said further rate hikes will likely be warranted, but there was no rush to do so at the October meeting. Michelle Bowman said that policymakers have the time to assess the data before making a decision.
Bond markets are seeing renewed safe-haven demand. The U.S. 10-year Treasury yield fell to around 5.09% on Thursday, reaching a three-week low as demand for government bonds strengthened amid a technology-stock selloff. Falling yields reduce the opportunity cost of holding non-interest-bearing gold. The dollar also retreated from an 18-month high.
Strong institutional demand should remain a key long-term structural element. September’s net inflows into global gold ETFs totaled $10 billion, adding 67 tonnes and bringing total holdings to an all-time high of 4,256 tonnes. Third-quarter inflows to ETFs reached an all-time high of $31 billion.

Silver: Tight Supply Meets Softer Industrial Demand
Silver’s price tends to track gold’s but also reflects industrial demand and Fed policy. Unlike gold, however, silver faces a persistent physical supply-demand deficit. The Silver Institute expects the sixth straight year of a structural deficit for 2026, estimated at 46.3 million ounces, with industrial fabrication falling 3% to around 640 million ounces due to further decreases in loadings by the photovoltaic industry and other industries switching to alternative materials.
The Institute expects stronger investment demand to offset some weakness in industrial demand, while the market remains in deficit. Coin and bar investment in silver is expected to grow by 18% to 258 million ounces, while total supply is expected to decline by 2% to around 1.066 billion ounces.
There was ample evidence in September to support this view. For example, Indian silver ETFs attracted inflows of 19.74 billion rupees. Strong investor demand for precious metals, in general, was also evidenced during the broader equity market sell-off.
Gold Technical Analysis: XAU/USD Holds Above $4,128 as $4,161 Caps the Recovery
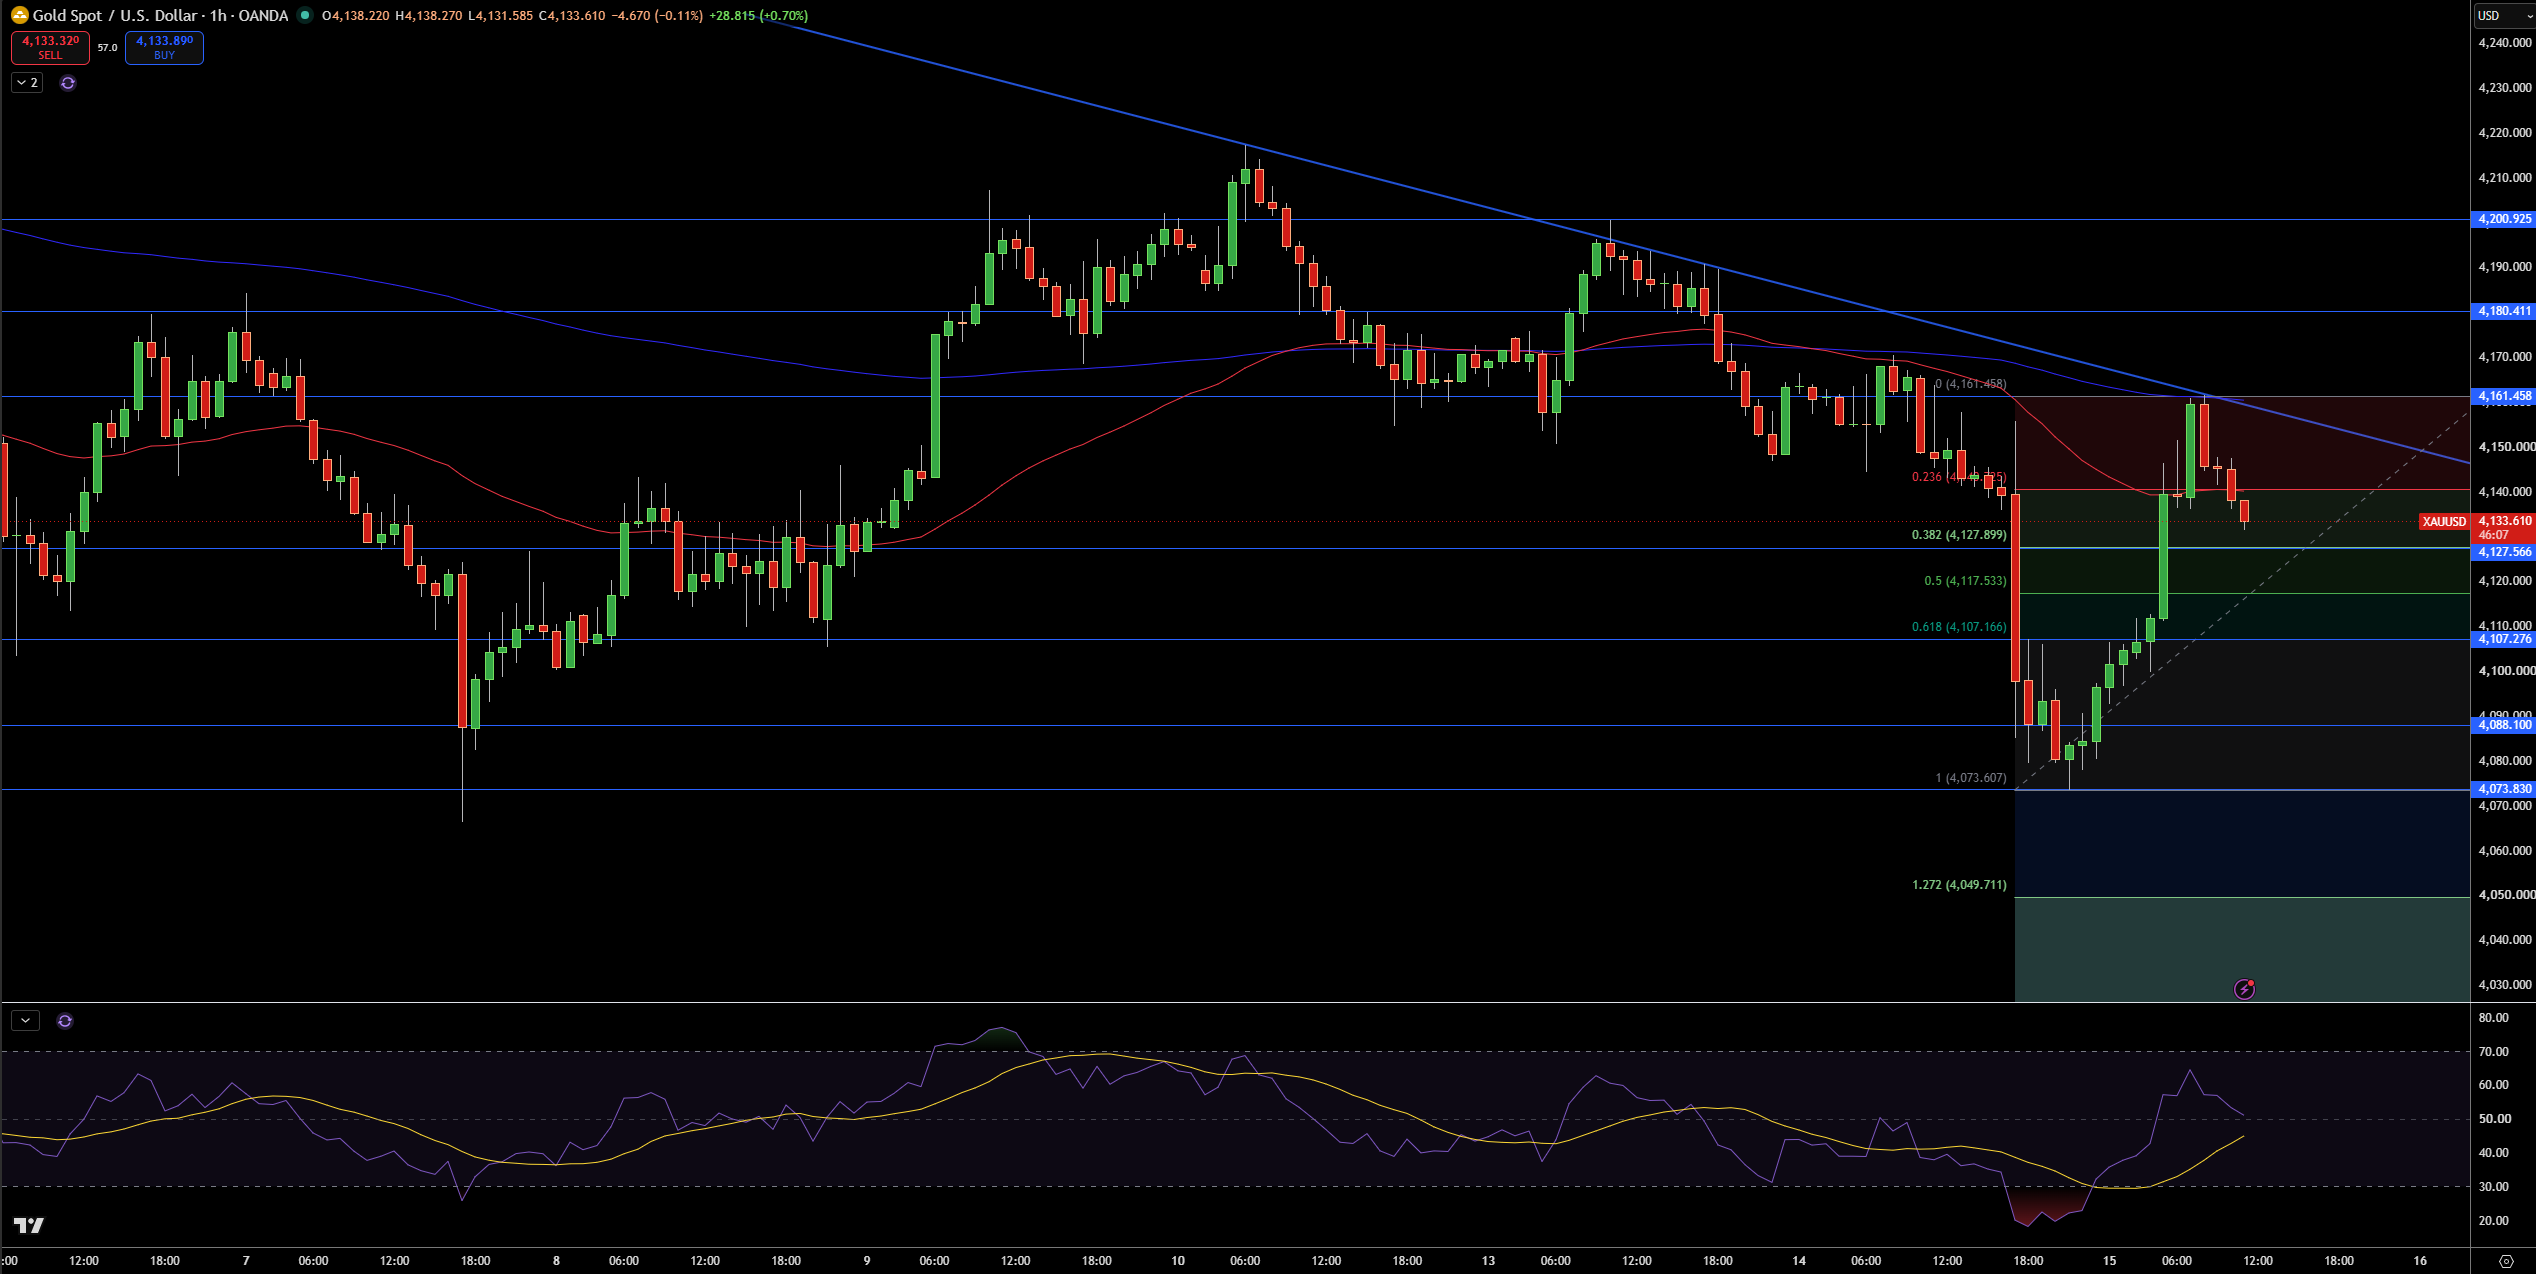
Gold (XAU/USD) is currently trading at $4,133.61, after a bounce from the $4,073.63 area on the 2-hour time frame. I like to draw your attention to the fact that the price bounce has taken gold above the $4,107-$4,128 area, but is still below a descending trend line and a resistance area formed by the moving averages. Thus, the overall bearish trend is still intact, despite the current bounce.The first area of interest on the upside is at $4,161.46, above which $4,181.44 and $4,216.96 would come into play. On the other hand, the first support comes in at $4,127.56, below which $4,107.28, $4,088.10, and $4,073.63 would come into focus.
Gold Price Forecast
Every new Gold analysis as it publishes, today's technical signal and key levels, live price — on one page.
See all Gold forecastsThe RSI is around the 50 level, suggesting neutral momentum. A sustained move above 50 would strengthen the bullish case, while a decline below that level would indicate renewed selling pressure. Although the broader trend remains bearish, I am slightly bullish on gold in the short term as long as it is above $4,128. A break below $4,128 would weaken the recovery. A clear break above $4,161 would give a stronger bullish edge to the setup. On the other hand, a break below the $4,107 area would strengthen the bearish case and bring 4,088-4,074 back in focus.
Silver Technical Analysis: XAG/USD Extends Breakdown as $55.41 Becomes the Immediate Support
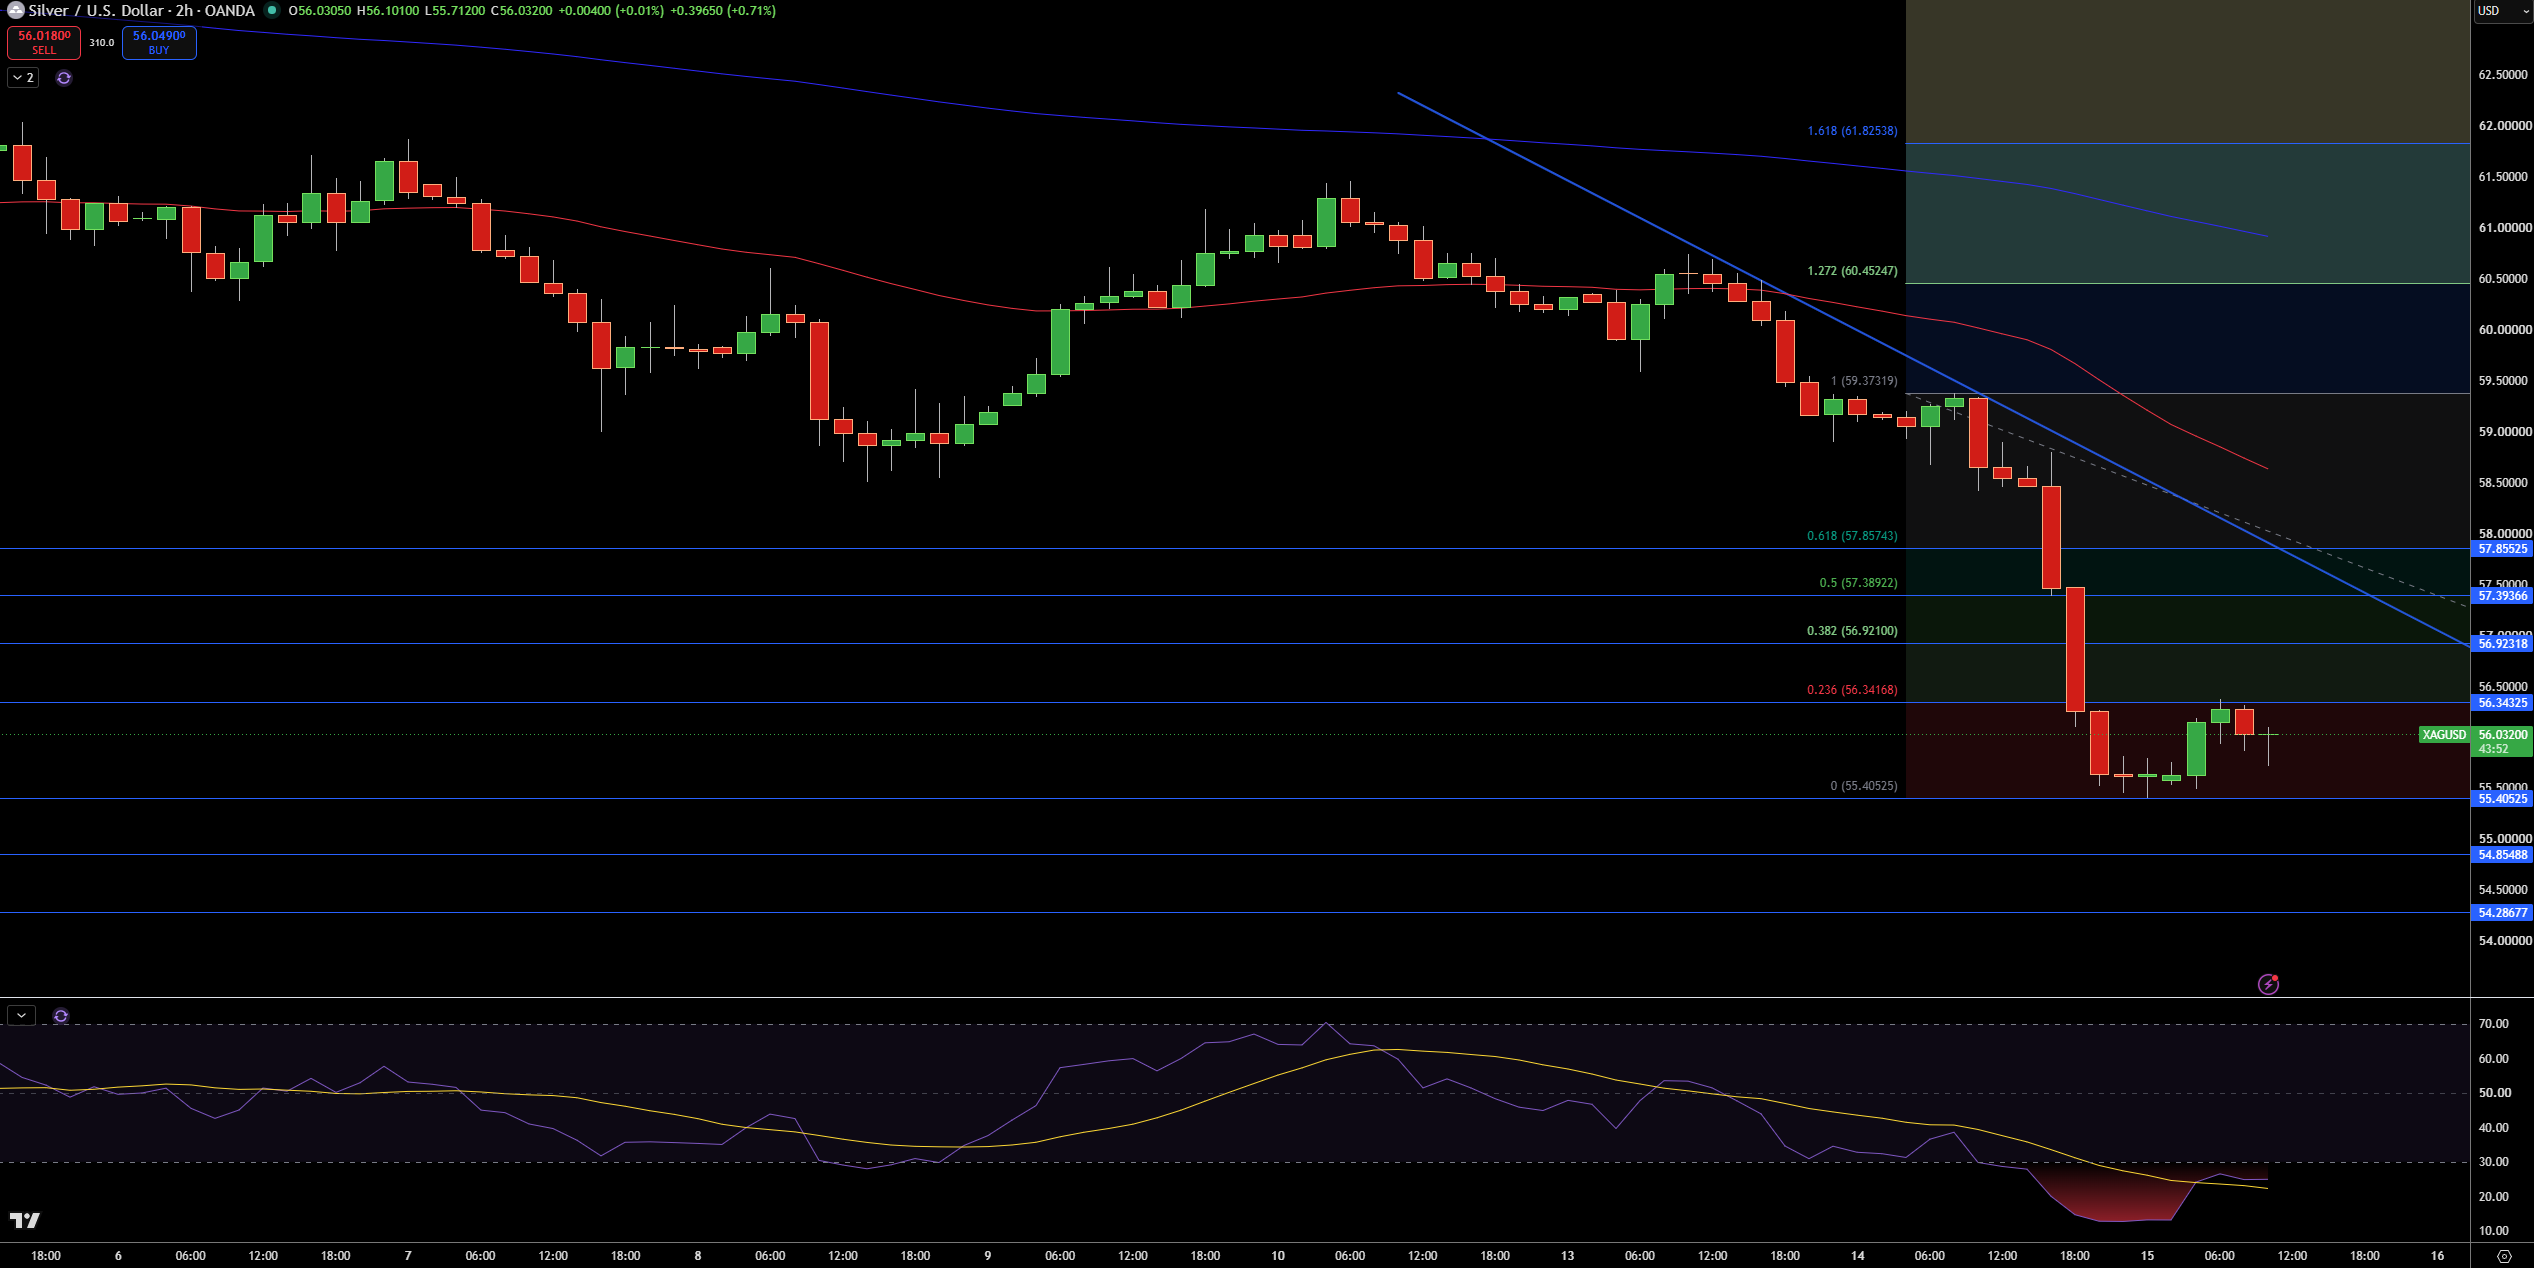
Silver is trading at $56.03 on the 2-hour chart, continuing its decline while trading below the descending trend line and both moving averages. What I find particularly noteworthy is that the price has broken through several Fibonacci support levels and is now consolidating near the recent lows, which keeps the larger trend structure bearish.
The first support I have my eyes on is $55.41. A clear break below that would bring $54.85 into play, and subsequently $54.29. On the upside, $56.34 is the first resistance, with $56.92, $57.40 and $57.86 becoming further resistance levels if tested.
RSI continues to show oversold conditions, reflecting the strong downside move and increasing the potential for a short-term bounce. That said, and until Silver trades above $56.34 and the descending trendline, I am going to remain bearish.
A sustained move above $57.40 would weaken the short-term bearish trend, while a break below $55.41 would bring the next support at $54.85 into focus.