
Brent oil dropped near $106.26 a barrel, and WTI oil dropped near $94.66 in early Asian trading on Thursday. The market weighed fresh US proposal to lower the cost of oil shipping. The Trump administration is considering easing sanctions on some shadow fleet vessels so they can carry oil permitted under US rules. This could help move more crude and fuel from Gulf and ease pressure on prices. But the plan remains under discussion. The restrictions by the European insurance companies could also limit its effect.
The fresh US inventory data could limit further losses. According to the API report, crude stocks dropped by 11.1 million barrels last week. The shipping attacks near the Strait of Hormuz also keep the risk of supply in focus. In my view, the cheap shipping could weigh on oil, but further disruption could quickly reverse the decline. The market is now waiting for the official US inventory data to confirm the large draw.

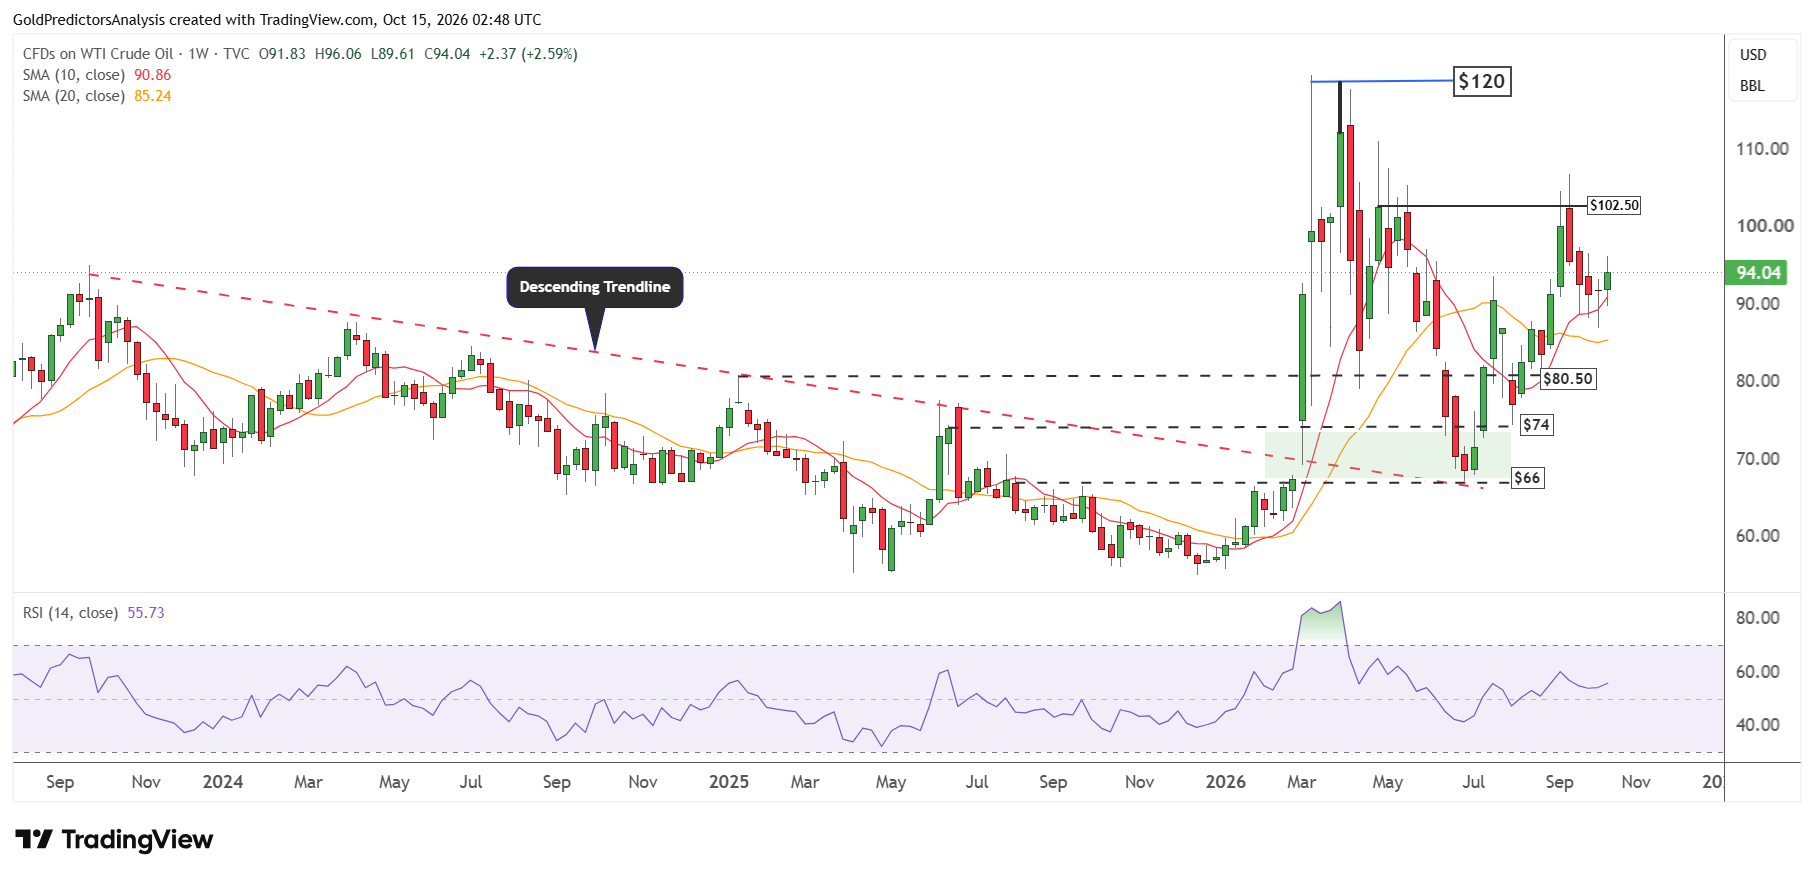
WTI Oil Forecast: Break Above $96.50 Could Lift Prices to $102.50
The weekly chart for WTI crude oil shows constructive price action above the 10- and 20-week moving averages. The price formed a low last week at $86.86 and produced a rebound towards $96.
However, the price is correcting after hitting the $96 area and is looking for the next support. The RSI remains above the midline, which suggests a positive move. If prices continue to rally above $96.50, they will likely reach the $102.50 resistance again.
A weekly close above $102.50 will open the way for a rally towards the $120 area. As long as WTI oil holds $80.50 support, the trend remains positive.
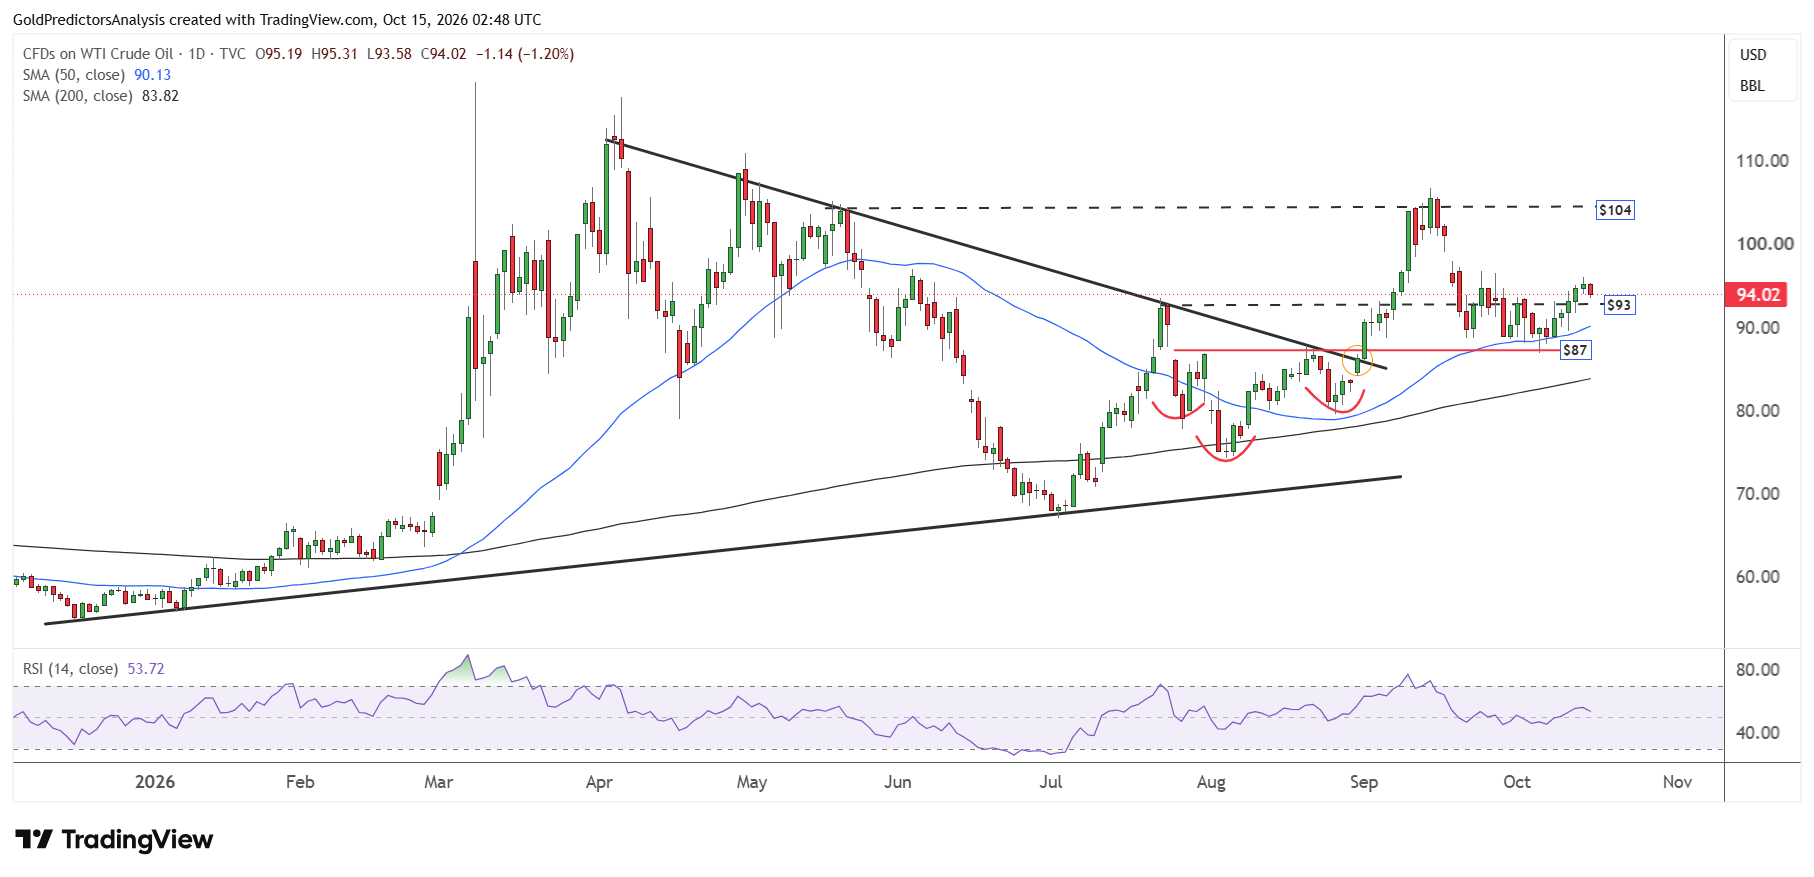
The daily chart for WTI crude oil shows constructive price action as price has formed an inverted head and shoulders pattern above the 200-day SMA. The price is consolidating above the 50-day SMA and looks to rally towards the $104 area.
The immediate support levels for WTI oil remain at $93 and $90. A break below $90 will push prices towards $87. The RSI remains above the midline on the daily chart, which also suggests positive momentum in the WTI oil market.
Brent Oil Price Forecast
Every new Brent Oil analysis as it publishes, today's technical signal and key levels, live price — on one page.
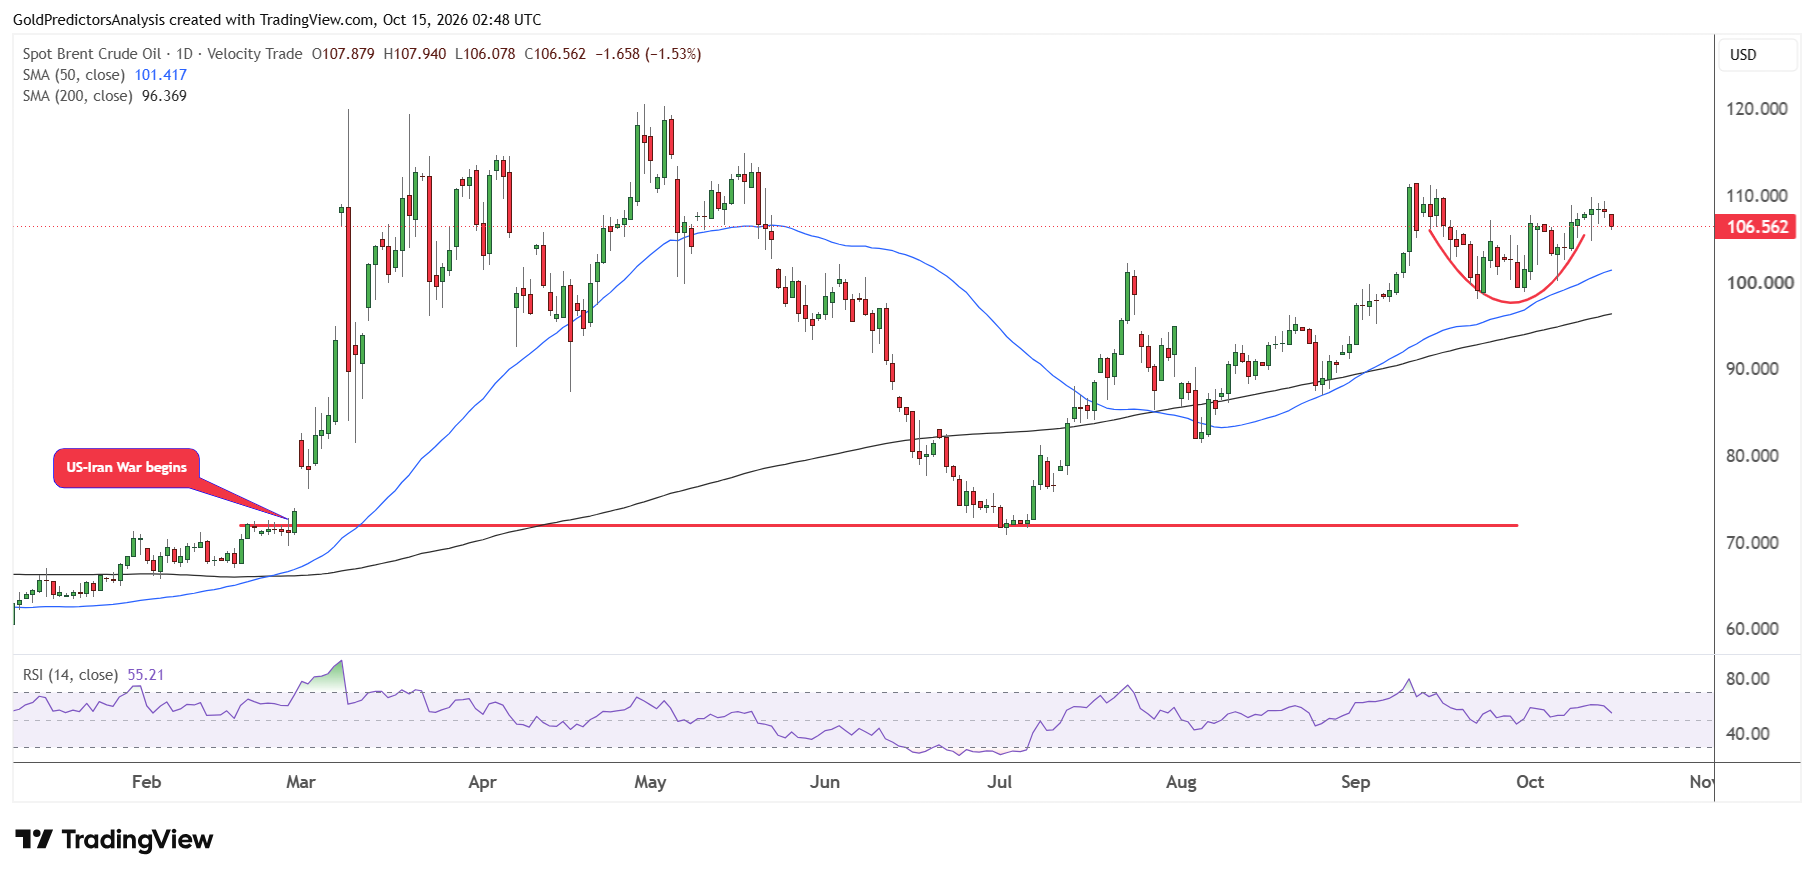
See all Brent Oil forecastsBrent Oil Forecast: Break Above $110 Could Lift Prices to $120
The daily chart for Brent oil shows that prices remain constructive above the 50- and 200-day SMAs. The immediate resistance in Brent oil remains at $110. A break above $110 will push prices towards $120.
On the other hand, a break below $98 in Brent oil will likely push prices towards the $87 level. The RSI remains well above the midline, which suggests a positive move in the Brent oil market.
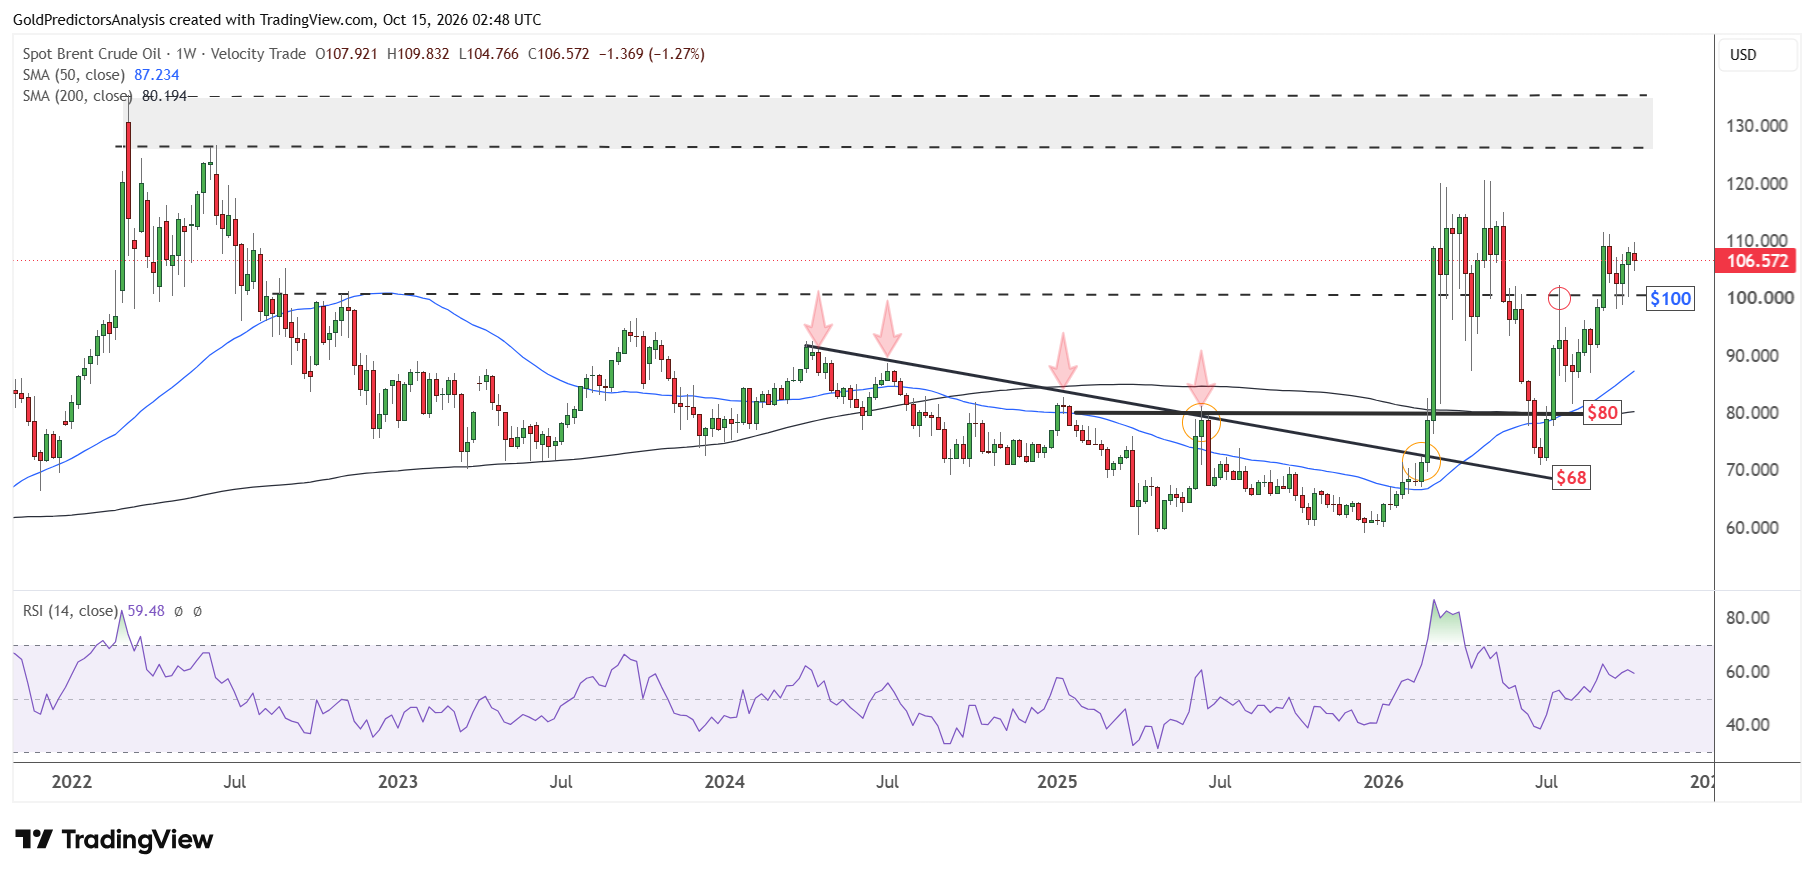
The weekly chart for Brent oil shows that the price has formed positive weekly candles during the past two weeks above the $100 level. The formation of shadows on the weekly candles during the past three weeks suggests strength in the oil market. Therefore, a break above $110 will likely push prices towards the $120 and $125 areas.
Moreover, the RSI remains well above the midline, which suggests a positive trend in the short term. As long as Brent oil remains above $80, the risk of a positive move remains high. But the oil market remains highly volatile after the US-Iran war, which suggests wide trading ranges.
What to Watch Next
The market will watch the official US inventory data and the proposal to ease tanker sanctions. The low cost of shipping could weigh on prices, while a confirmed stock draw and further disruption near Hormuz could support a rebound. A break above $96.50 in WTI oil may push the price to $102.50. Brent oil could target $120 if it clears $110.
In my view, oil prices still remain constructive in the short term, but buyers need to defend support. A break below $90 in WTI oil or $98 in Brent oil would weaken the recovery.