
USOIL: Large Inventory Draw Meets Recovering Global Supply
U.S. crude fundamentals tightened on the heels of the American Petroleum Institute showing an 11.1 million barrel decline for the week ended October 9. The EIA is scheduled to release its report later today, although its figures may differ from the API estimate. The U.S. draw follows strong refinery activity and exports in the last few weeks.
The improvement in global supply is keeping some bearish sentiment. The IEA reported Russian crude oil production rose about 65,000 bpd in September to 8.43 million bpd, and Middle Eastern Gulf crude oil exports rose by 4.4 million bpd, recovering to around 75% of pre-war levels.

UKOil: Hormuz Attacks Keep Logistics Risk Elevated
Brent crude oil remains tight, focused on shipping security. Two commercial vessels have sunk near the Strait of Hormuz, including one damaged in an earlier attack, as maritime security incidents have increased across the region. U.S. President Trump is considering modifying sanctions to allow some shadow-fleet vessels to transport oil legally to help relieve shipping bottlenecks.
OPEC reported OPEC+ production for September at about 39.07 million barrels per day, an increase of about 900,000 barrels per day from August, with the majority of the increase coming from Saudi Arabia.
Natural Gas: Storage Offers Cushion, but LNG Supply Remains Fragile
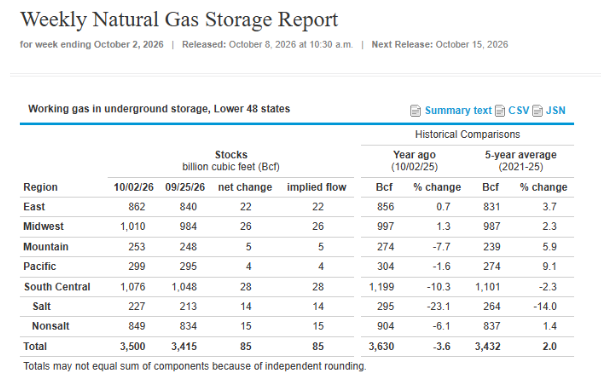
The EIA reported U.S. working gas in storage at 3,500 Bcf for the week ended October 2, up 2% from the five-year average. The next storage report is due Thursday, October 15. Global LNG remains tight.
QatarEnergy has advised Edison to expect no deliveries until at least December, requiring Edison to replace Qatari gas largely with U.S. LNG.
Natural Gas Price Forecast
Every new Natural Gas analysis as it publishes, today's technical signal and key levels, live price — on one page.
See all Natural Gas forecastsNatural Gas Technical Analysis: NG Holds $3.22 as $3.34 Remains the Key Breakout Level
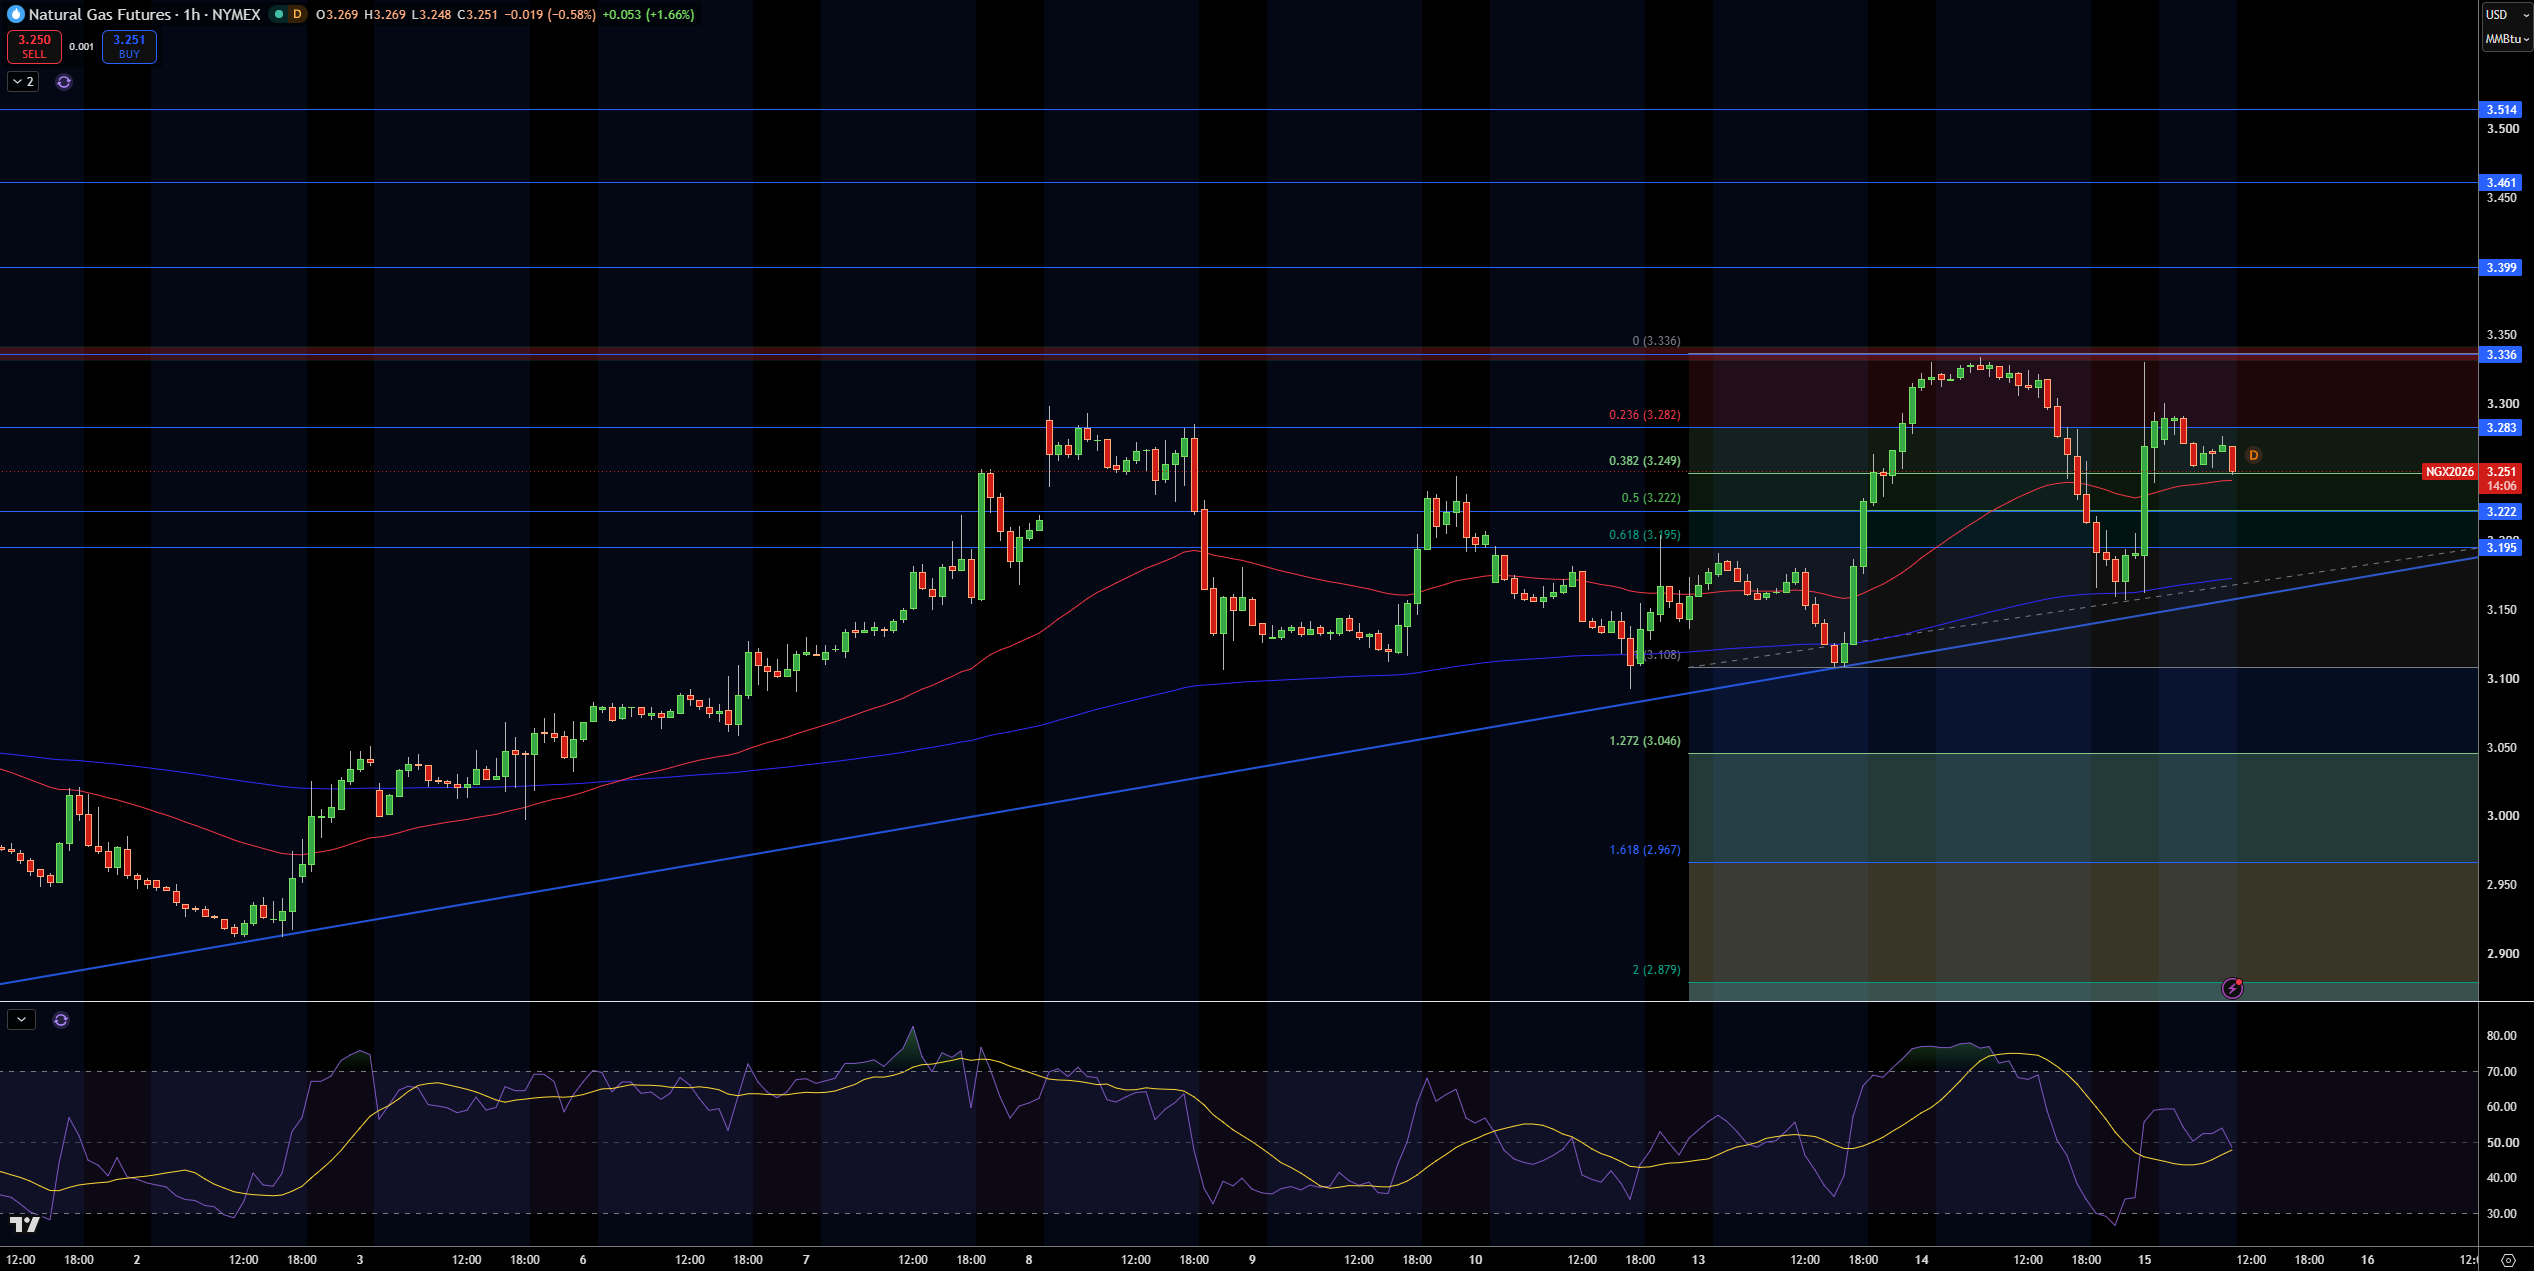
Natural gas is trading at $3.25/MMBtu and is forming a slight bullish flag around the 1-hour $3.20 support area and rising trendline. The moving averages are above the price and the overall structure is bullish, even if there is some hesitation below the 3.33-3.34 resistance.
Bullish momentum would require breaking $3.28 and $3.34. Resistance at $3.34 would also align with the neckline of the potential inverse head and shoulders pattern forming below. If broken, this would target the $3.40, $3.46 and $3.51 areas.
If price breaks the $3.22 and $3.20 support areas, and the trendline, that would open the $3.11 and $3.05 areas. I’m inclined to think the overall structure is bullish as long as price holds above the $3.20-$3.22 areas and rising trendline. However, the RSI under the 50 area suggests momentum has yet to confirm that bullish view.
A break above $3.34 would offer a better structure for the $3.40, $3.46 and $3.51 areas. A close below $3.20 would take away the bullish structure and offer a more bearish bias toward the $3.11, $3.05 and $2.96 areas.
WTI Crude Oil Technical Analysis: USOIL Holds $93.59 as $95.19 Becomes the Next Upside Test
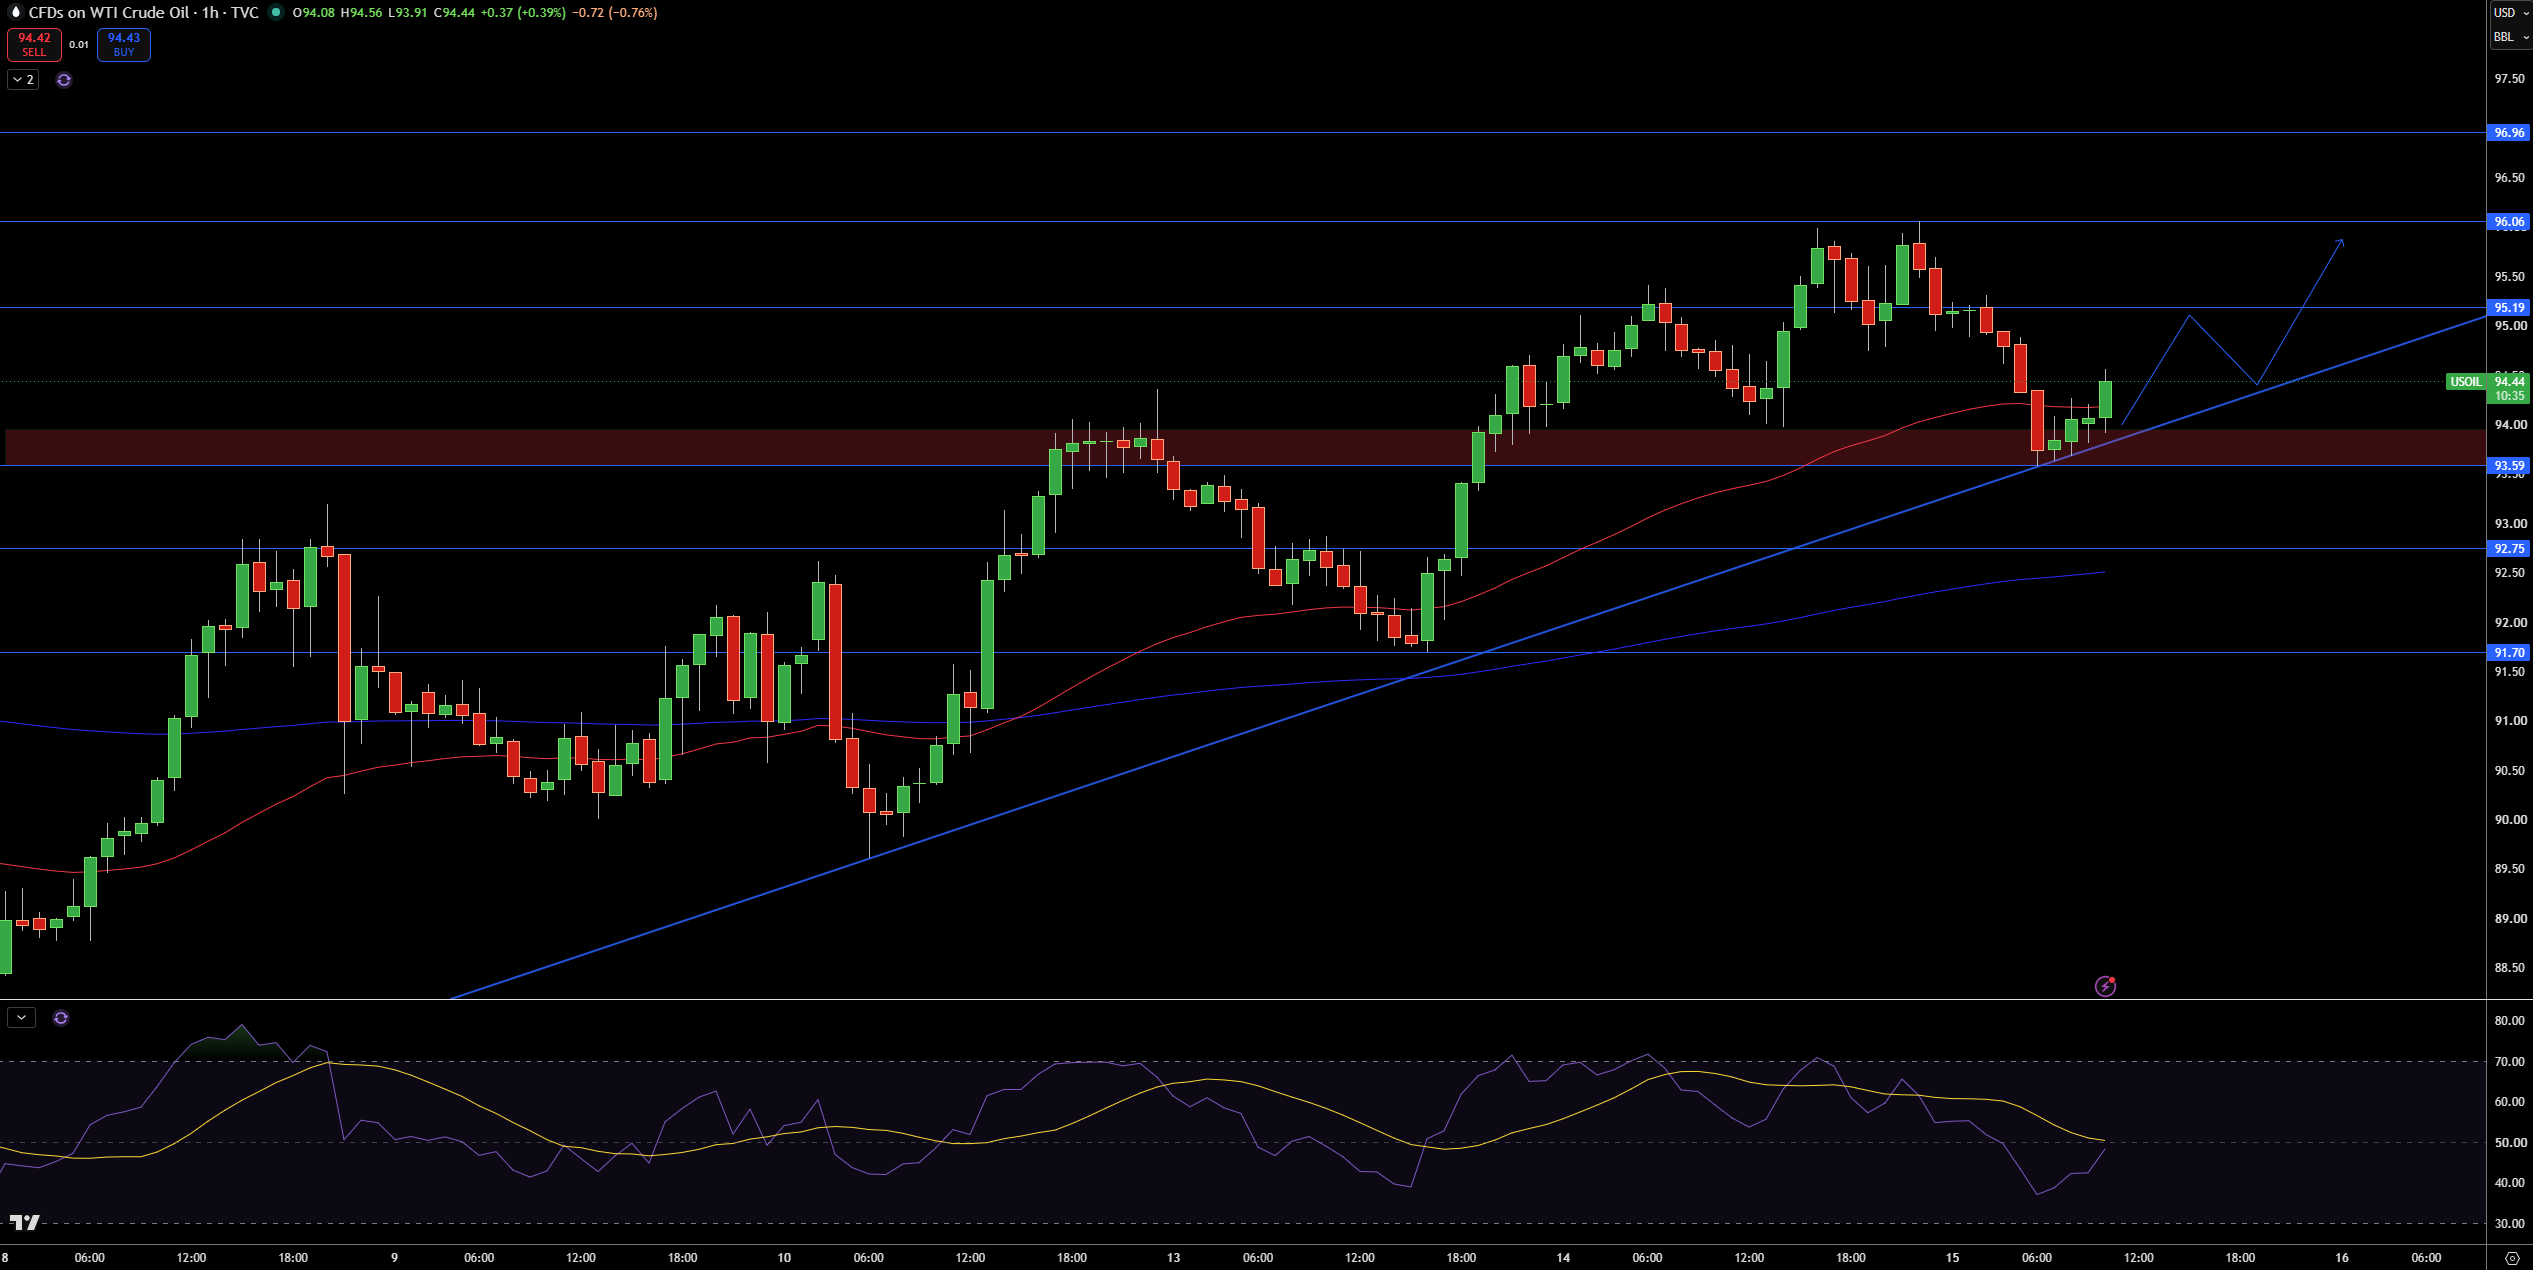
WTI Crude Oil is sitting at $94.44 on the hourly chart after bouncing from the rising trendline and $93.59 support area. It’s worth noting the price is above both moving averages, and the higher lows structure is still in place. The most recent bounce indicates that buyers are defending the breakout area, and price needs to clear nearby resistance in order to extend the move higher.
The first areas of interest is the $95.19 level, above which $96.06 is the next resistance, and is followed by $96.96. On the flip side, if the price breaks lower, $93.59 is the first area of interest, and below that, $92.75 is the next area of interest, followed by $91.70.
RSI is bouncing higher after being in the lower range and is trending higher, suggesting downside pressure is easing. I will take a bullish view as long as WTI crude holds $93.59 and the rising trendline. I see a break above $95.19 as bullish and targeting $96.06, and a break below $93.59 as a bearish signal.
Brent Crude Oil Technical Analysis: UKOIL Tests $104.01 Support as $105.85 Caps the Recovery
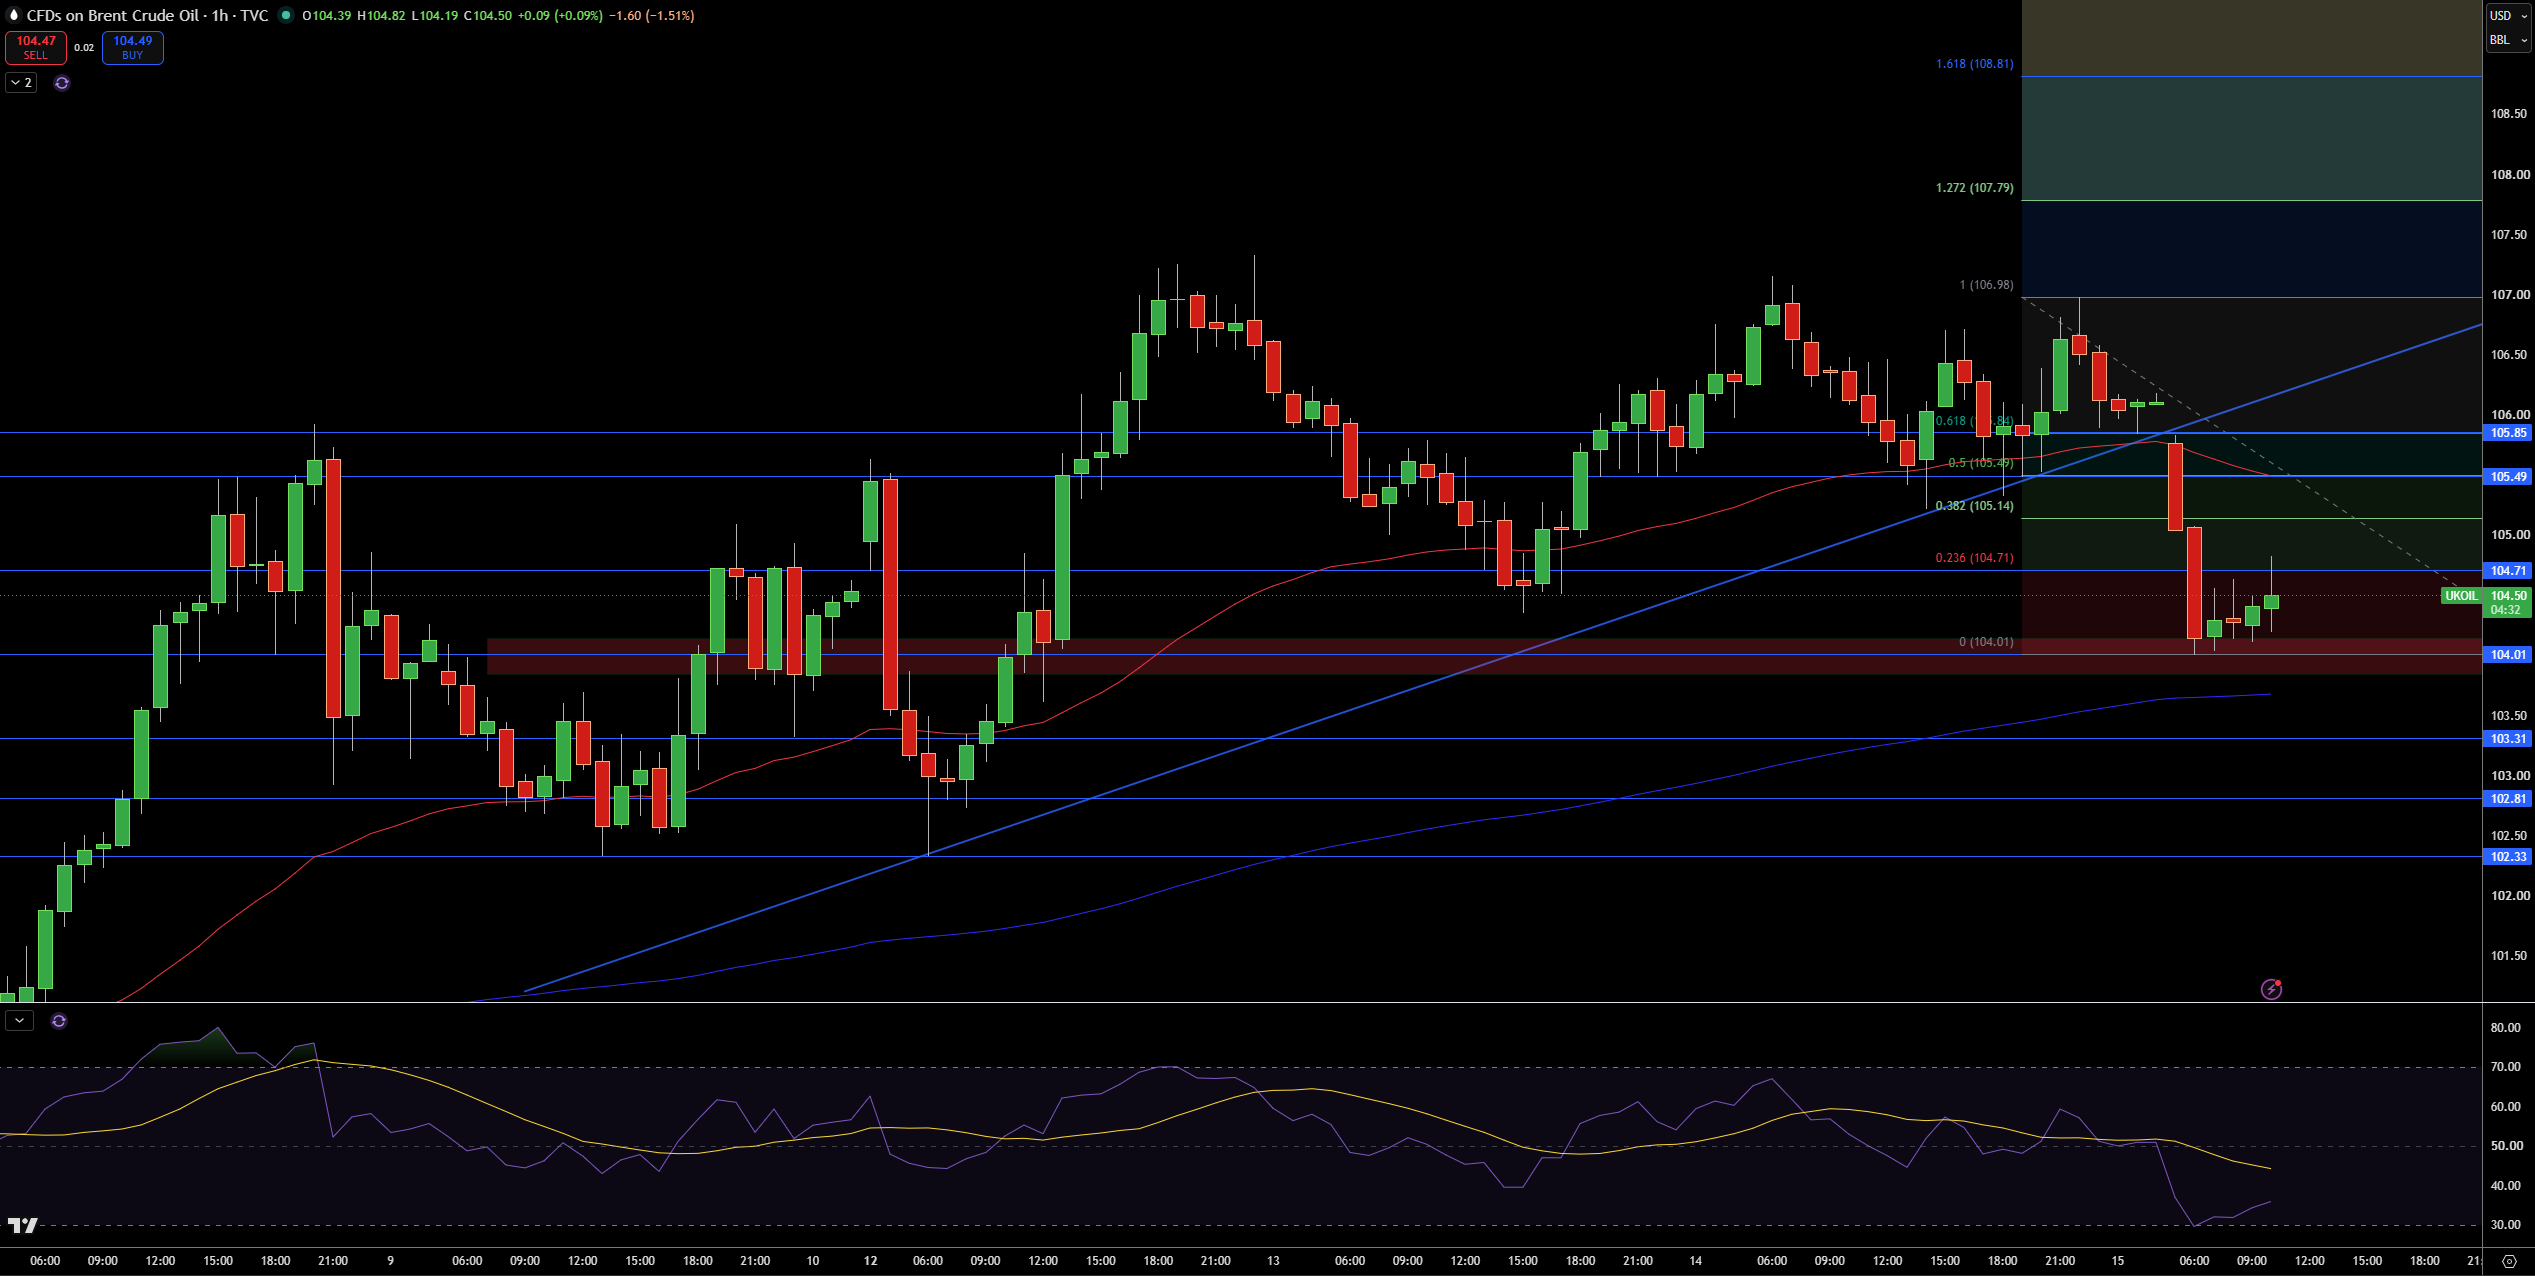
Brent crude recently fell from highs of just above $106 and currently trades around $104.50. I see price has broken down from its short-term trendline and MA, but has found support at $104.01, which has kept the broader recovery from breaking down completely.
Resistances are seen at $105.85, $106.90, and then $107.79 and $108.81. Support is at $104.01 and then $103.31, $102.81, and $102.33.
A drop in price has caused the Relative Strength Index (RSI) to touch oversold levels. This potentially sets up a short-term bounce. However, I still consider the bias to be bearish as long as price trades below $105.85. A break below $104.01 would bring the $103.31 area into play. Conversely, a break above $105.85 would be bullish.