



Dollar Index: Hot CPI Meets a Sharp Treasury Rally
The U.S. dollar’s backdrop became more mixed on Thursday. U.S. inflation for September was released, and came in hotter than expected. As a result, expectations for another rate hike by the FOMC this month increased, briefly pushing the probability of an October hike to 50%. However, FOMC officials followed with commentary stating there was no need for urgency to hike at the next meeting. Current expectations favor the Federal Funds Rate remaining at the current target range of 3.75%-4.00% after the conclusion of the October 27-28 FOMC meeting.
The bond market is providing the primary counterweight. The 10-year U.S. Treasury yield fell to 5.0933% and the 30-year U.S. Treasury yield fell to 5.4462%. Both yields posted 3-week lows. Rising government bond prices indicate a flight to safety.

EUR: French Inflation Complicates an Already Difficult Fiscal Picture
Fundamentals continue to be dominated by France. French EU-harmonized inflation accelerated to 3.4% year over year in September from 2.6% in August. It is the highest level since January 2024.
Accelerating French inflation adds to concerns about persistent price pressures across the eurozone, while France’s fiscal difficulties continue to weigh on investor confidence. These competing forces complicate the euro’s outlook as the ECB assesses the appropriate path for monetary policy.
GBP: Growth Surprise Strengthens the BoE Tightening Case
The surprise growth in the UK in August provided a boost for Sterling. UK GDP unexpectedly increased 0.1%, versus a decline of 0.1% that was expected for the month. Annual growth increased to 2.1% and manufacturing output for the month increased by 1.2%.
BoE Chief Economist Huw Pill said a future rate hike should not be interpreted as the beginning of a prolonged tightening cycle. Markets nevertheless expect a 25-basis-point increase at the November 5 policy meeting.
EUR/USD Price Forecast
Every new EUR/USD analysis as it publishes, today's technical signal and key levels, live price — on one page.
See all EUR/USD forecastsU.S. Dollar Index Technical Analysis: DXY Rebounds From 101.93 as 102.39 Caps the Recovery
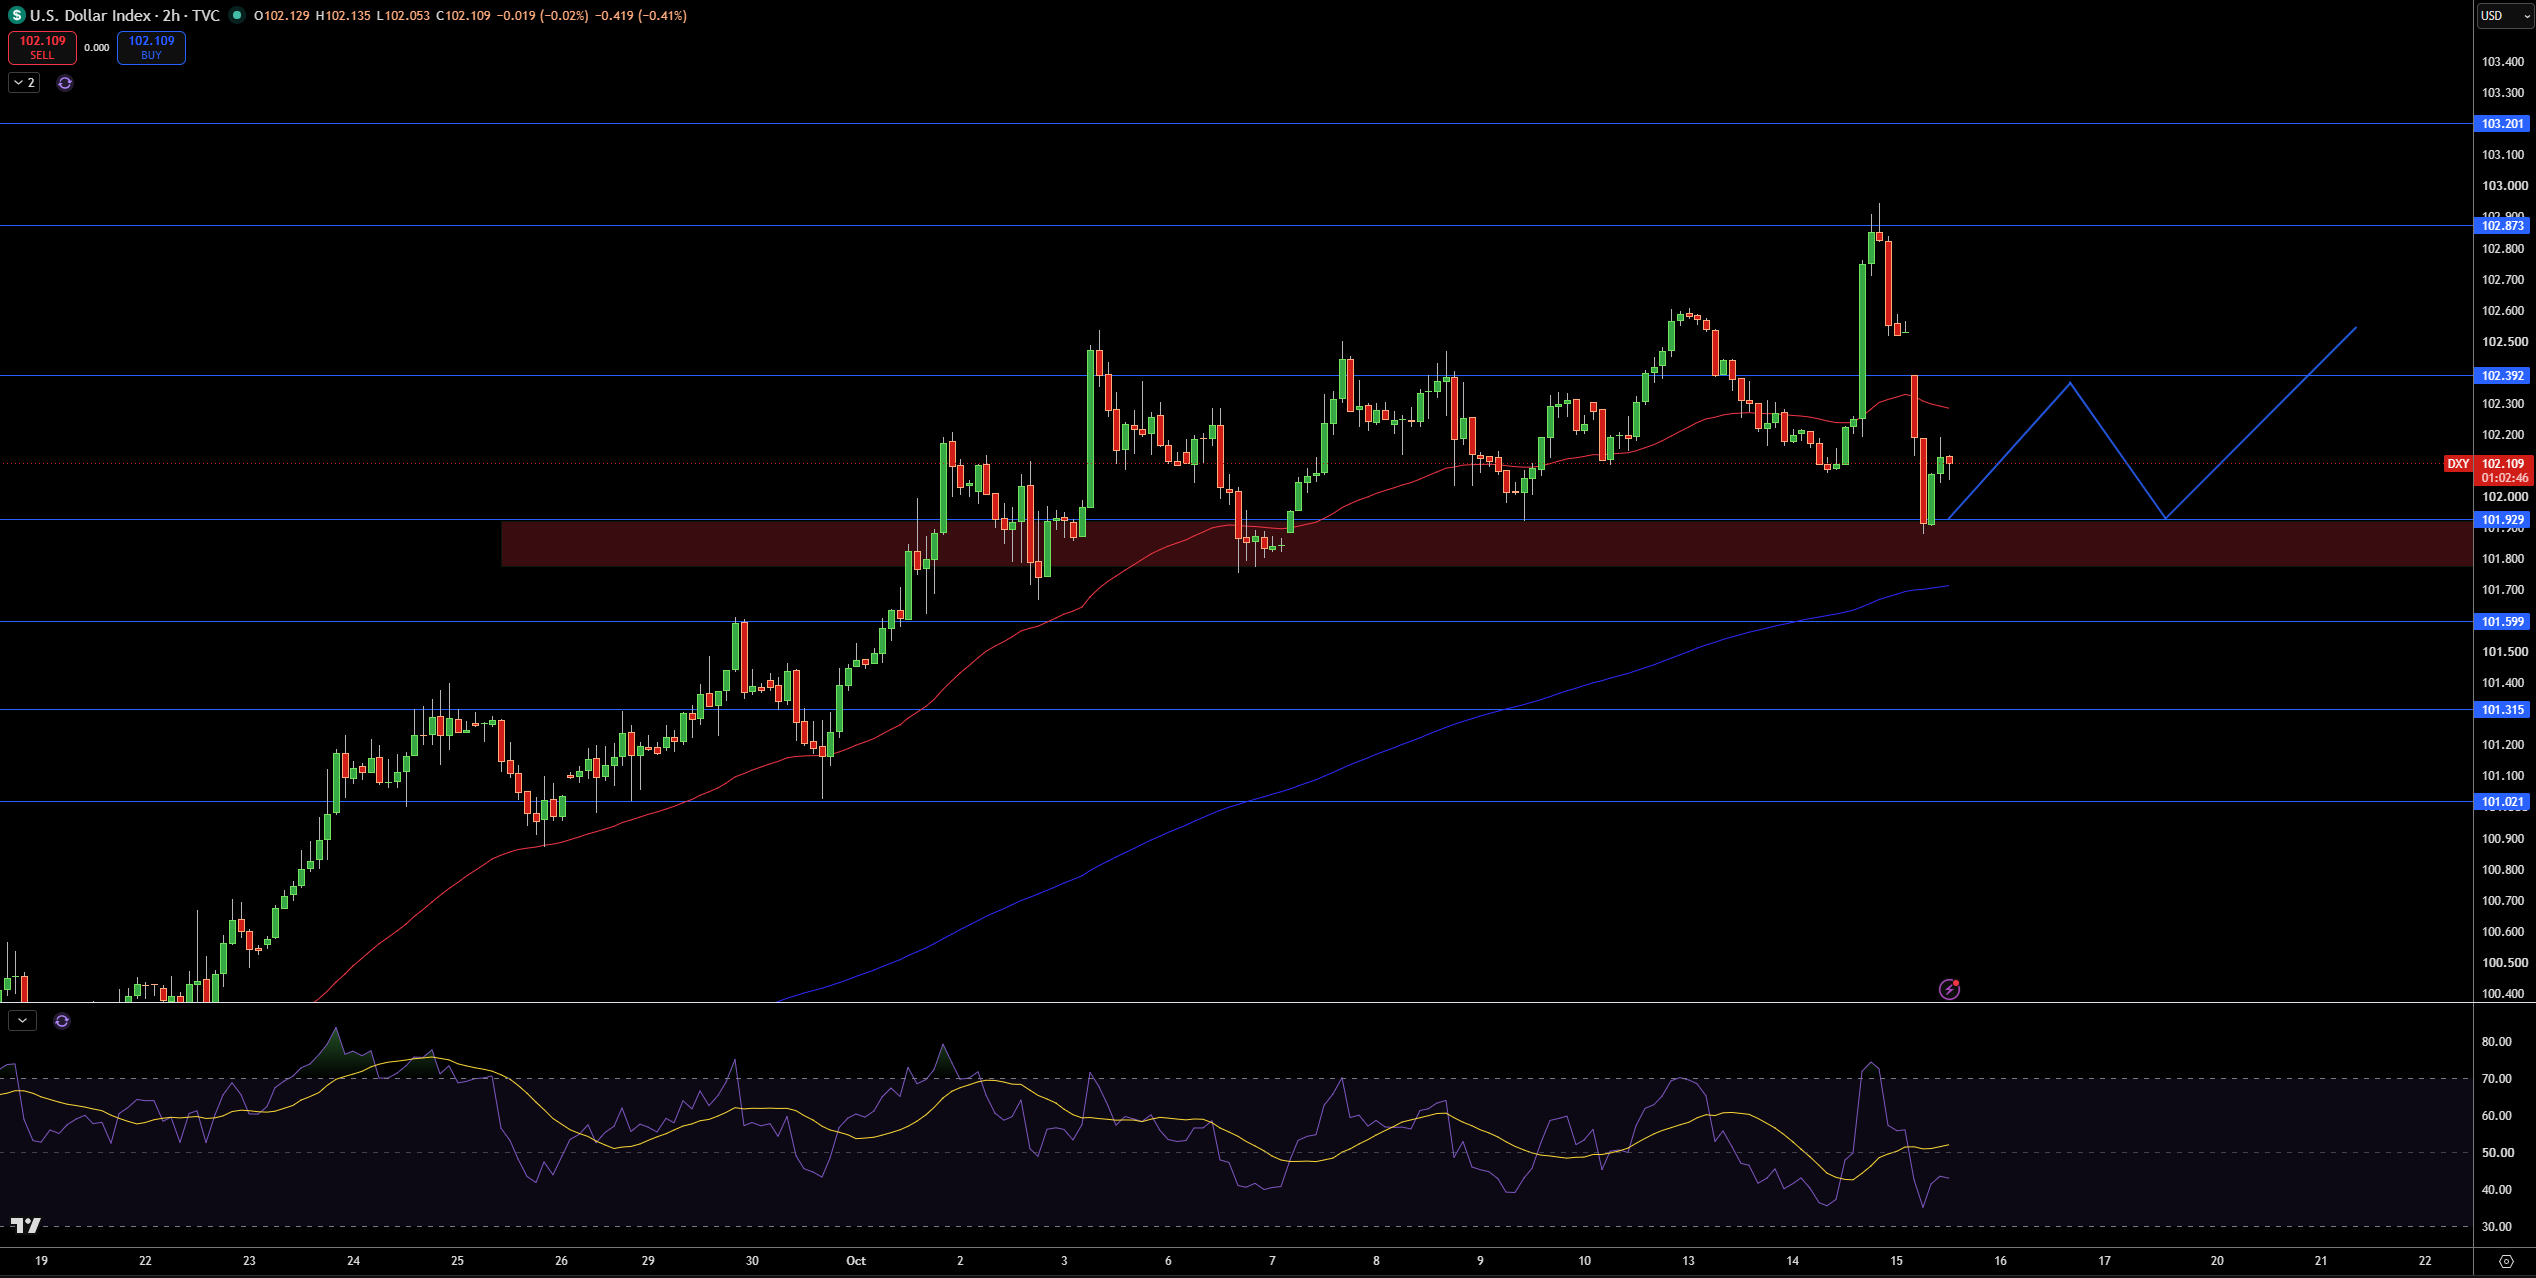
The US Dollar Index is currently trading near 102.15, after bouncing sharply from the 101.93 support area on the 2-hour time frame. Currently, the Dollar is trading above the short-term moving average, however, it is still trading below the 102.39 resistance level, after being rejected from the 102.87 area. This keeps the near-term recovery intact, although further upside may require a sustained break above 102.39.
The first area of interest is the 102.39 resistance area. Should 102.39 break, 102.87 would come into play and be followed by 103.20. Looking at the downside, the 101.93 area would be the first area to watch, followed by 101.60, 101.32 and 101.02.
RSI is hovering near 50, indicating neutral momentum as neither buyers nor sellers have established a clear advantage. With the Dollar trading above 101.93, I would remain slightly bullish. A clear break above 102.39 would increase the probability of a move to the 102.87 area. A clear move below 101.93 would increase the probability of a larger decline in the Dollar.
GBP/USD Technical Analysis: Sterling Breaks Trendline as 1.3284 Becomes the Next Upside Test
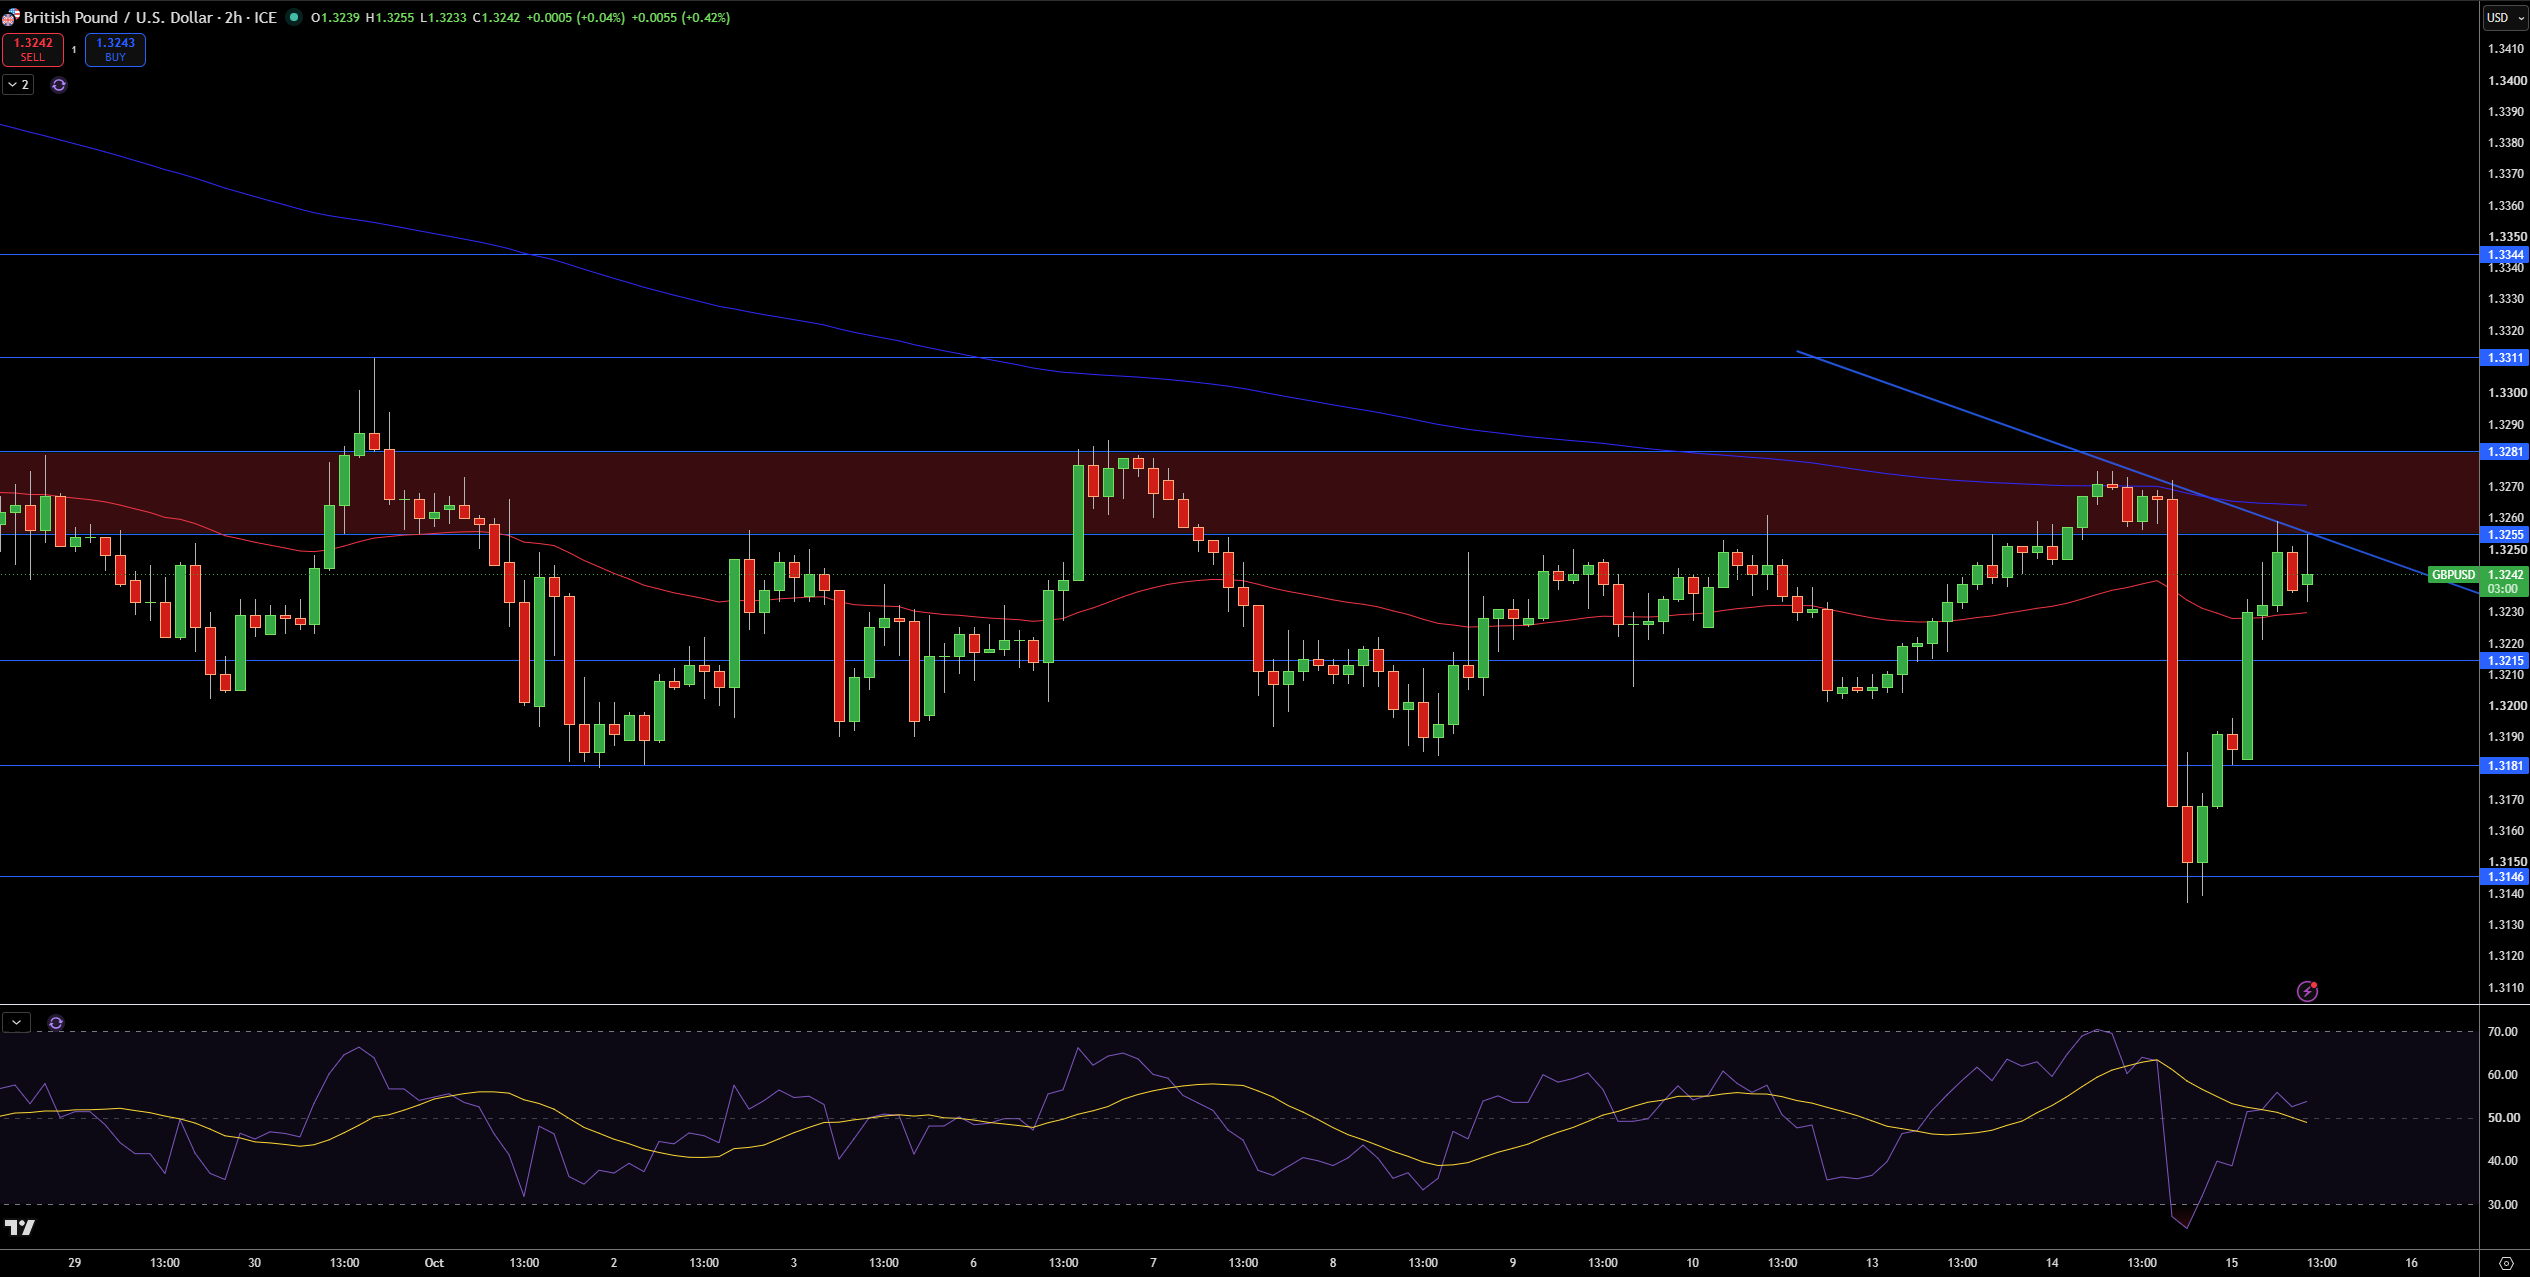
The GBP/USD is currently trading at 1.3242 on the 2-hour chart, and has bounced hard from the 1.3146 support area. What’s interesting is the price has bounced above 1.3215 and the 20-period moving average, but has reached the descending trendline and the 1.3255-1.3281 resistance area. Because of this, I believe the price action in this area will be pivotal for the next direction of the market.
From a trading perspective, 1.3255 is the first area of interest, and a rejection from that resistance could bring 1.3215 back into focus. If the price breaks above the 1.3281 area, the next target will be 1.3311, then 1.3344.
RSI is currently about 50, indicating neutral momentum rather than confirming that the recovery is complete. A sustainable move above 1.3281 will trigger a bullish recovery toward 1.3311, and a break below 1.3215 will reinforce the 1.3181 area. I am overall neutral on GBP/USD.
EUR/USD Technical Analysis: Euro Tests Descending Trendline as 1.1233 Becomes the Breakout Trigger
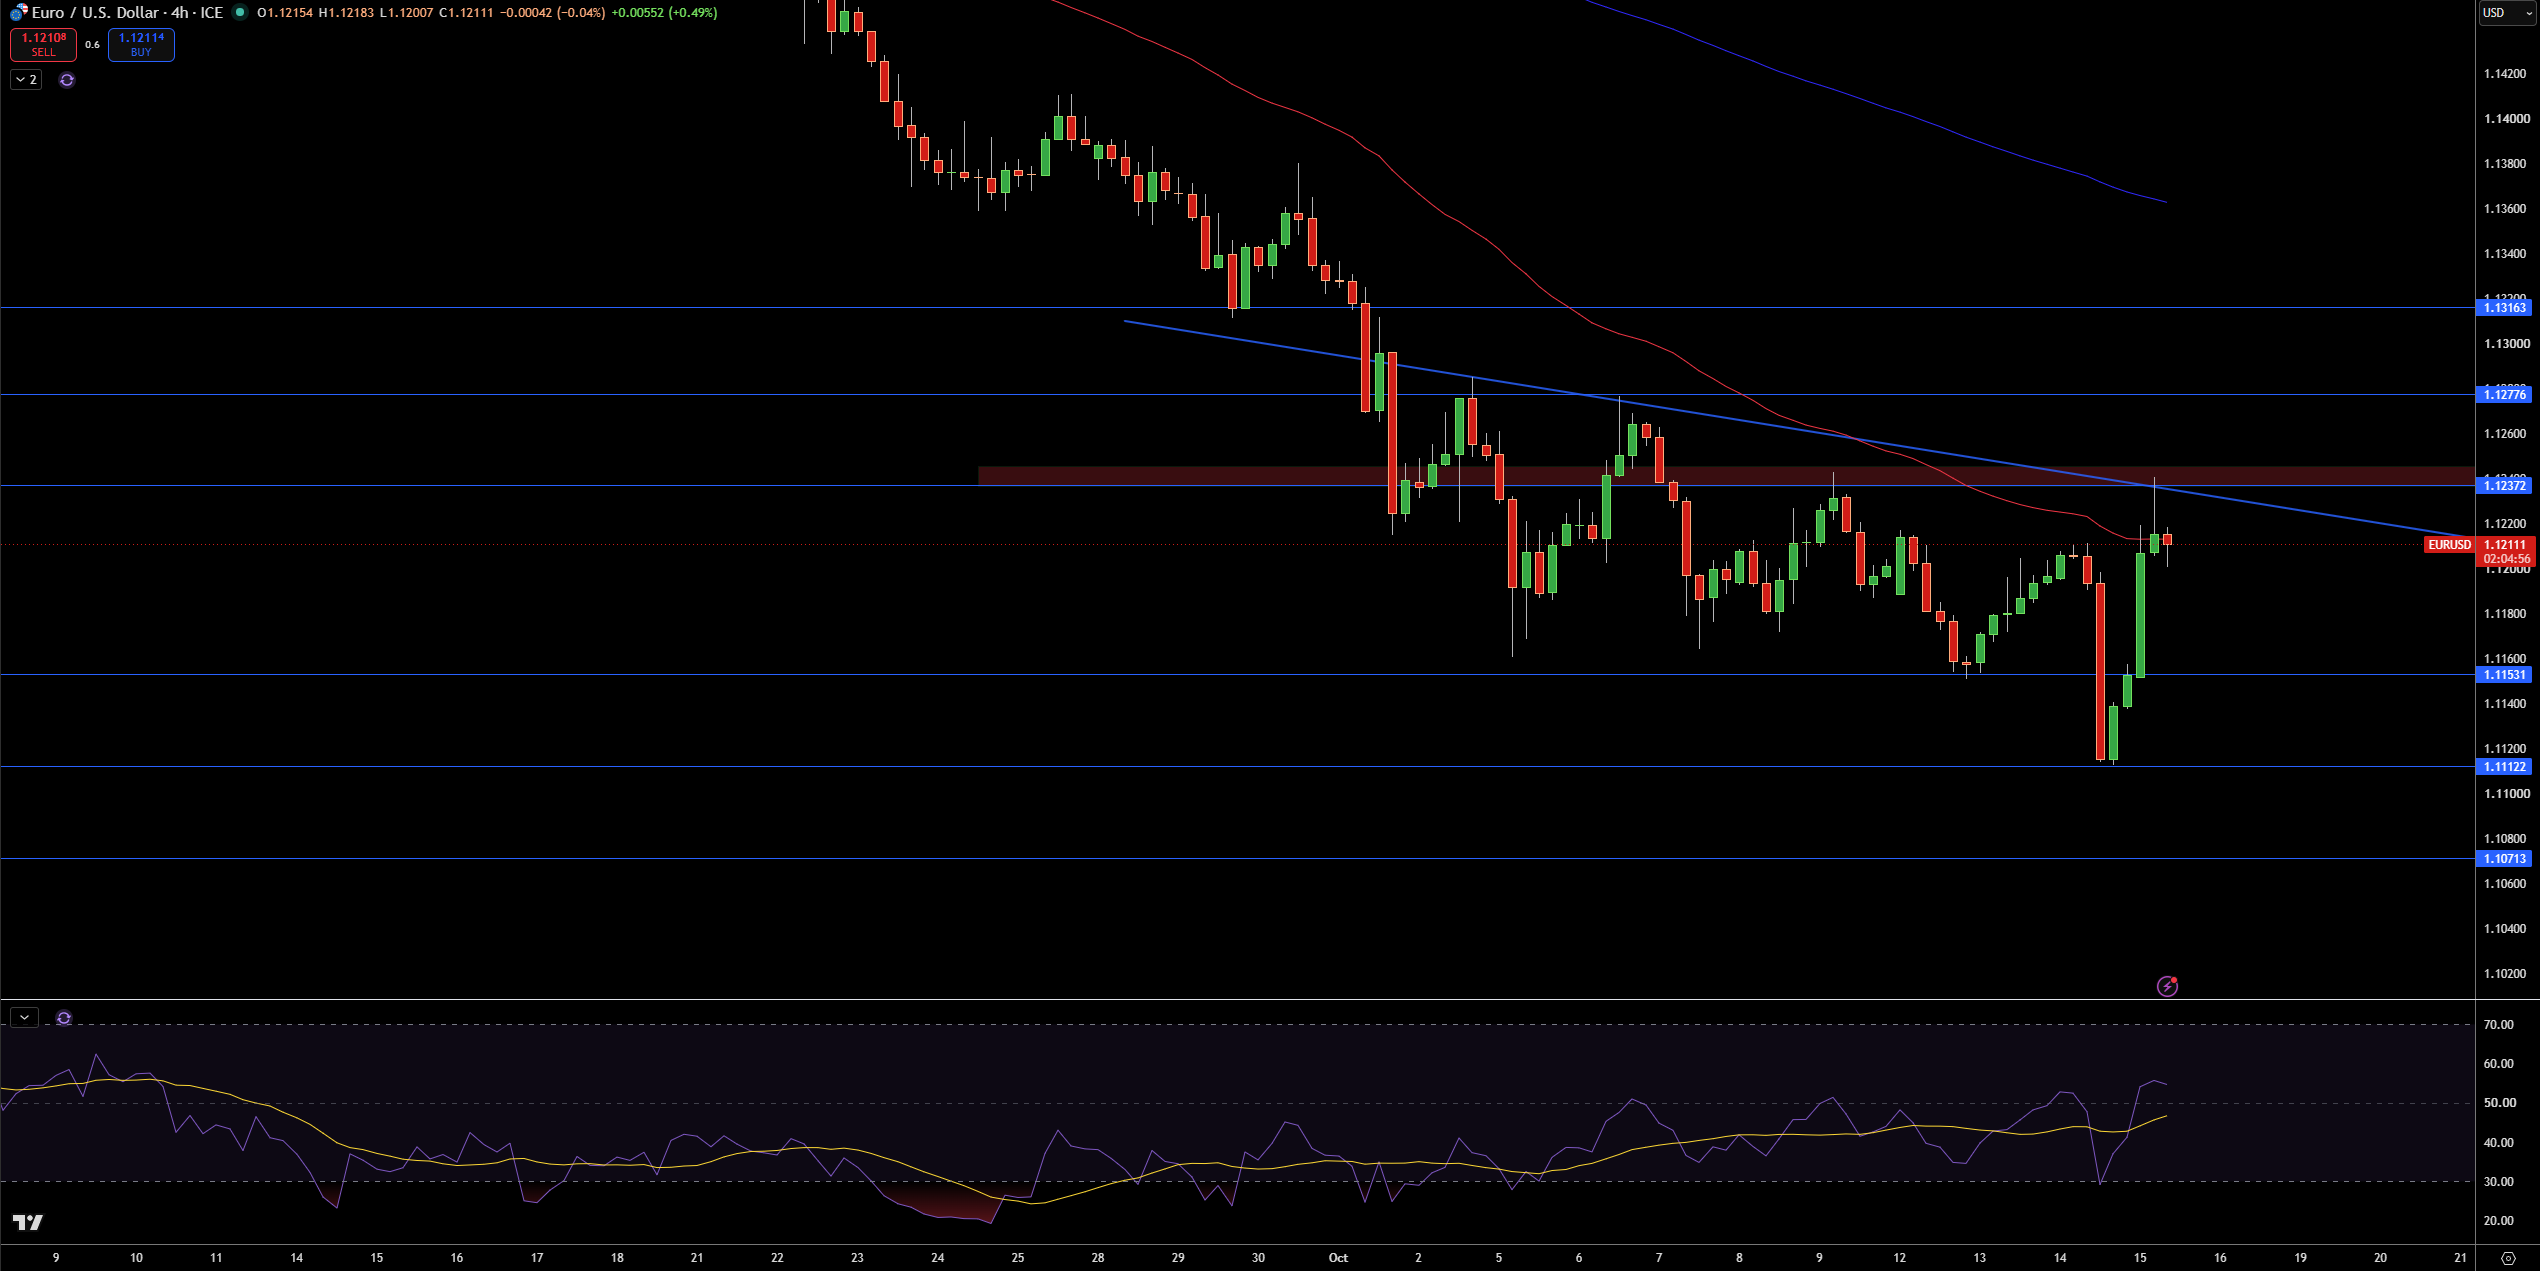
EUR/USD is trading near 1.1211 on the 4-hour chart after bouncing up from 1.1112. Price has since moved above 1.1153, but it remains below the descending trendline and the shorter- term moving average. The broader technical structure remains bearish.
The first area of resistance is at 1.1237. Should price break through that level, the next area of resistance is at 1.1278 and the final area of resistance is at 1.1316. The first area of support is at 1.1153. The second area of support is at 1.1112. The final area of support is at 1.1071. Support may be tested if the rebound fails.
RSI is in the bullish territory and has improved from the previous oversold territory. I am neutral to bearish with a slightly bearish bias while EUR/USD remains below 1.1237 and the descending trendline.
Should EUR/USD break above 1.1237, that would improve the chances of a further rebound. Should it break below 1.1153, that would put 1.1112 back in focus.


