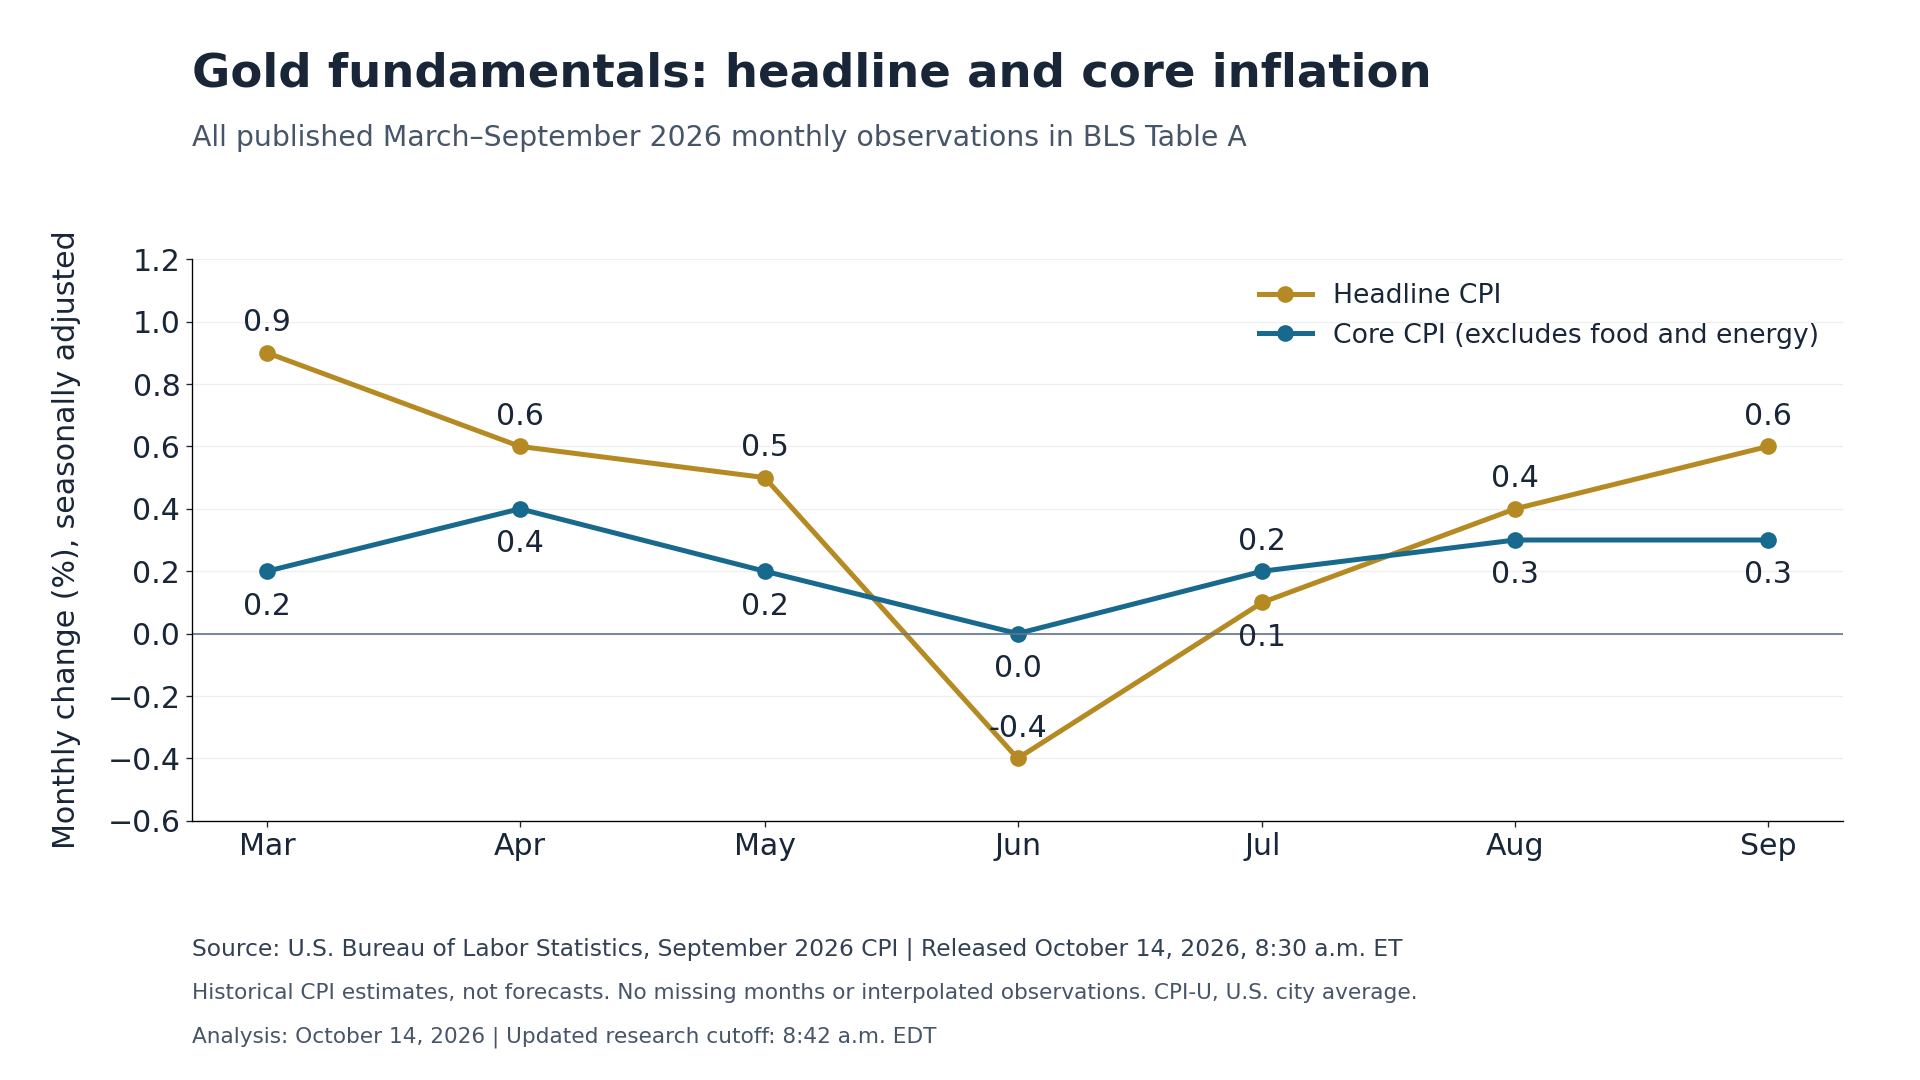
Gold has new inflation noise to absorb on Wednesday, as the BLS release this morning showed September’s consumer prices rising 0.6% in America on a seasonally adjusted monthly basis, following 0.4% in August. Annual headline inflation accelerated from 3.4% to 3.7%.
These are September observations published today and help replace some of the uncertainty that surrounded the release in the earlier report. Core CPI, which excludes food and energy, increased 0.3% in September, matching August’s monthly pace. Its 12-month increase nevertheless accelerated to 2.6% from 2.4%.
The distinction matters. The annual core rate increased without acceleration in the rounded monthly rate. The report therefore points to renewed annual inflation pressure, but does not support describing every underlying measure as suddenly worsening at the same speed when we dig deeper into the report.
The dominant force behind the headline result, of course, was energy, with gasoline prices rising 9.1% in September, accounting for more than half of the monthly all-items increase. The broader energy index rose 5.2%, compared with 2.1% in August. Shelter increased 0.4%, while food prices were largely unchanged.
This suggests that headline acceleration is being heavily influenced by energy, a combination that we’ve seen work against gold prices over the last several months.

For Gold, This Creates Competing Fundamental Channels
A renewed rise in the cost of living can strengthen interest in purchasing-power protection, but at the same time, persistent inflation can increase the likelihood of monetary restraint, making interest-bearing assets more competitive with the metal that produces no income, like gold.
The policy and real-yield response matters more than assuming a high CPI reading must automatically be bullish for gold, as some would think. The core details explain why the energy shock cannot be dismissed. Shelter’s monthly increase rose from 0.3% to 0.4%, and services excluding energy services advanced 0.4%, compared with 0.3% in August.
These are broader price categories than gasoline. They do not prove that the energy costs caused the services increase, but they give policymakers reasons to examine persistence beyond the volatile fuel component of the readings.
The Federal Reserve’s latest completed policy action remains its 25-basis-point increase on September 16, which lifted the target range to 3.75% to 4%. Today’s CPI does not necessarily guarantee another rate decision, nor does the release establish how much of the result financial markets have already anticipated.
No official consensus forecast was verified for this update. So, at this point, the figures are simply compared with previous observations rather than a market surprise according to Federal Reserve estimates or lack thereof.
Gold Price Forecast
Every new Gold analysis as it publishes, today's technical signal and key levels, live price — on one page.
See all Gold forecastsYields Continue to Be in Focus
The Treasury’s latest daily table shows the 10-year real par yield at 2.88%, down from 2.91% a week ago. These observations, though, preceded the CPI reading, and as we look at gold, we also see Treasury yields climbing.
The next inflation checks will be September producer prices tomorrow morning in New York and the FOMC meeting on October 27 and 28. Further evidence of persistent price pressure would reinforce policy change, or at least the challenge. Moderation across a broader set of categories would weaken it.
Gold now faces a more complicated inflation backdrop than the pre-release situation. Demand for protection could strengthen, but at the same time, a substantial increase in real yields would create competing headwinds.
Watching yields in America, and whether or not they are climbing or falling, could be a way to determine whether or not gold is a tradable asset. We are currently testing a major demand zone between $4,200 and $4,000, and the initial reaction, of course, has been very negative.
Technical Outlook
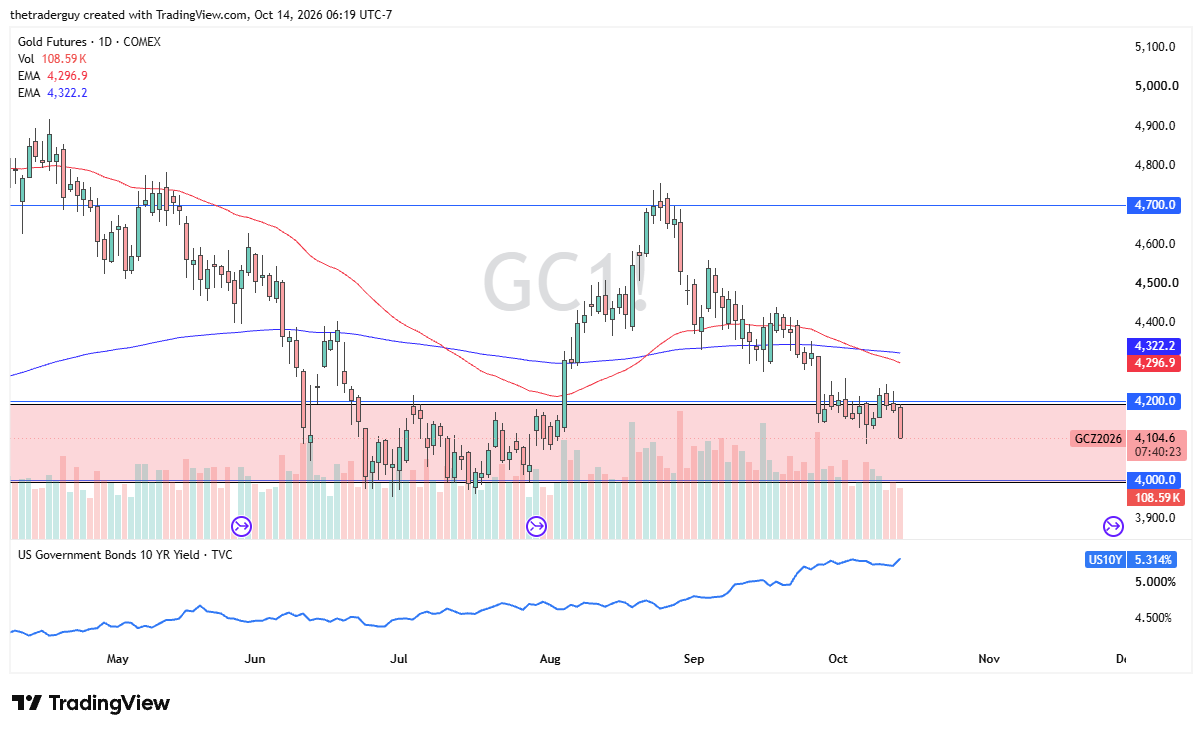
Whether the dip buyers come back to try to pick up cheap ounces of gold remains to be seen, but it certainly is a technically important region. Watch those yields. They could be our clue. If yields start to drop again and we are within the demand zone, I will be looking to take a short-term trade.