Repeated Breakdown Attempts Fail at Key Support
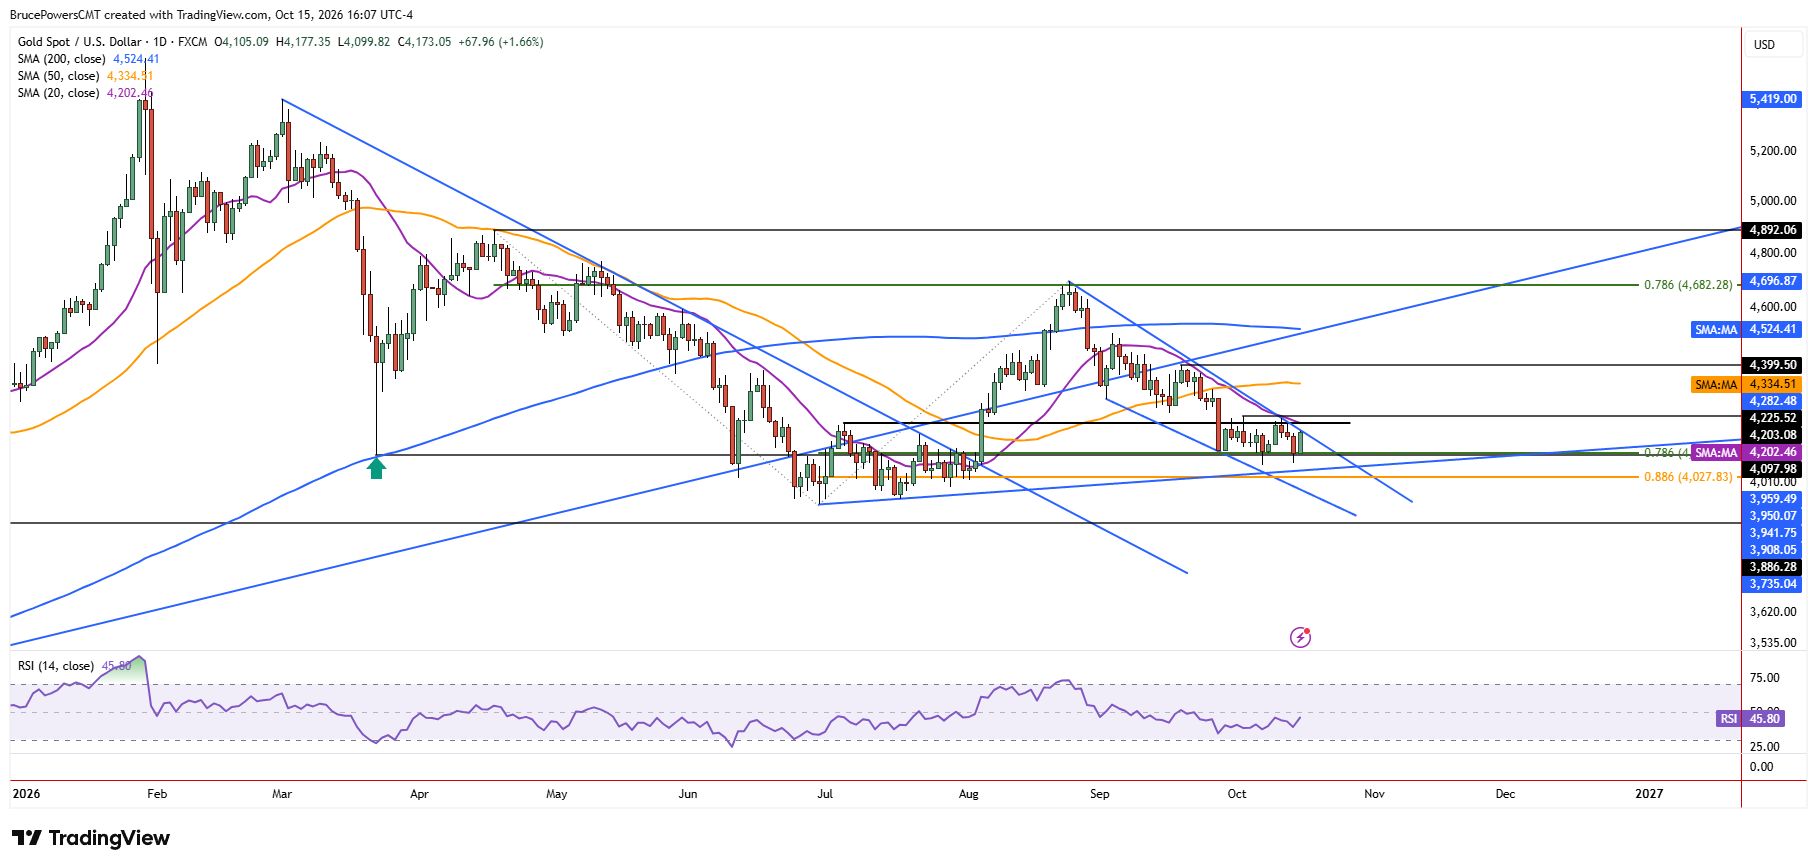
Gold consolidated on Thursday following a retest of the recent low on Wednesday. A low of $4,073 was reached on Wednesday, putting gold close to the corrective low of $4,066 from last week. During Wednesday initial decline support at the 78.6% Fibonacci retracement at $4,103 broke but it was recovered before the end of the session and closed above the indicator, a sign of short-term strength. That was the second failed breakdown below that Fibonacci level and adds to the significance of the zone.

Weekly Reversal Awaits Confirmation
Last week ended with a bullish hammer candlestick pattern and a close near the high of the week. Subsequently, a bullish weekly reversal signal occurred on Monday above last week’s high of $4,208 but it did not confirm with a daily close above it. Nonetheless, gold remains on track to end the week with a higher weekly low and a higher weekly high. A weekly close above the current middle of the week’s range at $4,145 would provide a sign of strength on that larger timeframe.
Holding the Line at $4,103
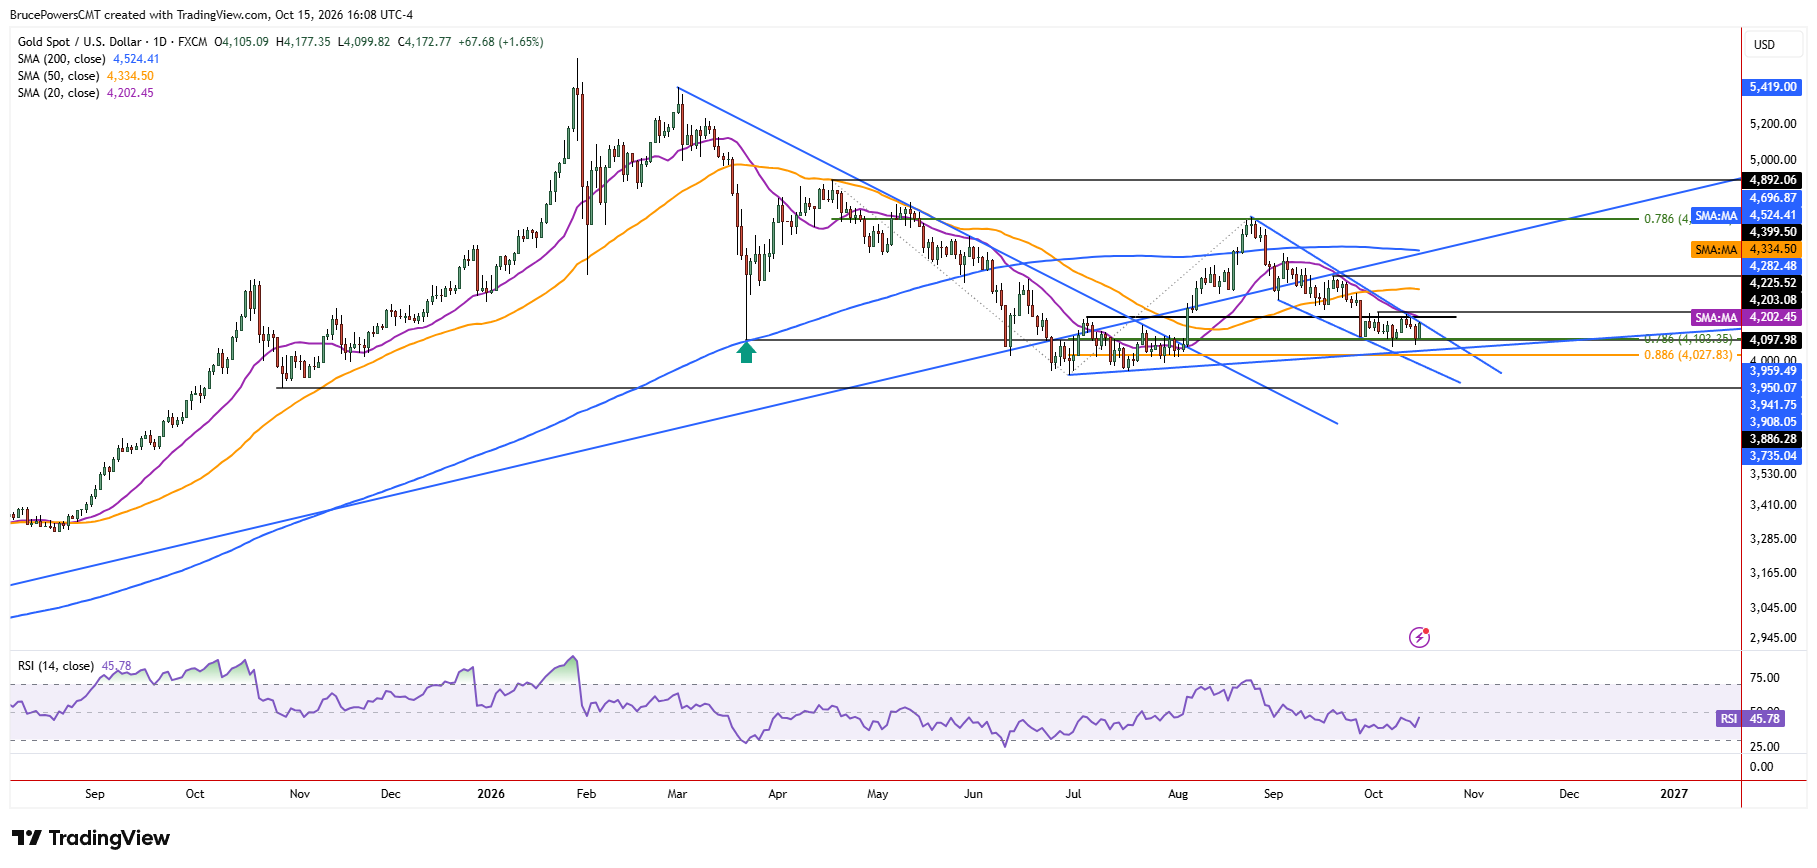
So far, gold has failed to decisively extend its bearish trend and continues to hold a key support zone near the 78.6% Fibonacci retracement at $4,103. Notably, support was found nearby at $4,098 during the sharp selloff that occurred in March. Unless a new high for the day is reached before the end of the session, Thursday is on track to complete an inside day, with trading contained within Wednesday’s range.
$4,200 Reclaim Would Strengthen the Bullish Case
Bullish signs would begin to develop if gold can reclaim its 20-day moving average around $4,202 and a bullish reversal signal would occur above the recent lower swing high of $4,226. That would then need to be followed by further signs of strength. Key support is near the two recent lows of $4,073 and $4,066. However, the next lower support areas are near a rising trendline and the 88.6% Fibonacci retracement of the prior advance at $4,028.