Stocks Find Buyers Outside Tech as Hot PPI Keeps Fed in Play
The stock market is trying to stabilize Thursday, but the split remains clear. The Dow and S&P 500 are higher because buyers are moving into areas outside technology. The Nasdaq is attempting to rebound, but the AI and memory-chip trades are still taking the heat.
The PPI report did not help. Wholesale prices came in hotter than expected for a second straight inflation warning after Wednesday’s CPI number. Treasury yields fell anyway as buyers moved into bonds, while gold found support from the lower yields and weaker dollar.
At 15:24 GMT, the Dow Jones Industrial Average is trading 52,187.16, up 565.68 or +1.10%. The S&P 500 Index is trading 7,731.76, up 12.82 or +0.17%, while the Nasdaq Composite is trading 26,630.037, down 62.831 or -0.24%.

PPI Adds to the Fed Problem
September producer prices rose 1.3% from August and 6.3% from a year earlier, above estimates of 0.6% and 5.5%. The report followed Wednesday’s hotter-than-expected CPI reading.
The two reports keep another Fed rate increase in front of the market. Fed funds futures still price in at least one more quarter-point hike by year-end, although comments from San Francisco Fed President Mary Daly and Vice Chair for Supervision Michelle Bowman helped limit expectations for an October move.
Treasury buyers looked past the PPI number Thursday and bought bonds as technology stocks broke. The 10-year yield fell toward 5.06%. Gold climbed more than 1% as the dollar weakened and yields came down after three straight losing sessions.
Tech Sellers Are Still in Control
CoreWeave is down another 7% after dropping more than 15% Wednesday. The stock is paying for concerns over the debt needed to fund its AI build-out after its corporate bond yields jumped.
S&P 500 Price Forecast
Every new S&P 500 analysis as it publishes, today's technical signal and key levels, live price — on one page.
See all S&P 500 forecastsMicron and SK Hynix are also lower as traders worry China will add enough memory-chip capacity to create a glut. Anthropic’s reported third-quarter revenue of $16.8 billion added to the concern that the AI spending story may not be growing fast enough to support the gains already built into the chip trade.
The money leaving tech is not leaving stocks altogether. Walmart is up 4% and Merck is higher by more than 3%. That is why the Dow is higher, but it does not repair the Nasdaq. The Russell 2000 is already in correction territory, down 11% from its August record close.
Daily S&P 500 Index (SPX) Technical Analysis
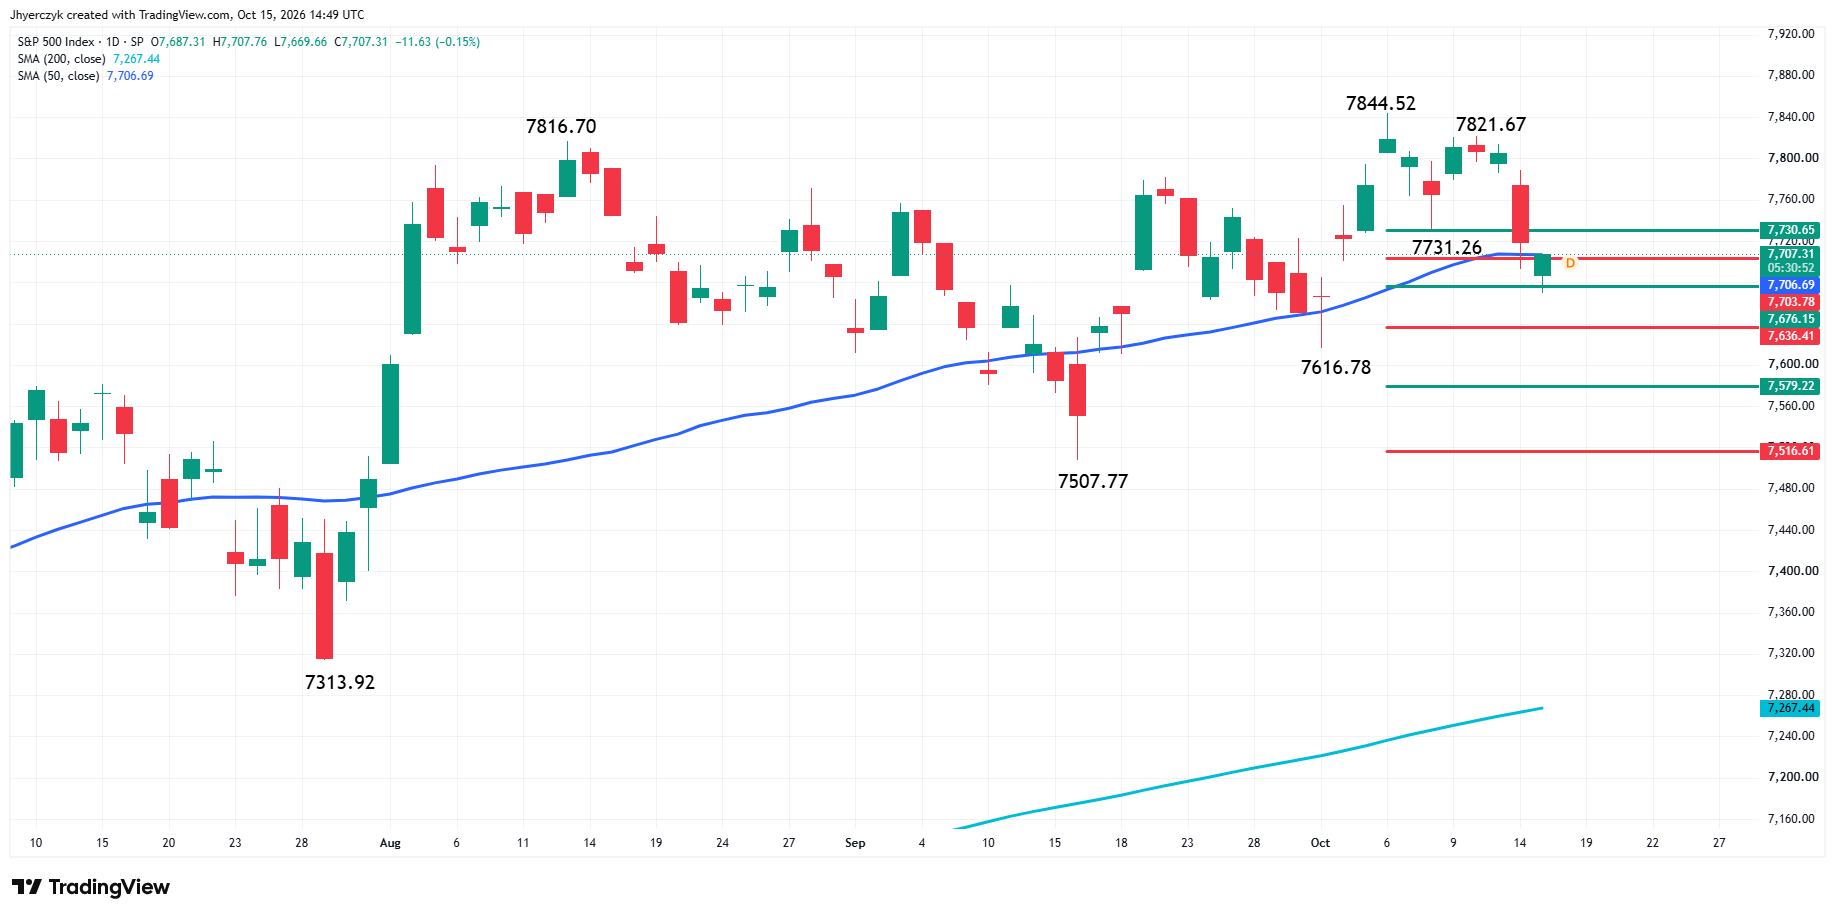
The S&P 500 IndexS&P 500 Index is lower on Thursday after crossing to the weak side of the 50-day moving average at 7706.70.
The main trend is down according to the daily swing chart. The trend turned down on Wednesday when sellers took out the 7731.26 swing bottom. The trend will change to up when buyers take out 7821.67. The next potential downside target is the swing bottom at 7616.78.
Retracement zone resistance is 7703.78 to 7730.65. Retracement zone support is 7676.15 to 7636.41 and 7579.22 to 7516.61.
My bias is to the downside with the main trend down and the index trading on the weak side of the 50-day moving average. I realize that the moving average could act like a pivot and can produce counter-trend trading if buyers recapture it, but that’s the risk when trading the swings.
Daily US Ten-Year Treasury Note Yield Technical Analysis
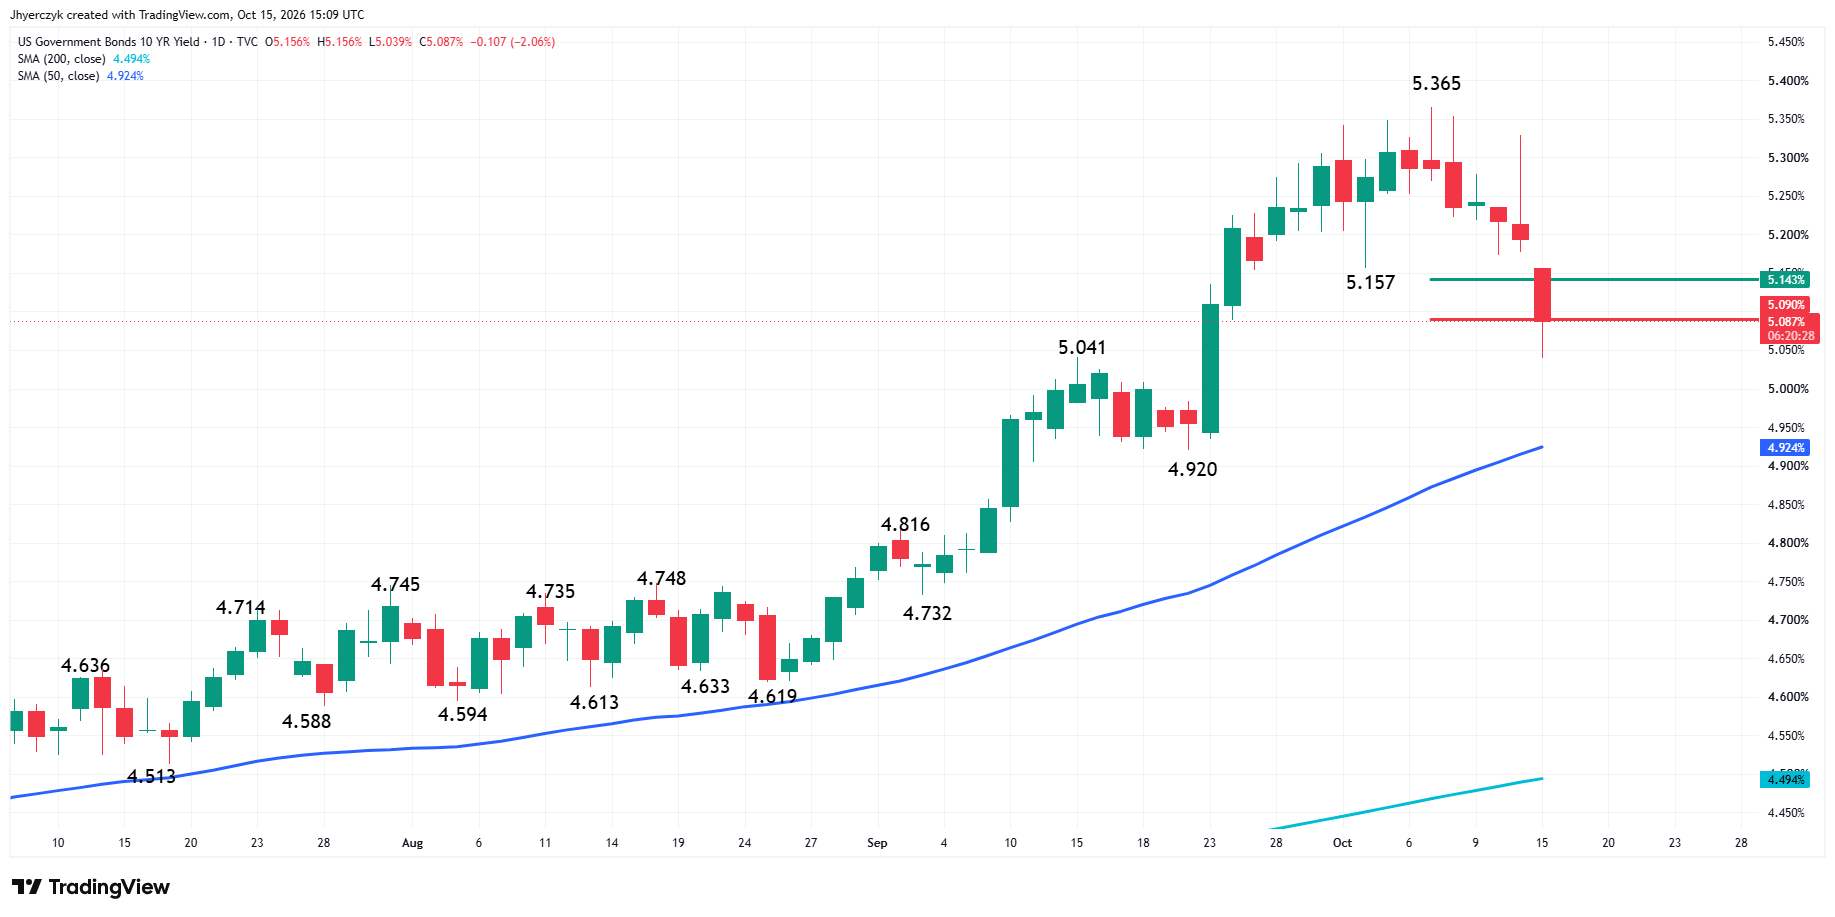
Ten-year Treasury yields are sharply lower on Thursday. The main trend turned down according to the daily swing chart when sellers took out the previous swing bottom at 5.157%. The uptrend will resume if the yield takes out 5.365%.
The short-term range is 4.920% to 5.365%. This morning, the yield crossed to the weak side of its retracement zone at 5.143% to 5.090%. This could turn the zone into resistance.
If selling pressure persists, the next downside target is the 5.041% swing low. A break through it would put the 50-day moving average at 4.924% in play.
It looks as if the rapid rise in yields is over for now. The longer-term outlook will likely be determined by trader reaction to the 50-day moving average. The short-term direction will hinge on the reaction to the retracement zone. We could see a counter-trend rally on a sustained move over the 50% level at 5.143%. Meanwhile, a sustained move under the 61.8% level at 5.090% could create the downside momentum needed to challenge the 5.041% swing low.
Daily Spot Gold (XAUUSD) Technical Analysis
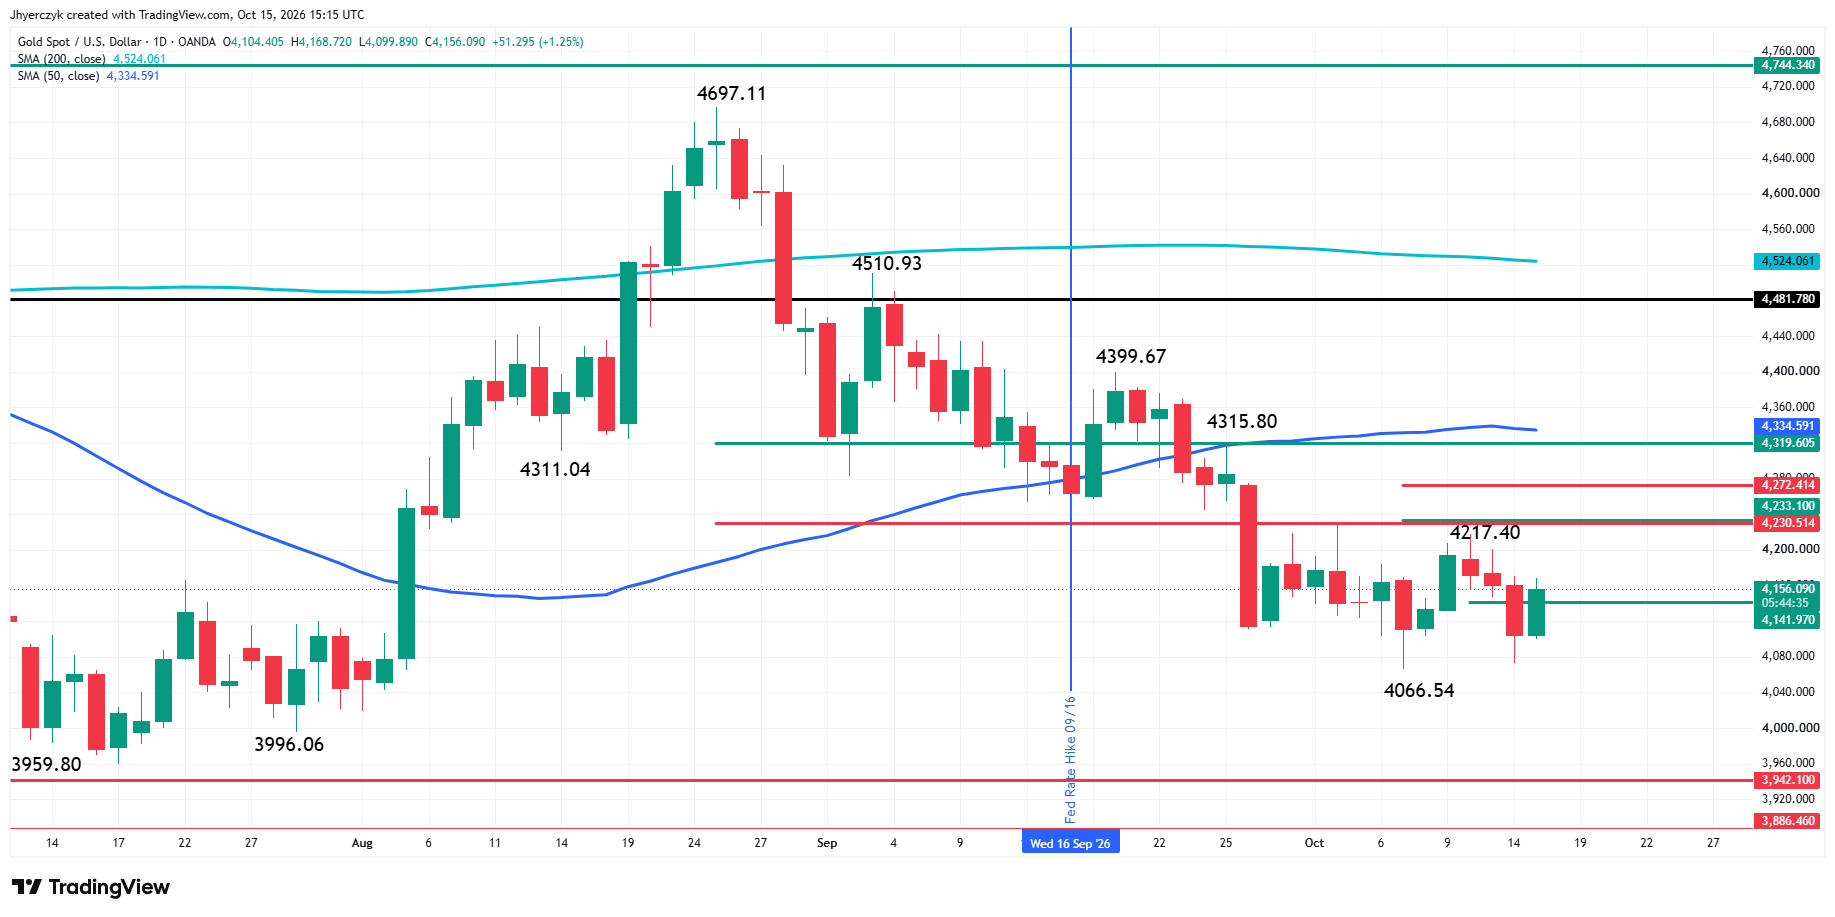
Spot Gold is edging higher on Thursday as traders continue to test the key pivot at $4141.97.
The main trend is down according to the daily swing chart. A trade through $4066.54 will signal a resumption of the downtrend with potential targets at $3996.06 to $3942.10. A trade through $4217.40 will change the main trend to up.
The short-term range is $4066.54 to $4217.40. Its 50% level is $4141.97. Trader reaction to this level is likely to set the tone into the close on Thursday.
What to Watch
The Dow and S&P 500 are higher, but the market has not settled the technology problem. A rebound in the Nasdaq has to be followed by stabilization in CoreWeave, Micron and the memory-chip group. Until then, the broad market is leaning on defensive buyers while the former leaders remain under pressure.
The S&P 500 needs to regain the 50-day moving average and clear the retracement resistance zone to ease the downside pressure. The 10-year yield is testing lower support after the bond rally, while gold is working around its midpoint. The close will show whether the yield break is holding or whether buyers were only covering shorts after the tech sell-off.
More Information in our Economic Calendar.