
U.S. Dollar Pulls Back Amid Falling Treasury Yields
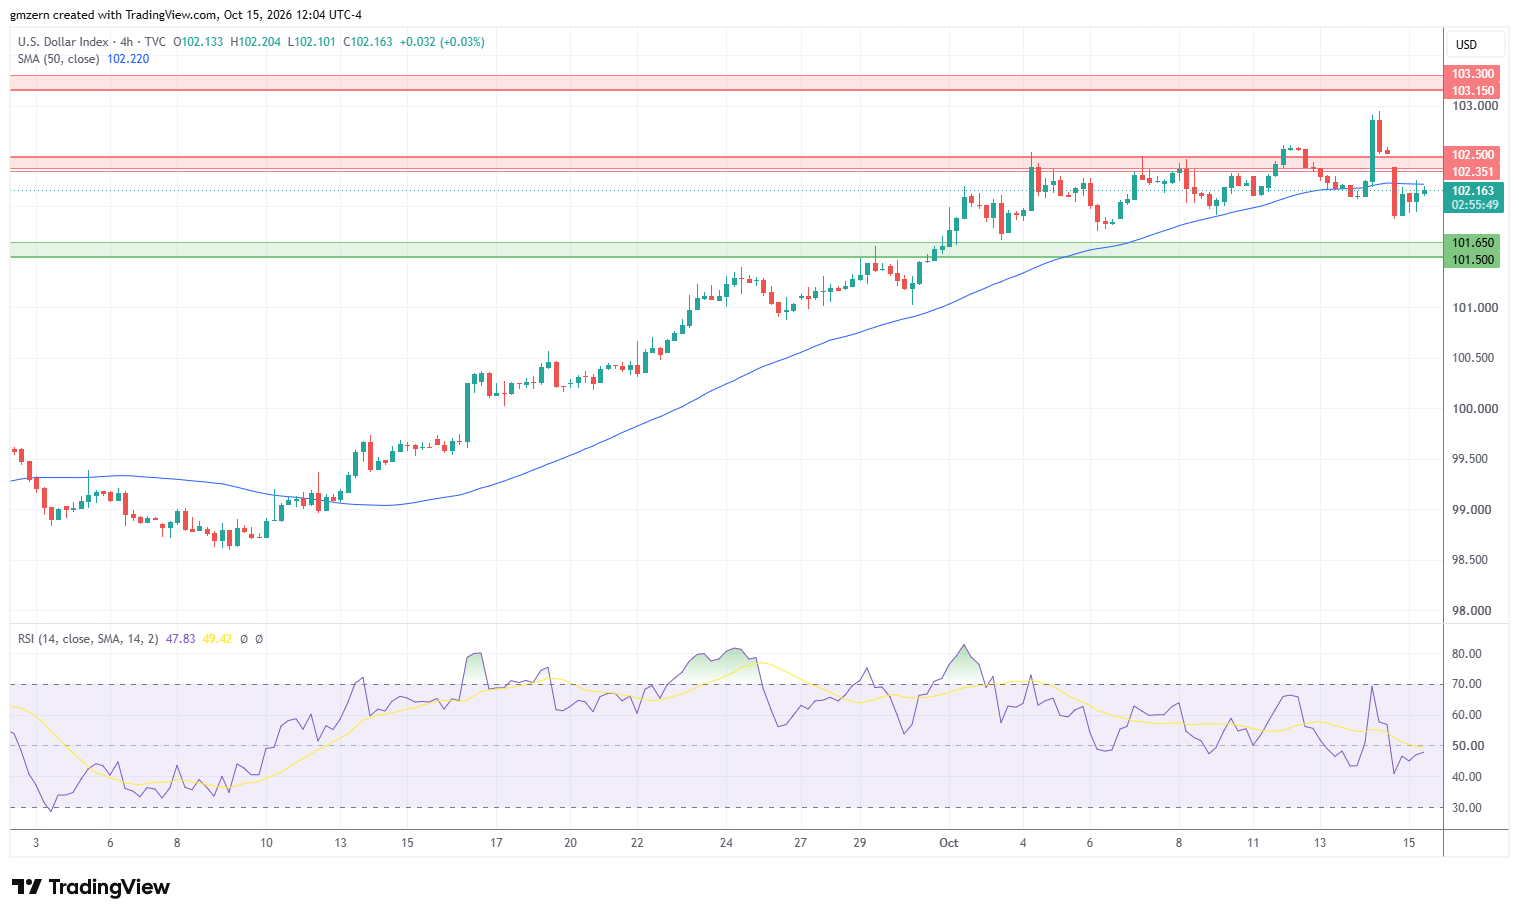
U.S. Dollar Index is losing ground despite strong Retail Sales data and higher-than-expected PPI report.
Retail Sales increased by +0.8% month-over-month in September, compared to analyst forecast of +0.3%.
PPI increased by +1.3% month-over-month in September, while analysts expected that it would grow by +0.5%.
Traders also had a chance to take a look at the Initial Jobless Claims report. The report showed that 199,000 Americans filed for unemployment benefits in a week, mostly in line with the analyst forecast of 200,000.
The strong pullback in Treasury yields served as a negative catalyst for the American currency. Treasury yields moved lower as traders rushed to buy bonds amid sell-off in AI stocks.
In case U.S. Dollar Index settles below the 101.90 level, it will head towards the nearest support, which is located in the 101.50 – 101.65 range. On the upside, a successful test of the resistance at 102.35 – 102.50 will open the way to the test of the next resistance level at 103.15 – 103.30.

EUR/USD Rebounds From Yearly Lows
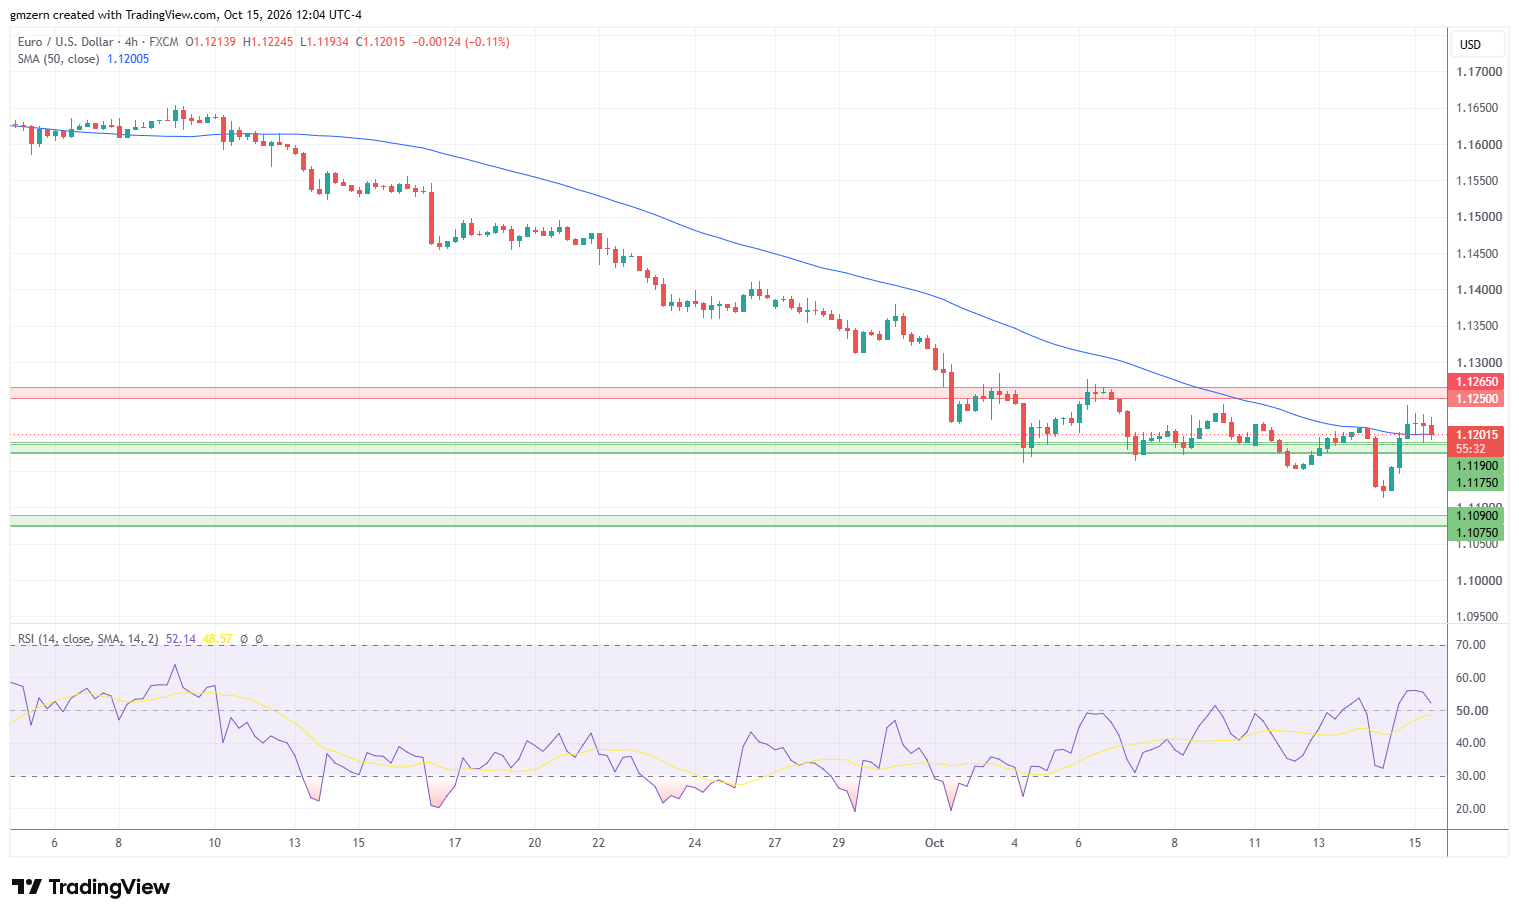
EUR/USD moved higher as traders focused on developments in bond markets and ignored the weak Euro Area Industrial Production report. The report indicated that Euro Area Industrial Production decreased by -0.5% month-over-month in August, compared to analyst forecast of +0%.
If EUR/USD stays above the 50 MA at 1.1200, it will head towards the resistance level at 1.1250 – 1.1265. On the support side, a move below the 1.1175 level will push EUR/USD towards the support at 1.1075 – 1.1090.
EUR/USD Price Forecast
Every new EUR/USD analysis as it publishes, today's technical signal and key levels, live price — on one page.
See all EUR/USD forecastsGBP/USD Moves Higher As UK GDP Exceeds Estimates
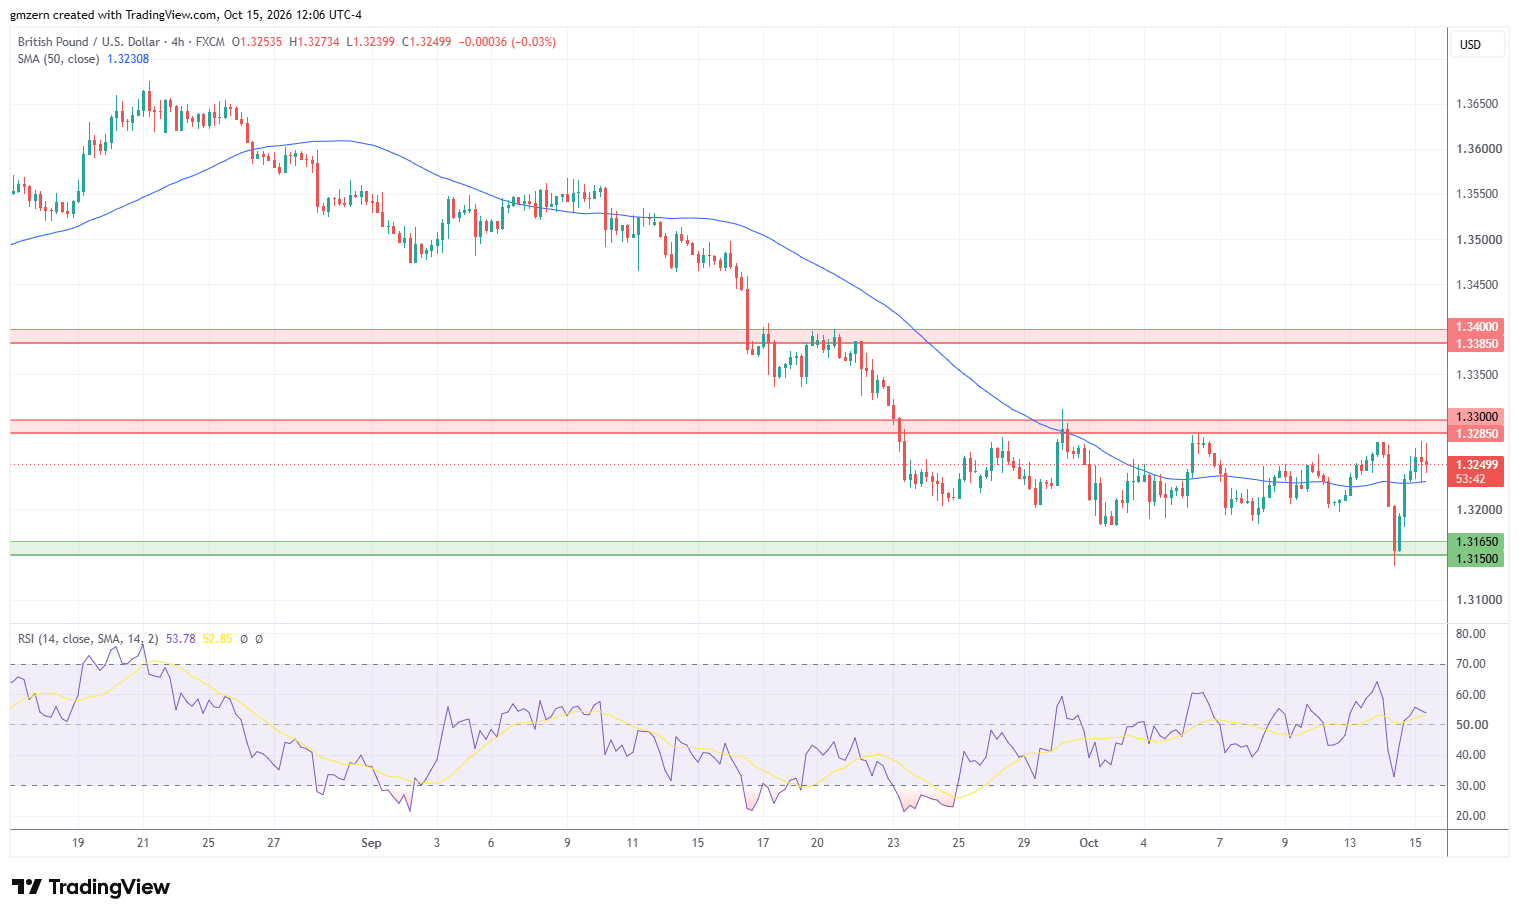
GBP/USD gained ground as traders focused on the better-than-expected UK GDP report. The report showed that UK GDP increased by +0.1% month-over-month in August, compared to analyst forecast of -0.1%.
The nearest resistance level for GBP/USD is located in the 1.3285 – 1.3300 range. In case GBP/USD climbs above the 1.3300 level, it will head towards the next resistance, which is located in the 1.3385 – 1.3400 range.
USD/CAD Moves Lower As Precious Metals Rebound
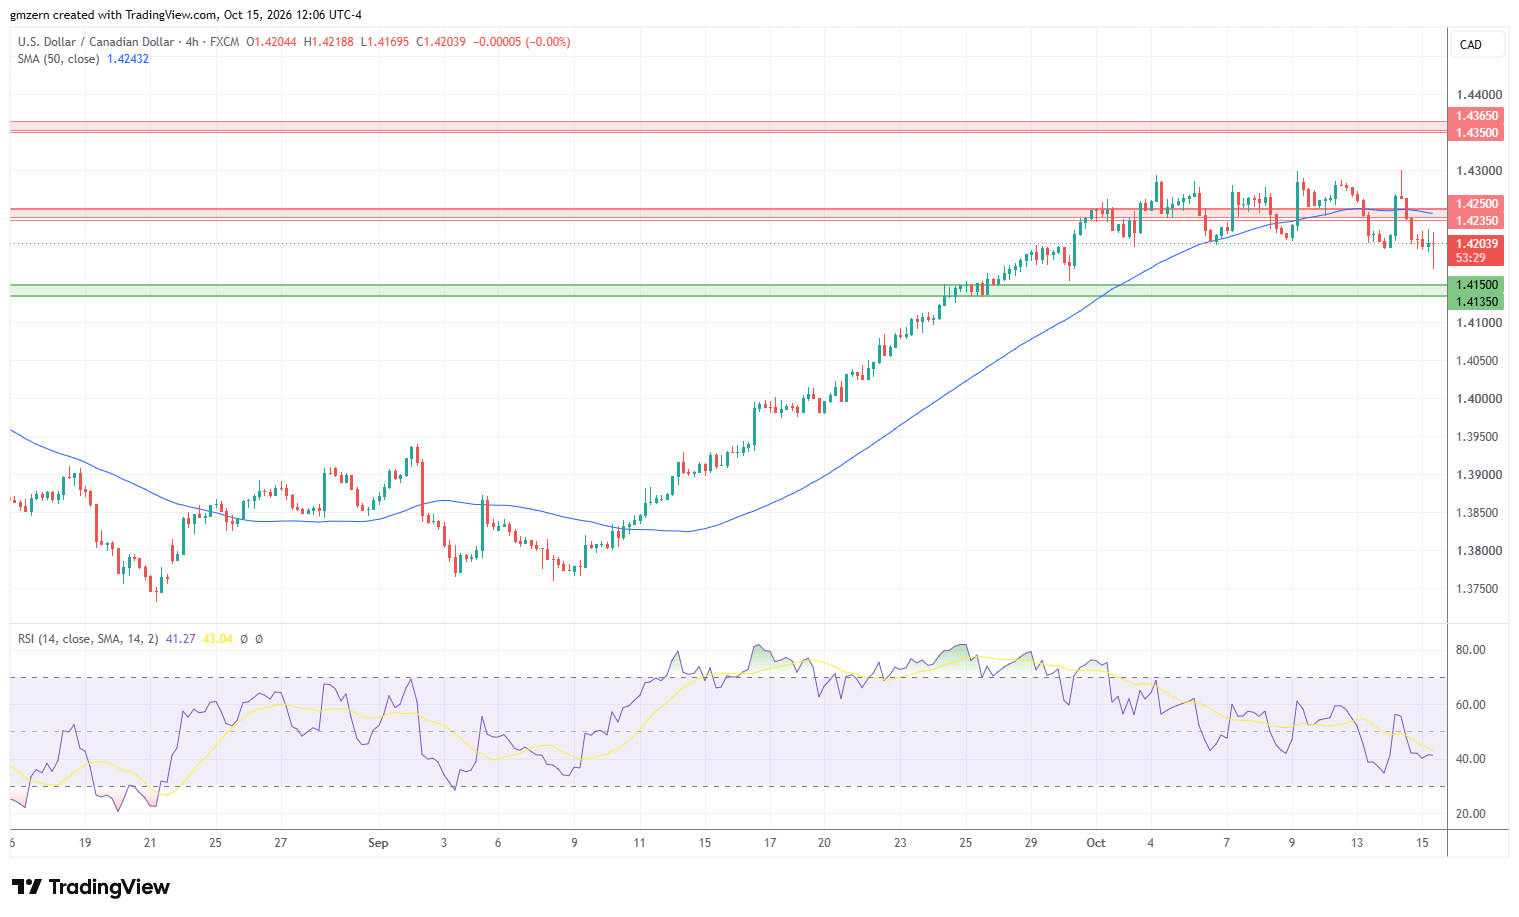
USD/CAD pulled back as traders focused on the strong rebound in precious metals markets. Gold gained 1%, while silver was up by +2.4%.
Currently, USD/CAD is trying to settle below the 1.4200 level. In case this attempt is successful, USD/CAD will head towards the support level at 1.4135 – 1.4150. On the upside, a successful test of the resistance level at 1.4235 – 1.4250 will push USD/CAD towards the 1.4300 level. If USD/CAD climbs above 1.4300, it will head towards the next resistance at 1.4350 – 1.4365.
USD/JPY Remains Stuck Near Resistance At 158.00 – 158.50
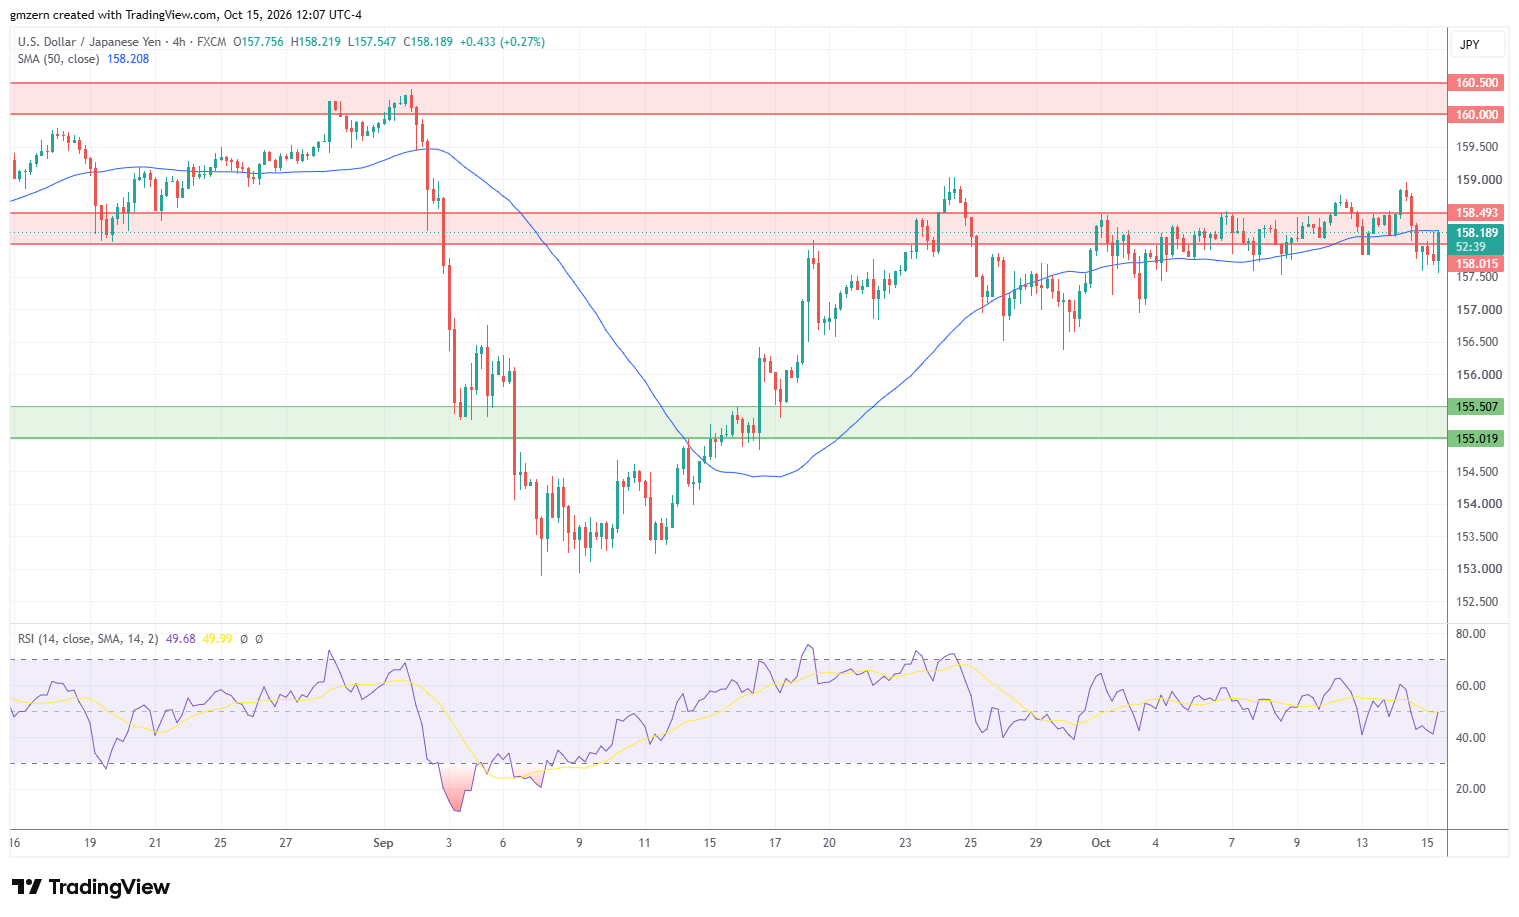
USD/JPY is mostly flat despite the strong pullback in Treasury yields. The yield of 2-year Treasuries declined towards the 4.75% level, while the yield of 10-year Treasuries settled below 5.10%.
The technical picture remains unchanged as USD/JPY is stuck near the resistance level at 158.00 – 158.50. RSI is in the moderate territory, so there is plenty of room to gain momentum in case the right catalysts emerge. A move above the 158.50 level will open the way to the test of the resistance level at 160.00 – 160.50.
If you’d like to know more about how to trade forex, please visit our educational area.