



Oil Market Tightens as US Stocks Draw and Washington Weighs Tanker Relief
Risks in energy markets continued to outpace policy relief on Friday, October 16. Emergency stock releases and possible easing of sanctions are up against new threats to Gulf shipping.

WTI: US Inventories Draw Hard
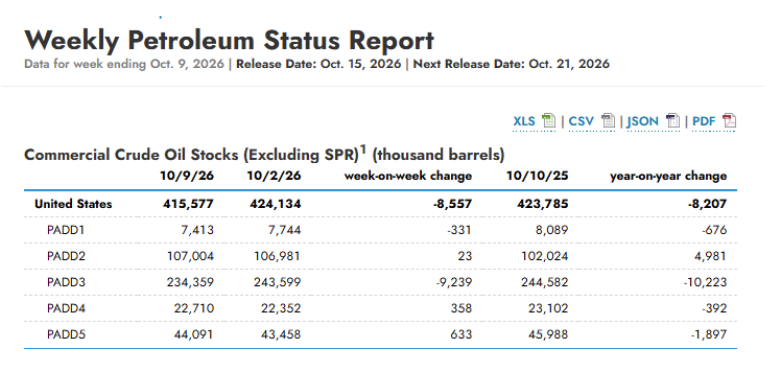
The EIA reported a drop of 8.6 million barrels in U.S. commercial crude oil inventories, to 415.6 million barrels, for the week ending October 9. Distillate inventories drew down by 2.5 million barrels. Refiners operated at 93.5% of capacity.
Washington continues looking for ways to boost crude oil exports and reduce freight costs. According to Reuters, the Trump administration is looking to ease sanctions on tankers to allow them to carry oil that is not under sanctions, which they say should lower record high shipping costs. Industry sources say this is not likely to lower costs, as most insurers are still legally obliged to abide by the sanctions in the EU and UK.
Brent: Gulf Routes Remain Fragile
The fundamentals remain weighted to the upside for oil. If the Brent price continues to stay above $100, and the U.S. crude inventory falls significantly, we could see a WTI price spike to $100 in the short term. However, in the intermediate term, we could retest $92.53. Only time will tell.
US Central Command reported Thursday an Iranian projectile struck the container ship that later sank in the Strait of Hormuz. Houthi attacks continue to strain Saudi Arabia’s Red Sea bypass. Tensions remain high in the region.
Natural Gas Price Forecast
Every new Natural Gas analysis as it publishes, today's technical signal and key levels, live price — on one page.
See all Natural Gas forecastsOn the supply side, the IEA announced accelerated releases from its March stockpile agreement, including over 20mn barrels of diesel. Some 330mn barrels of oil have already been released.
Natural Gas: Lean Injection Ahead of Winter
On October 15, the EIA reported a 67bcf storage build for the week ending October 9. This was below the expected 76bcf and the 5-year average of 90bcf. This week, natural gas production dropped to its lowest level in 5 months.
US natural gas inventories are at 3,567bn cubic feet, which is about 4% less than the same time last year. So far this month, average LNG feedgas has been 17.6bcfd. With a key pipeline outage, this could further limit natural gas storage builds.
Natural Gas Technical Analysis: NG Tests $3.19 as $3.16 Trendline Support Comes Into Focus
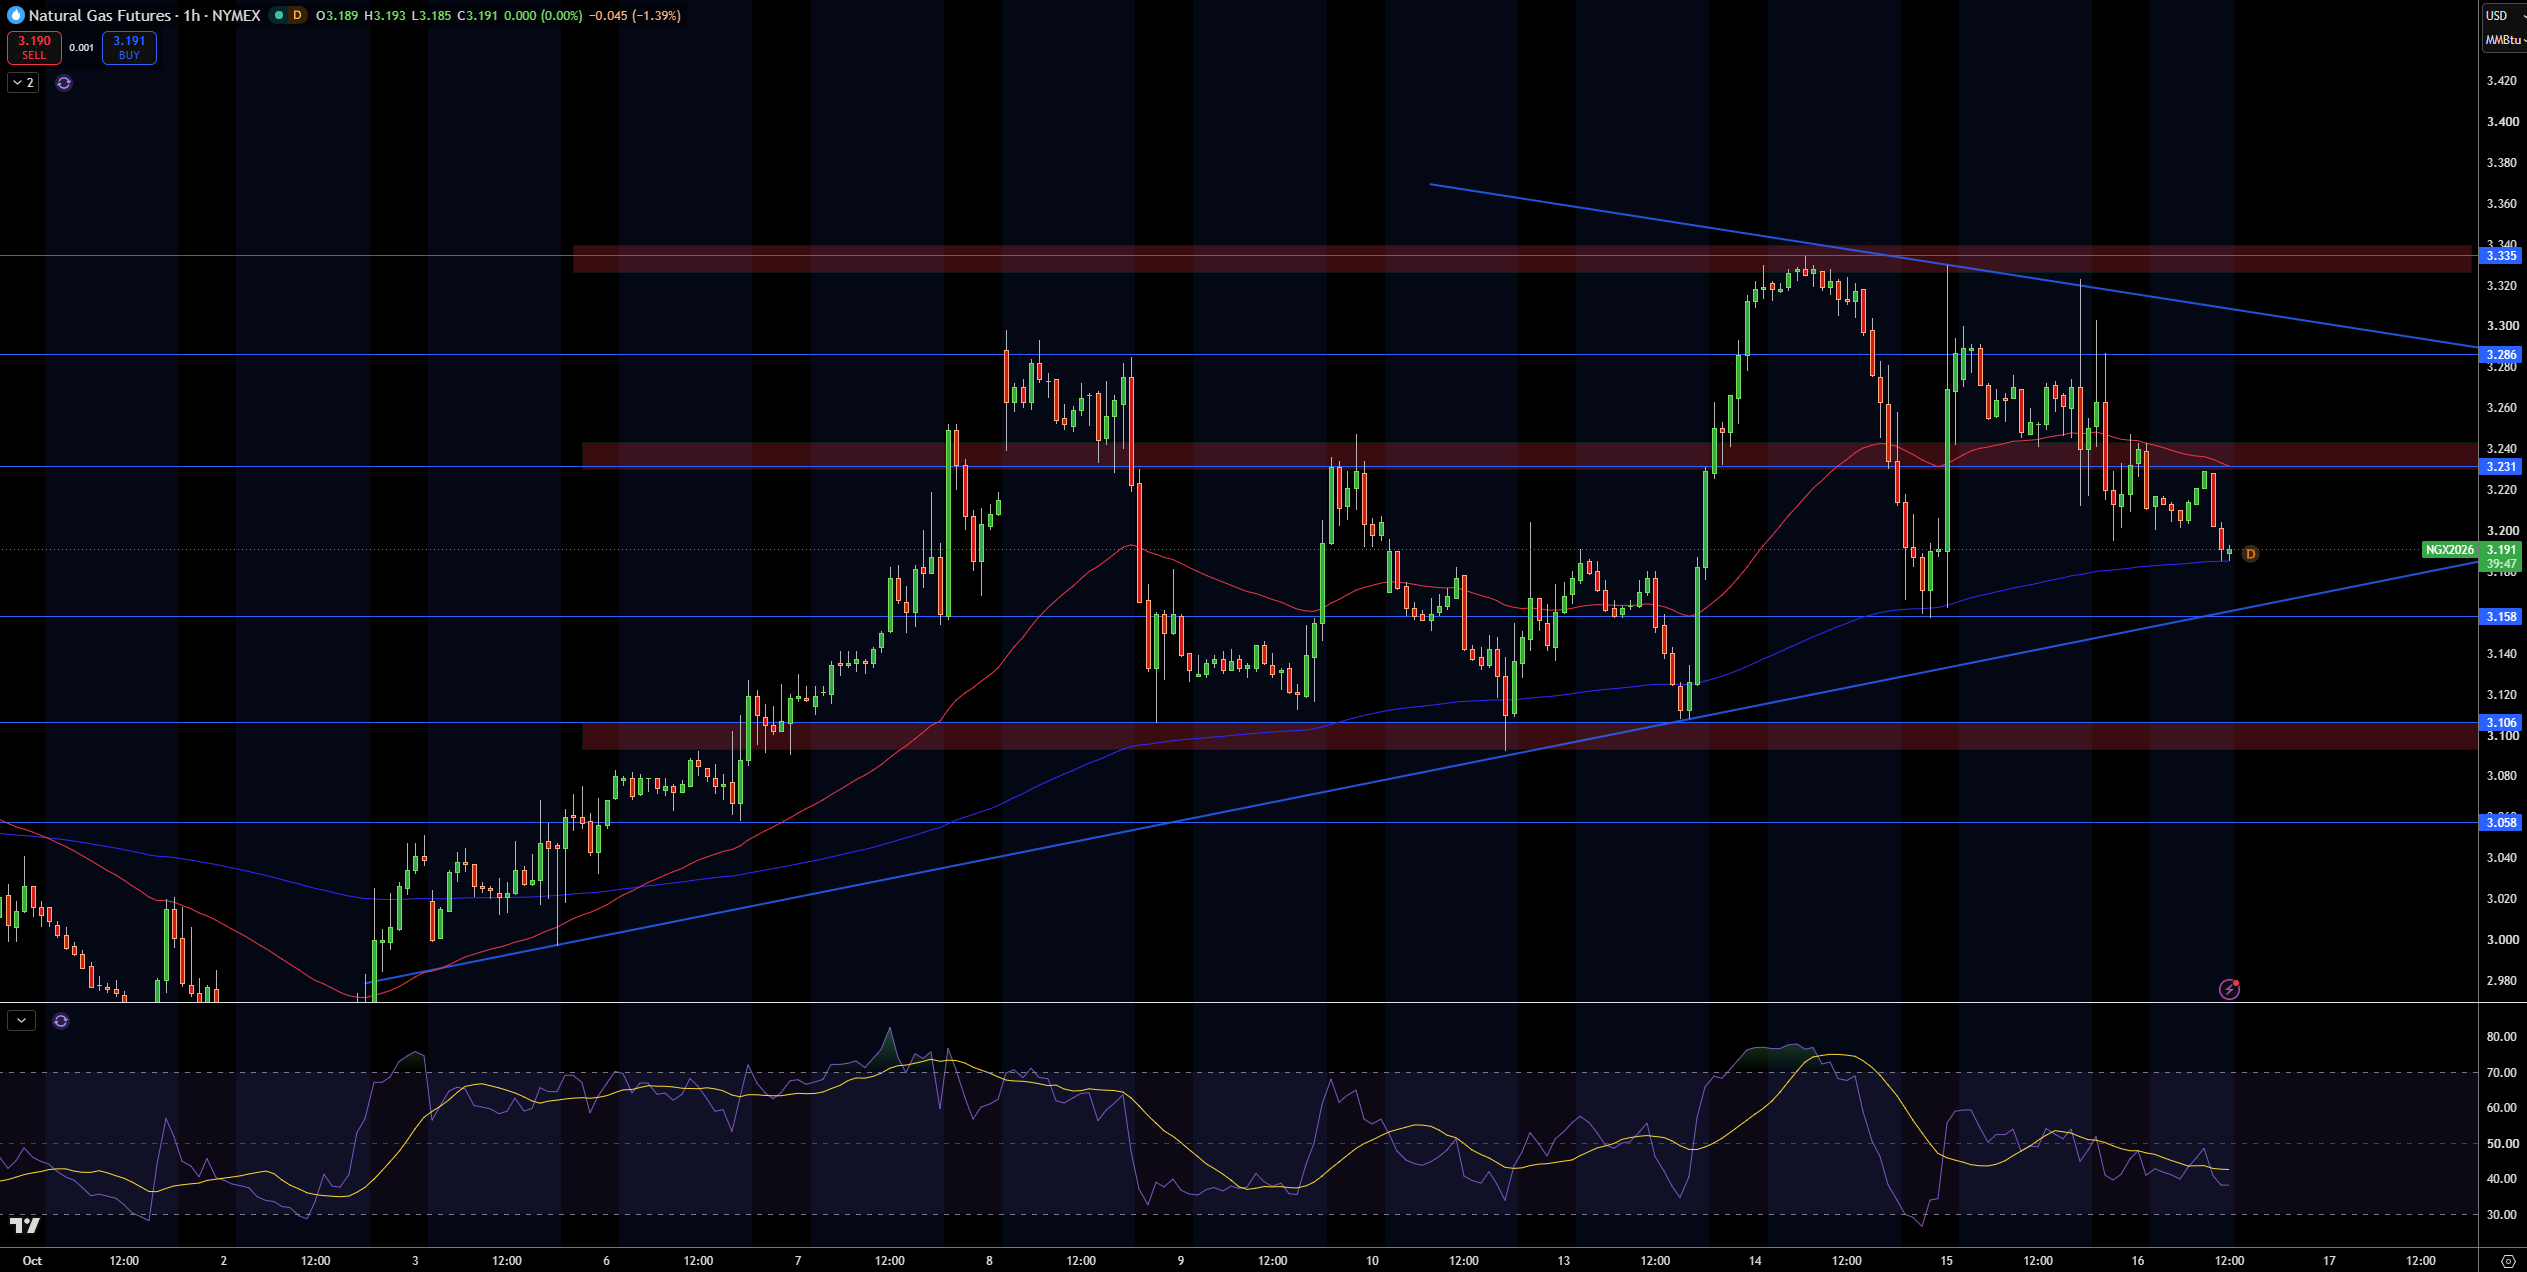
Natural gas is trading around $3.19/MMBtu on the 1-hour chart. Currently, a contracting triangle has formed from the high at $3.34. Sellers have capped each bounce from the descending trendline. Price has also breached the faster moving average at $3.23 and is currently testing the slower moving average at $3.19.
Support comes in at $3.16 and coincides with the rising trendline. Further support comes in at $3.11, and is followed by $3.06. For resistance, look at the faster moving average at $3.23 first, then at $3.29, with the $3.34 resistance zone sitting higher.
RSI sits near 38 and is below the signal line, which is currently at 43. Therefore, I am neutral with a slight bearish lean. I keep that bearish lean until natural gas trades above $3.23. A break above $3.29 changes the bias to bullish. A breach of the lower trendline, at $3.16, would also change the bias to bearish.
WTI Technical Analysis: USOIL Holds $95.19 as $98.23 Remains the Key Breakout Test
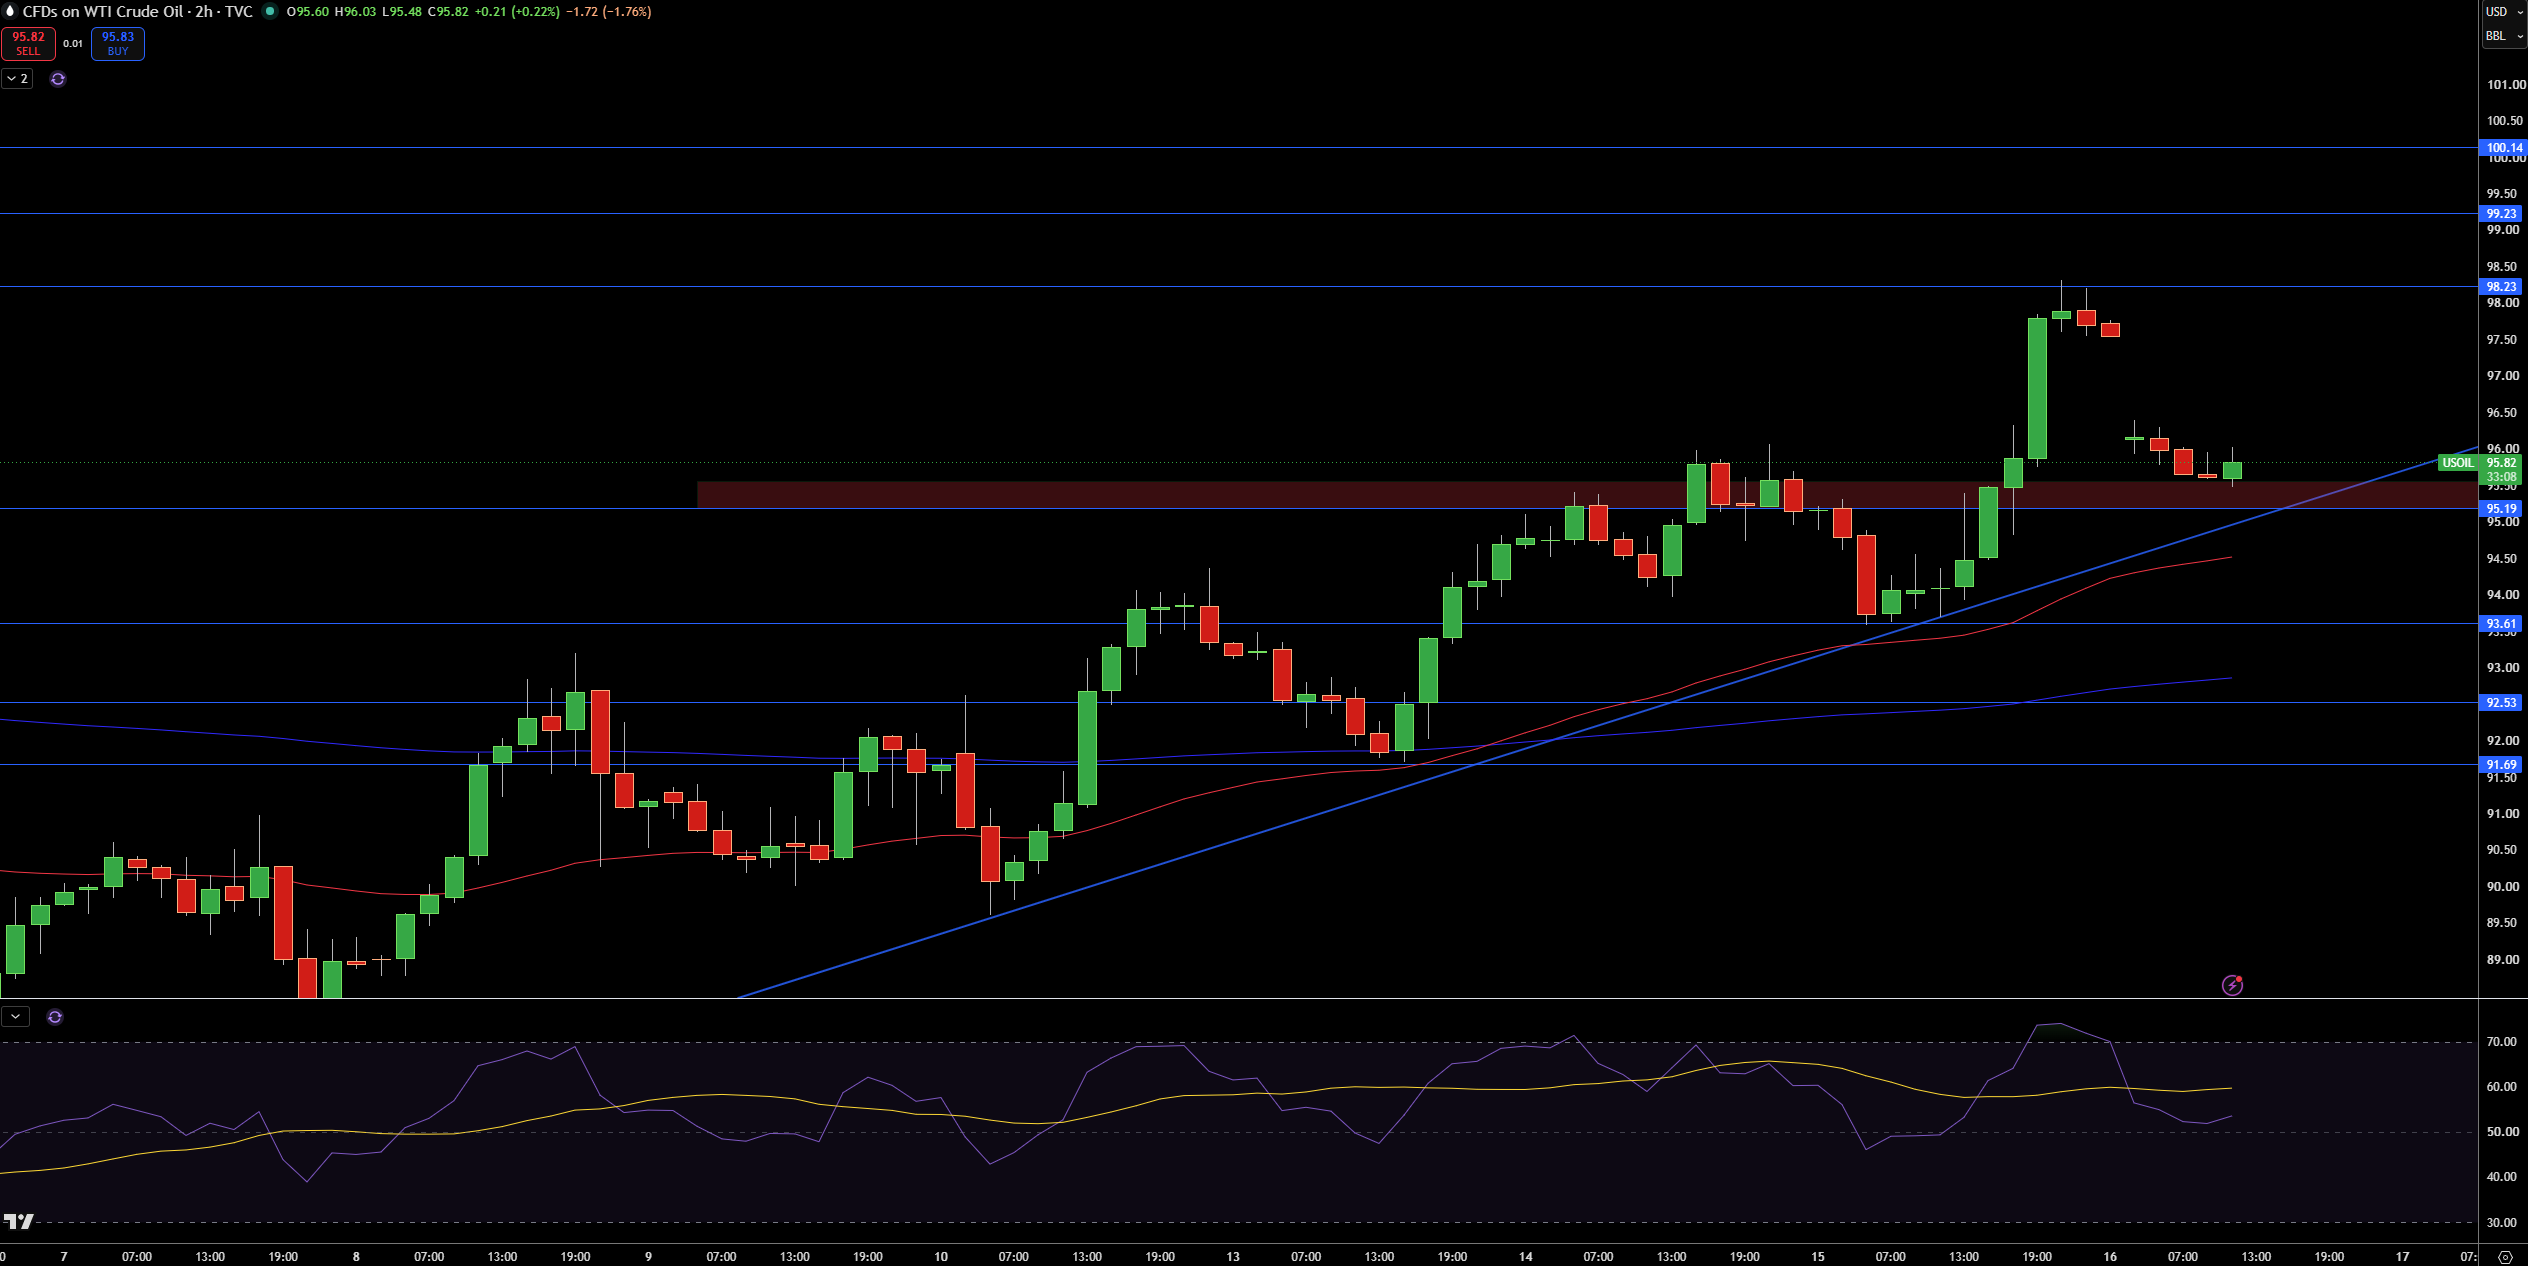
On the 2-hour WTI crude chart, price is trading at about $95.82. Most recently, the price action has stalled at the $95.19 support area. Price did spike up to about $98.23, but was capped by sellers in that area. The longer-term trend is still rising. Price has been above both the 50 and 200 SMA for a while now.
Price does have resistance above at the $98.23 level. A clear break above there would have price targeting the $99.23 level. The $100.14 area would be the next target. Support is closer at the $95.19 area. Below that, price would find support at the 50 SMA, currently around $94.50. The 200 SMA is around the $93.61 level. Price below that would be targeting the $92.53 area.
RSI is currently around 53, and below its signal line. This indicates that the last pullback wasn’t a bearish signal, but rather just a pullback after the recent overbought condition. I am bullish for the time being as long as WTI is above $95.19 and the rising trendline. Breaking above $98.23 would be bullish. Breaking below $93.61 would negate the recent higher lows.
Brent Technical Analysis: UKOIL Holds $104.94 as $106.40 Comes Into Focus
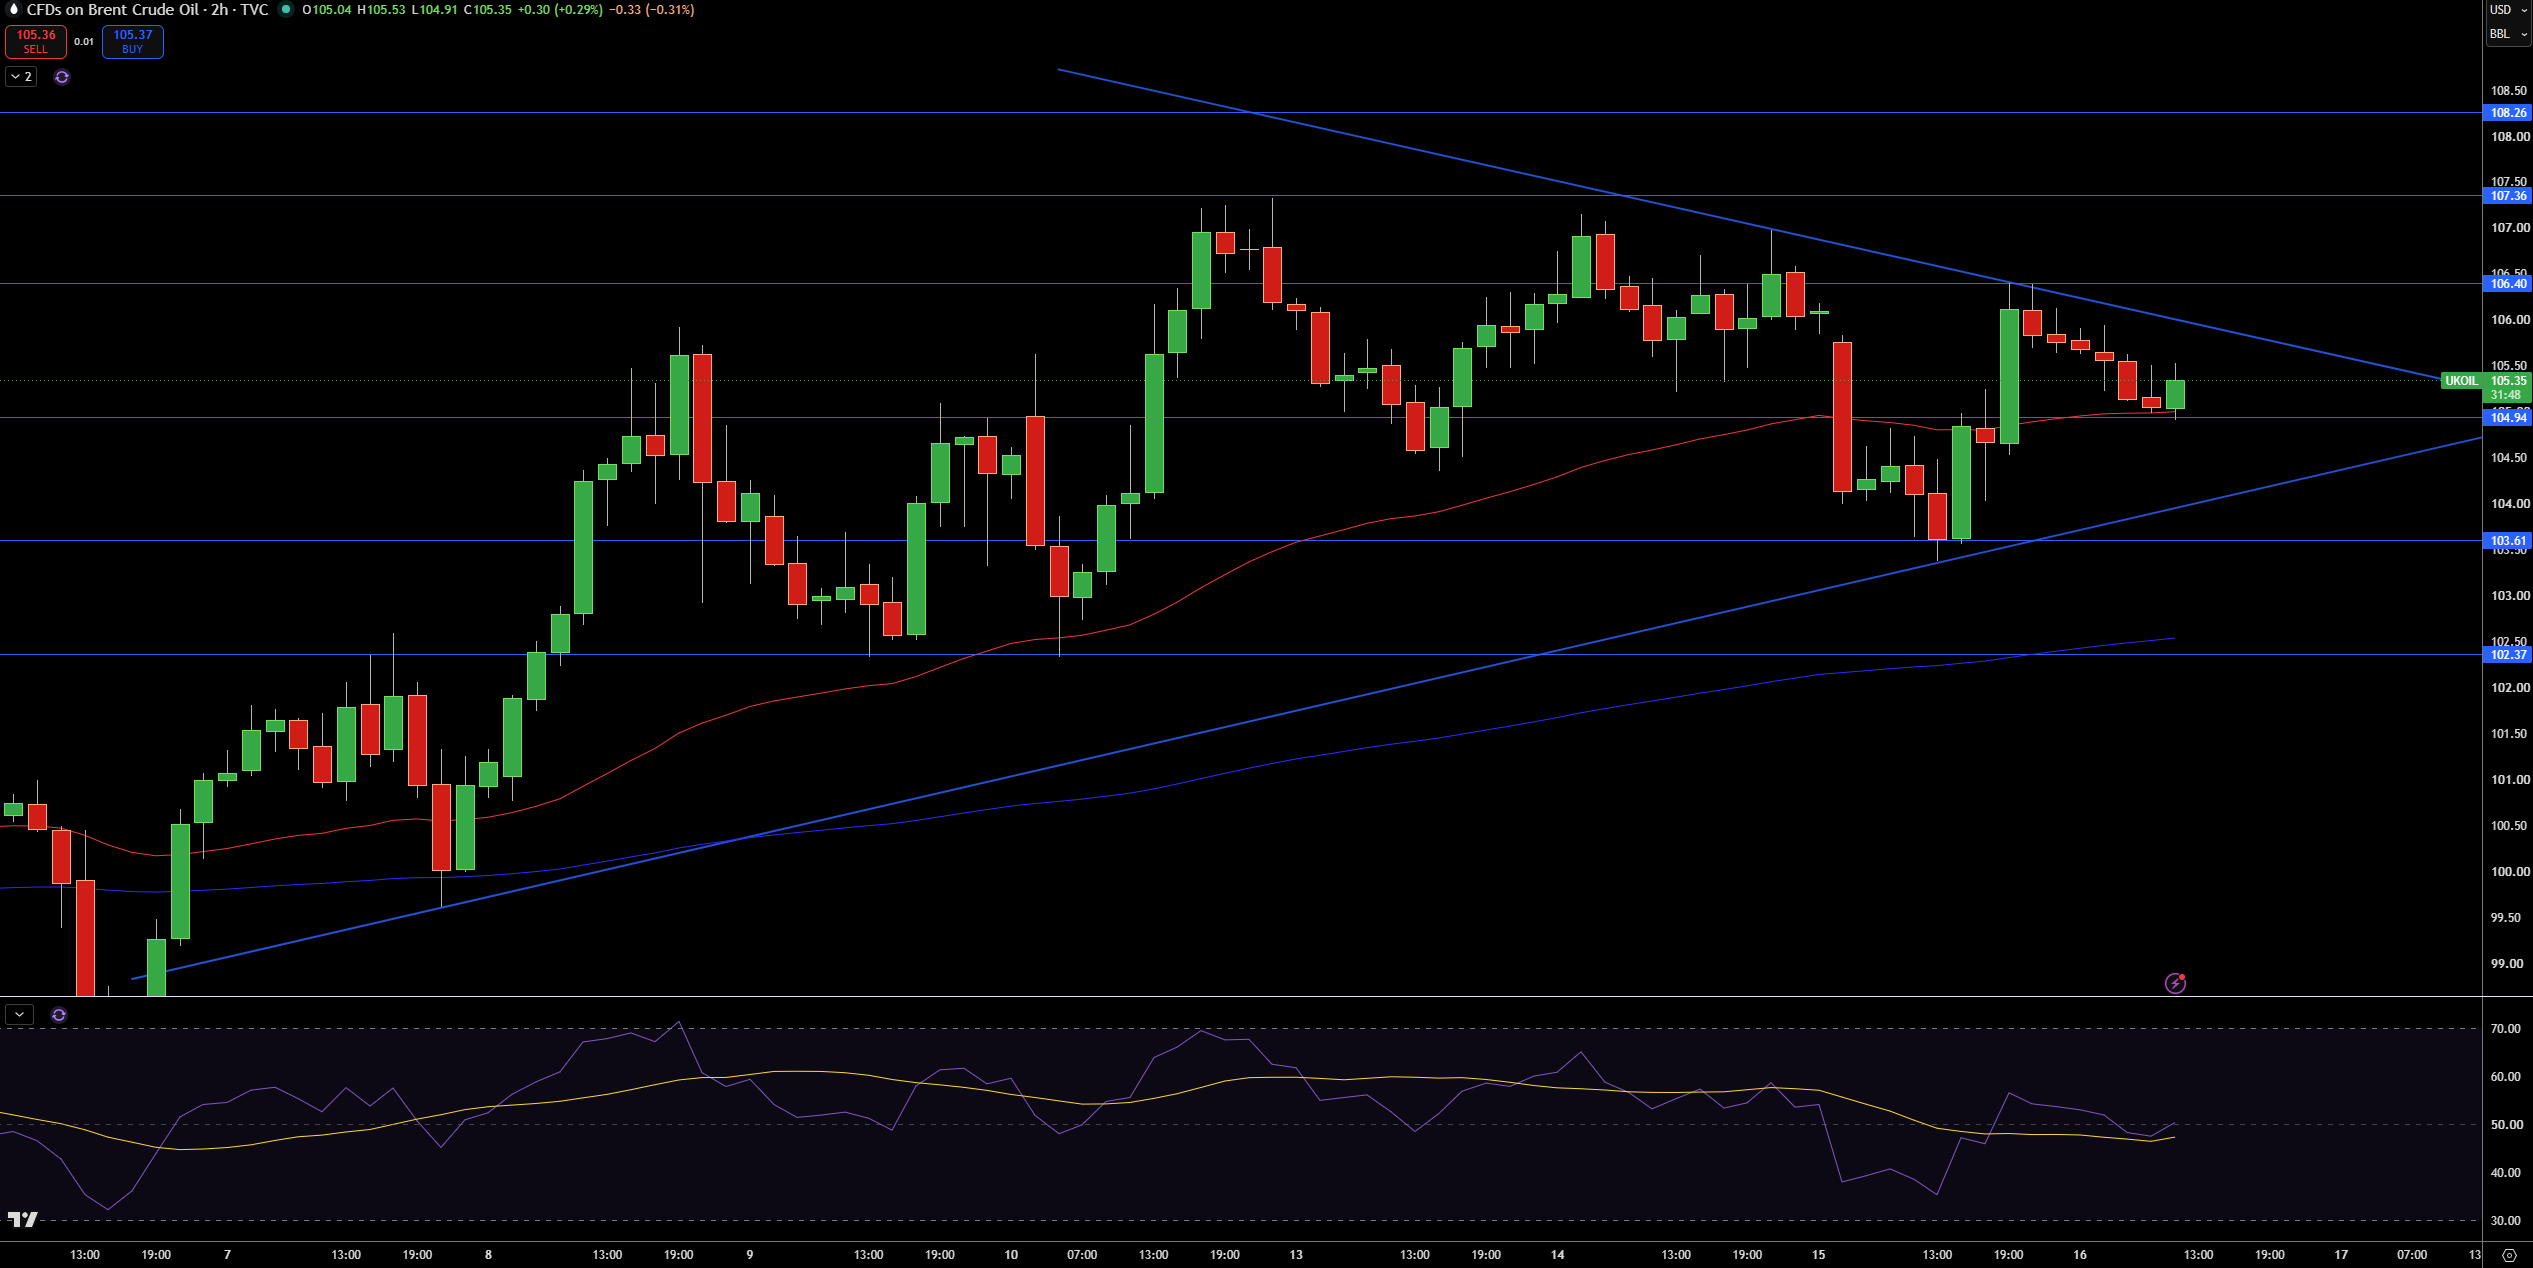
Brent is currently trading at $105.35. Something that stood out to me is the symmetrical triangle forming since the high at $107.36. Price continues to create lower highs with the most recent being formed at $106.83. Support continues to be found at higher and higher lows. Brent currently trades at the faster moving average at $104.94.
The first area of resistance is the upper trendline, coming in at $106.40. A break above here targets the $107.36 level and $108.26. The lower trendline of the triangle comes in at $104.94. Further support is found at the $103.61 swing low. A break below here targets $102.37. This would also cross below the 200 slower moving average.
RSI is currently at 50 and has crossed bullishly above its signal line. RSI is neutral and I’m also neutral with Brent being range bound within the triangle. A break above the $106.40 area would target the $108.26. A break below the $103.61 would target the $102.37.


