Warsh Takes October Out of the Immediate Trade
Gold is working higher early Friday, but the move has more to do with the dollar than a change in the inflation story. Federal Reserve Chair Kevin Warsh declined to signal an October rate increase overnight, taking some of the immediate rate pressure out of the market.
That was enough to weaken the dollar and keep buyers interested after Thursday’s rebound. It was not a clean bullish turn for gold. The CPI and PPI reports are still hot, and traders are still looking toward December for the next Fed decision.
Warsh said broader economic conditions were in line with expectations set at the Fed’s September rate increase. He acknowledged persistent price pressure and higher global prices, but he did not give traders a signal on the October 28 meeting.
That changed the short-term rate trade. The probability of an October increase fell from around 27% to roughly 15% after his remarks. The U.S. dollar slipped against a basket of major currencies, while S&P 500 futures moved higher.
Gold got a lift from that shift because a weaker dollar makes bullion cheaper for overseas buyers. But Warsh did not remove the Fed from the trade. He only refused to make October the decision.
At 05:54 GMT, Spot Gold is trading $4,173.76, up $3.06 or +0.07%. December Comex Gold is trading $4,194.40, up $24.30 or +0.58%.

Daily Spot Gold (XAUUSD) Technical Analysis
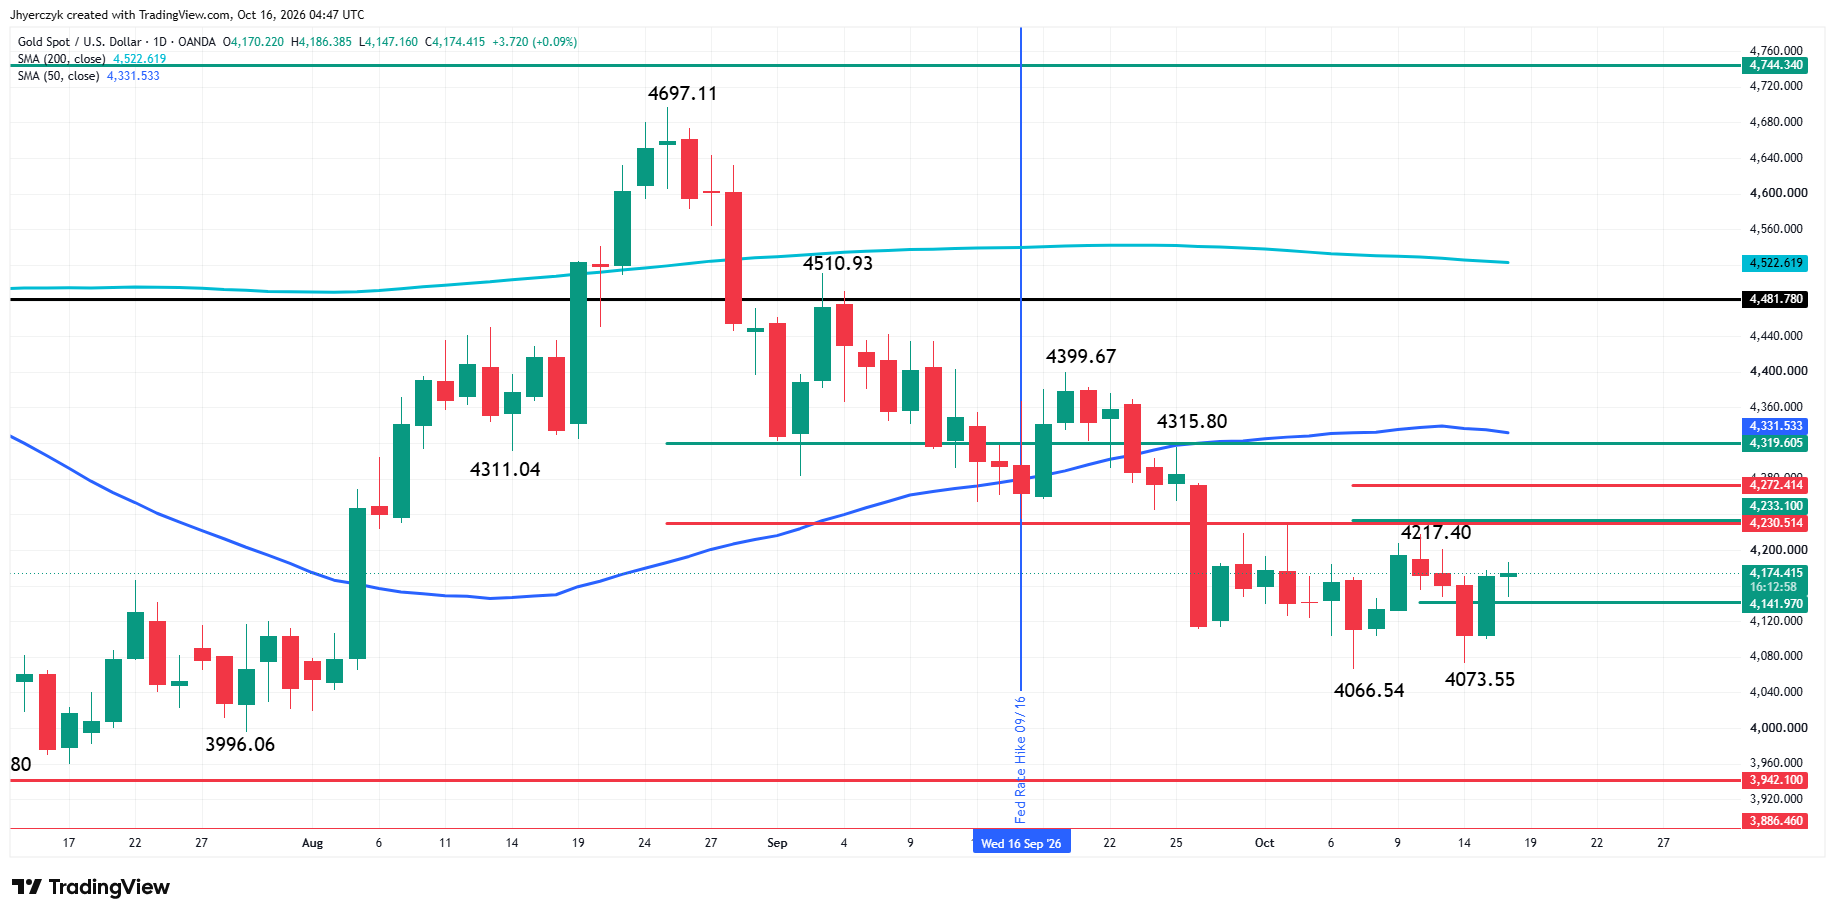
Spot Gold is trading higher early Friday as traders attempt to build on yesterday’s 1.61% gain. The main trend is down according to the daily swing chart, but the formation of a secondary higher bottom at $4073.55 to go along with the October 7 main bottom at $4066.54, suggests the trend may be getting ready to turn up.
A trade through $4217.40 will change the main trend to up. A move through $4073.55 will reaffirm the downtrend and likely lead to a test of $4066.54.
The minor range is $4066.54 to $4217.40. The market is trading on the strong side of its pivot at $4141.97, making it potential support.
A change in trend to up may not lead to a breakout because of a 61.8% resistance at $4230.51 and a short-term retracement zone at $4233.10 to $4272.41. The latter is a potential trigger point for an acceleration to the upside with a short-term 50% level at $4319.60, forming a potential resistance cluster with the 50-day moving average at $4331.55.
Gold Price Forecast
Every new Gold analysis as it publishes, today's technical signal and key levels, live price — on one page.
See all Gold forecastsDaily December Comex Gold Futures Technical Analysis
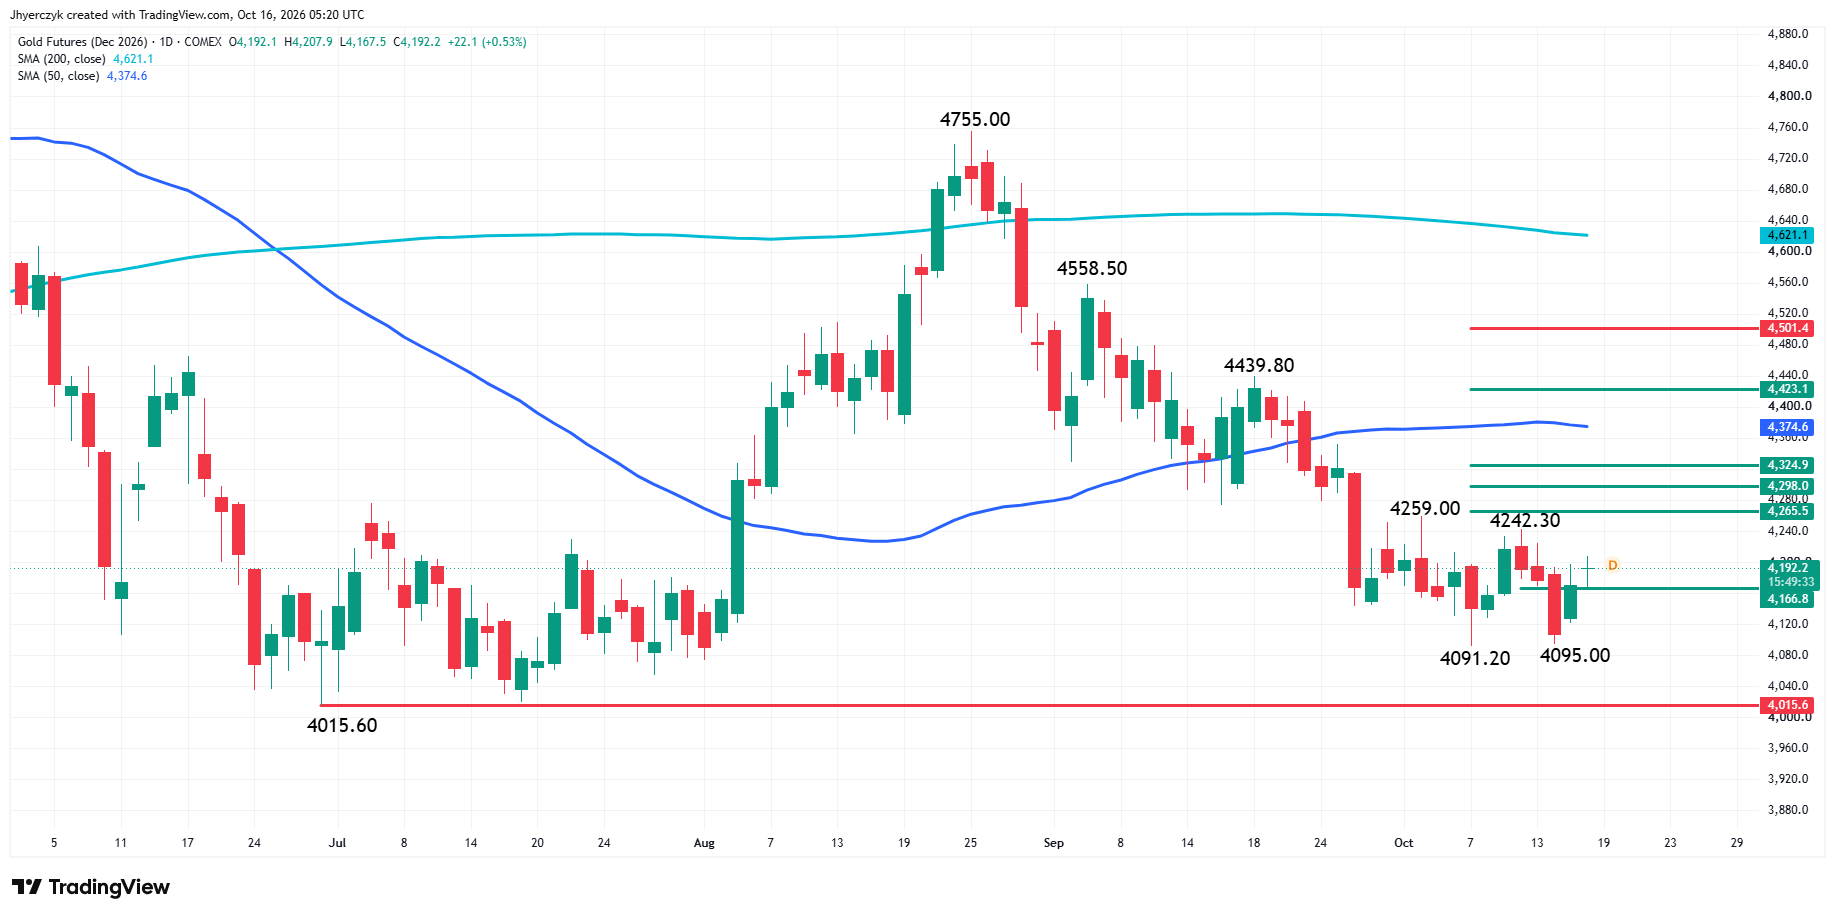
December Comex Gold futures are edging higher early Friday. The main trend is down according to the daily swing chart. A trade through the swing top at $4242.30 will change the main trend to up. A move through $4095.00 will signal a resumption of the downtrend.
The minor range is $4091.20 to $4242.30. Its 50% level at $4166.80 is potential support.
After that, traders face a labored rally with 50% retracement resistance levels stacked at $4265.50, $4298.00 and $4324.90. Overcoming these levels will put the 50-day moving average on the radar as a major upside target.
December Is Still the Harder Problem
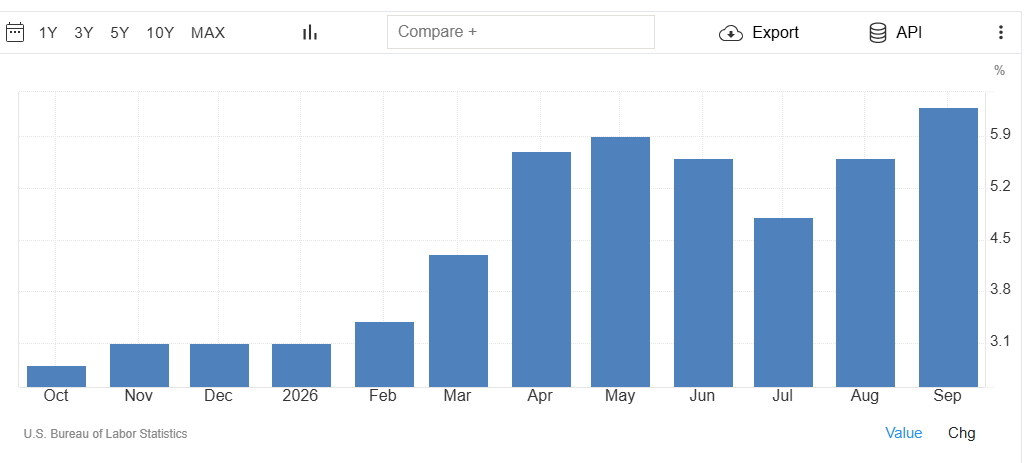
The inflation numbers remain a problem for gold buyers. September producer prices rose by the most in four-and-a-half years as goods and services costs pushed higher. That followed Wednesday’s CPI report, which showed prices accelerating on higher gasoline costs.
The market had already started to pull back from an October hike after comments from San Francisco Fed President Mary Daly and Vice Chair for Supervision Michelle Bowman. Both said an immediate move was not necessarily required.
December is different. Traders are pricing in an 89% chance of a rate increase at that meeting. Chicago Fed President Austan Goolsbee called the inflation data discouraging. Cleveland Fed President Beth Hammack said the Fed could need to move more aggressively if inflation expectations deteriorate.
Gold can hold a bid while the dollar backs away from an October hike. The metal still has to contend with the possibility that the delay simply pushes the rate decision into December.
Dollar Relief Meets India ETF Restrictions
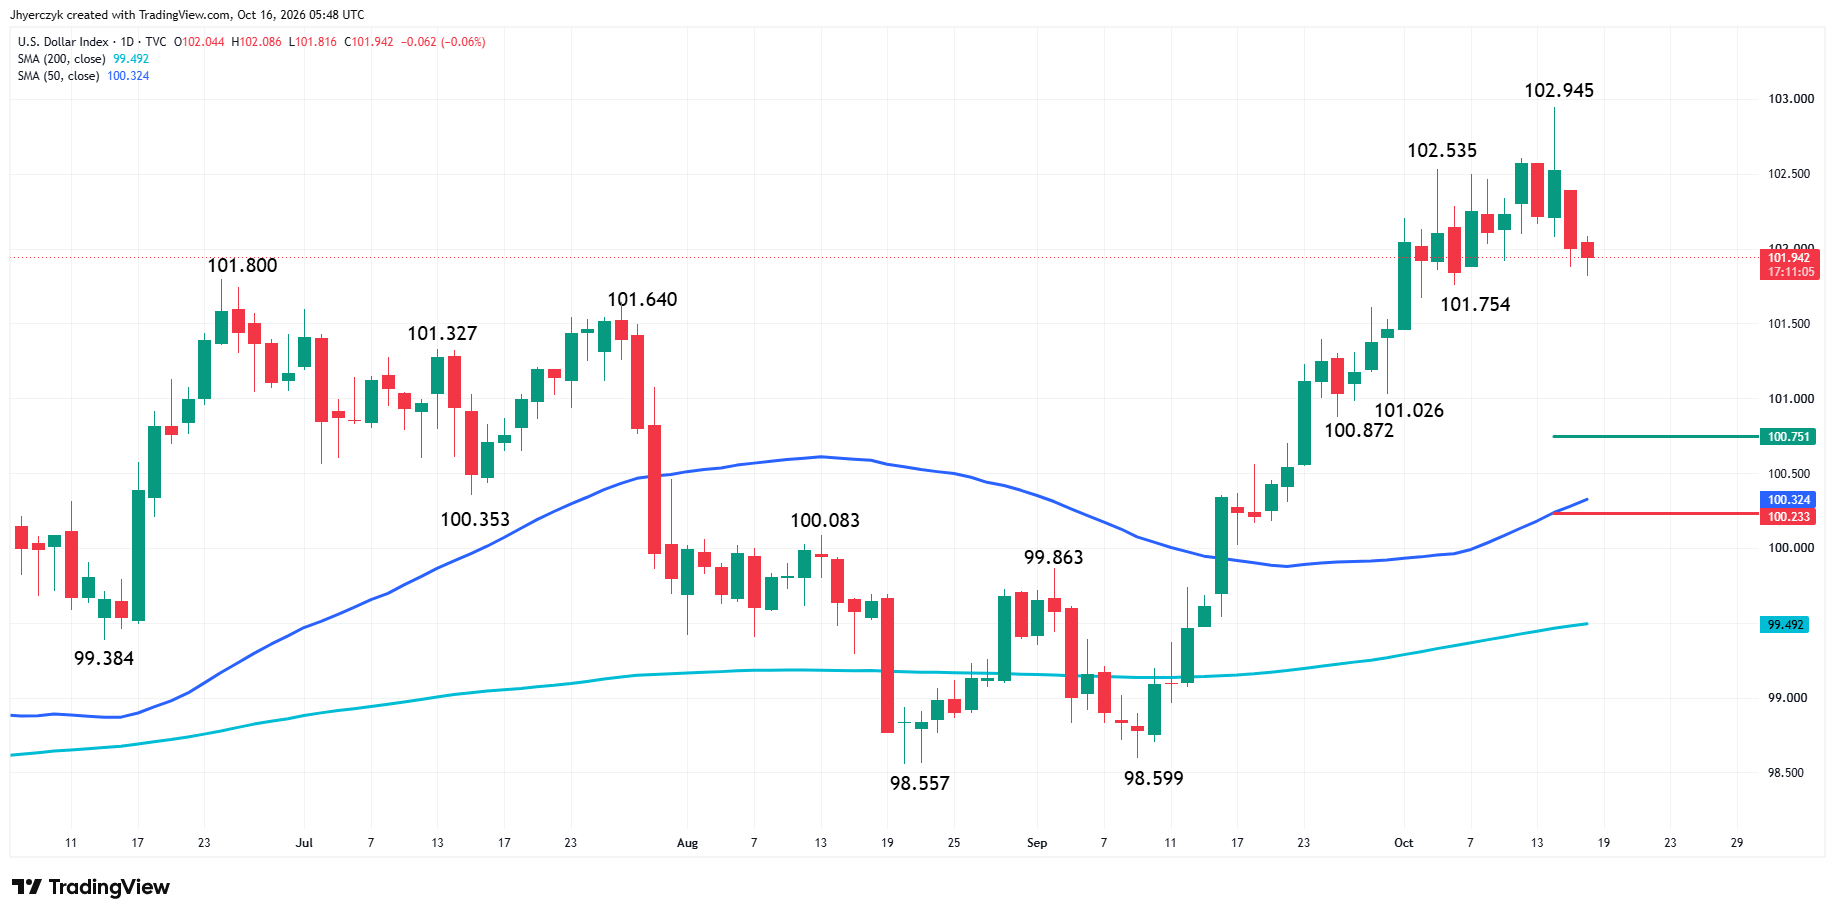
Thursday gave gold its first strong session after three days of losses. The dollar fell 0.5%, and the benchmark 10-year Treasury yield dropped to a three-week low as traders moved into bonds.
Several large Indian mutual funds suspended bulk subscriptions to gold exchange-traded funds late Thursday, just ahead of the festive season. The move does not change the dollar or Fed trade, but it removes one source of demand from the market at a time when buyers would normally be active.
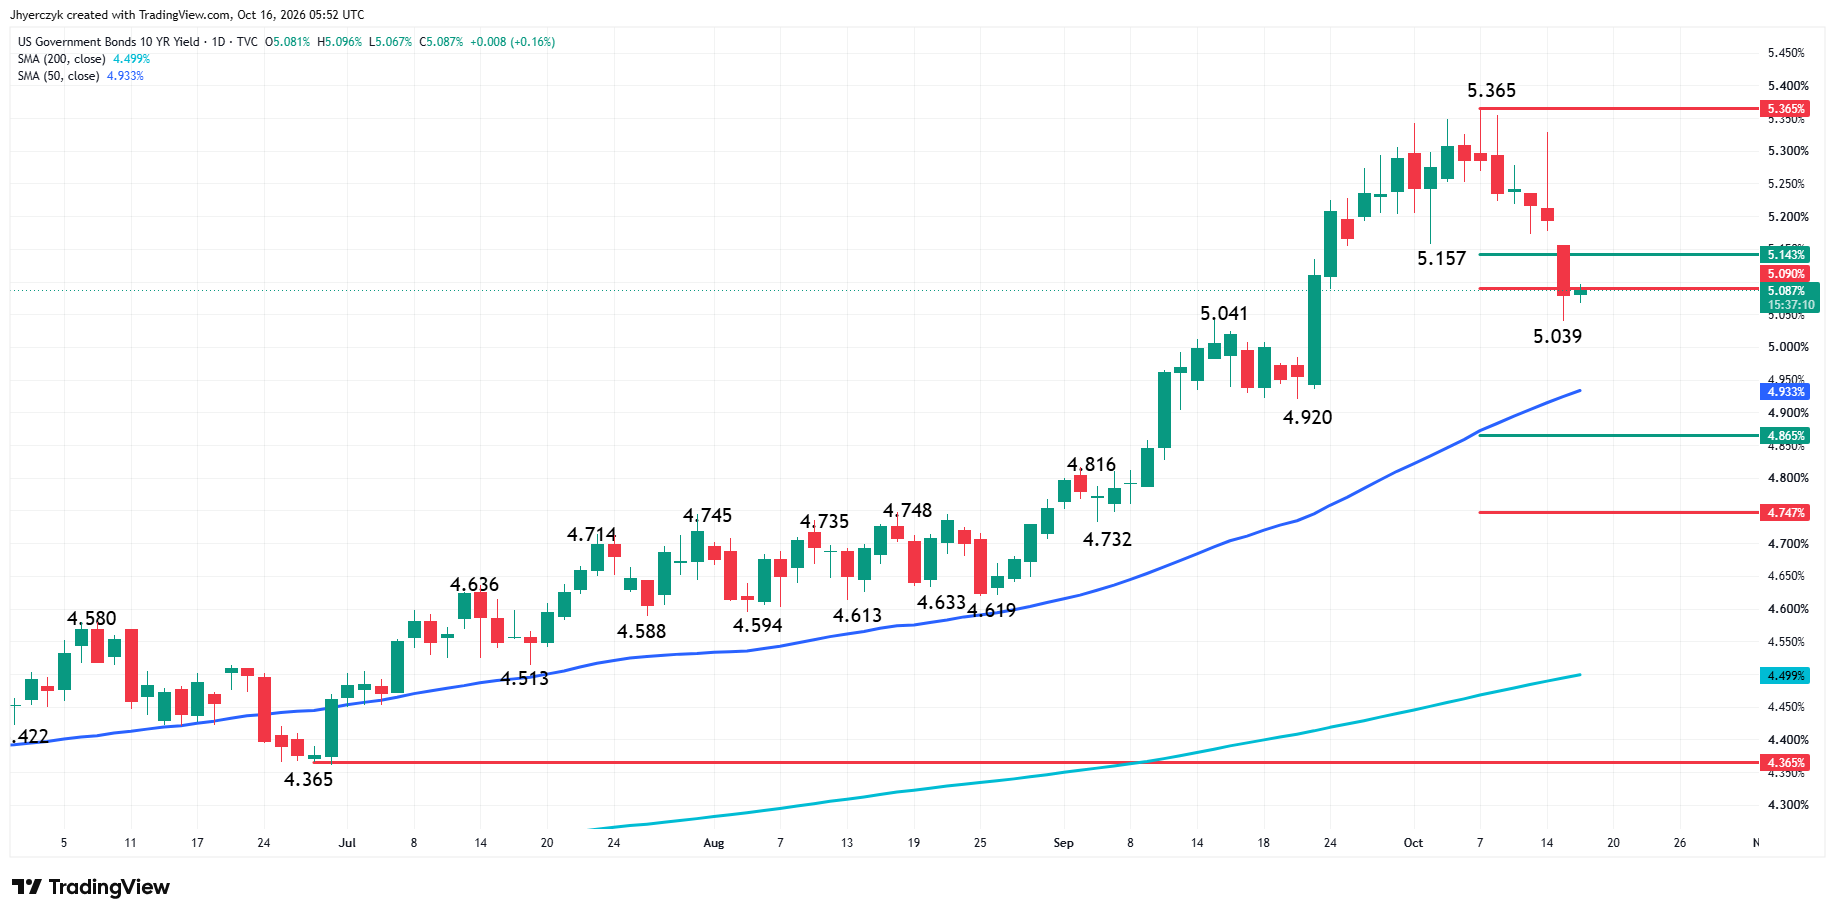
Gold has support from the weaker dollar and lower yields. It also has hotter inflation, a high probability of a December rate hike and a fresh restriction on ETF buying in a major market.
What to Watch
Warsh took the October hike out of the immediate trade, and gold is holding Thursday’s recovery as the dollar backs off. The hotter CPI and PPI reports remain the larger problem. Spot Gold is trading above $4141.97, with $4217.40 still standing between the market and a change in the main trend. The secondary higher bottom at $4073.55 is where the recovery starts to come apart.
Although the main trend is down and the market is trading on the bearish side of the 50-day moving average at $4374.60, my downside bias is weakening with the breakout over $4166.80. If this move creates enough upside momentum, traders could try to take out the main top at $4242.30 and turn the main trend to up. The formation of the secondary higher bottom at $4095.00 suggests the passive bidding may be over. Traders are now going to have to start aggressively taking out offers to sustain the counter-trend momentum.
If you’d like to know more about how to trade gold, please visit our educational area.