Gold (XAU) trades near $4,155 an ounce in early Asian trading on Friday, while silver (XAG) consolidates around $57.20 after the rebound on Thursday. The correction in the US dollar and US Treasury yields supported both metals to recover despite hot US inflation data.
The concerns about debt at artificial intelligence companies drove investors towards government bonds. This pushed the 10-year Treasury yield towards 5.09%. The low yields make gold and silver more attractive. Silver gained over 3% on Thursday after a sharp drop of 5.98% on Wednesday after the CPI data release.
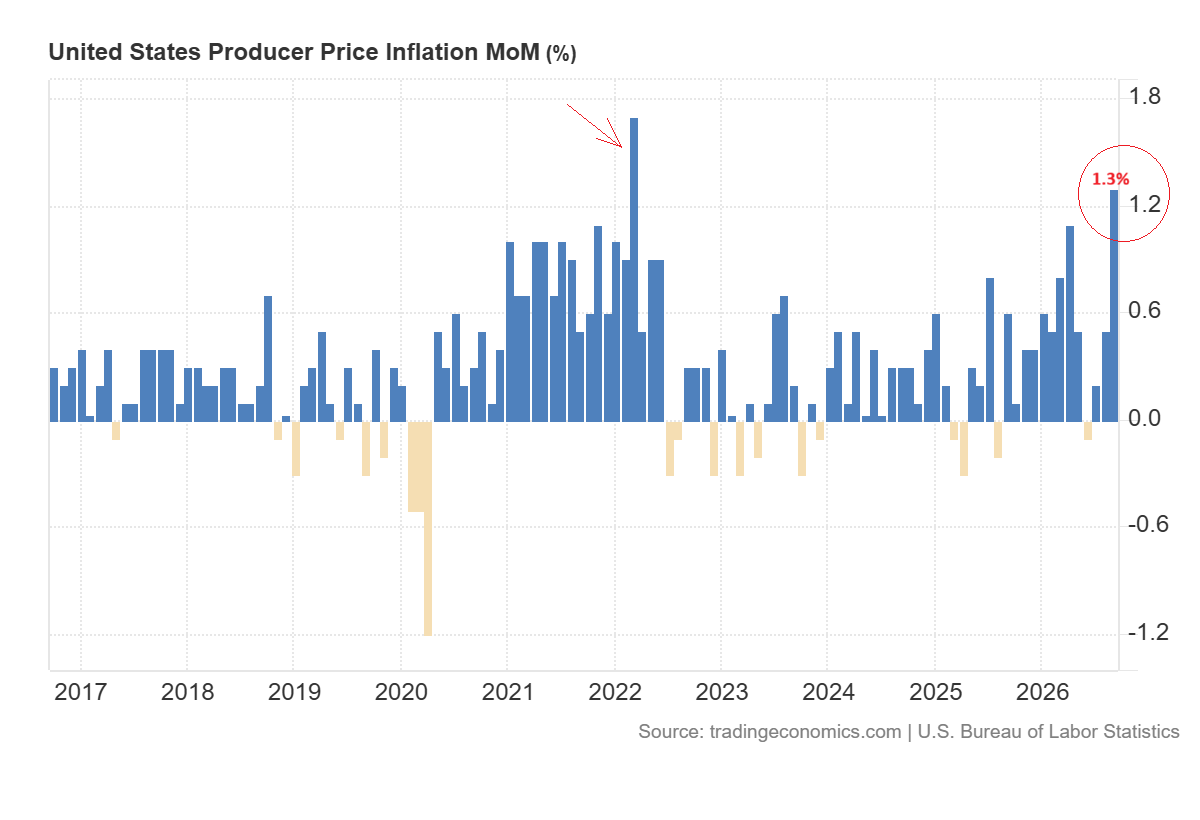
This recovery still faces pressure from persistent inflation. US producer prices jumped 1.3% in September. This is the biggest monthly increase since March 2022. The annual producer inflation reached 6.3% and keeps further rate hikes by the Fed in focus. The market is now waiting for comments from Fed Chair Kevin Warsh at the IMF meeting in Bangkok on Friday for clues about the next policy decision.
In my view, the rebound could extend if bond yields remain under pressure. But a firm warning from Warsh about inflation could lift expectations for rate hike and renew selling in both metals.

Gold Price Forecast: Rebound Faces $4,200–$4,250 Resistance
The daily chart for spot gold shows that the price has been consolidating in tight range between $4,220 and $4,100. This zone is highlighted in orange on the chart below. The price dropped after the US CPI data but recovered immediately towards $4,177 and now consolidates in a tight range.
These consolidations suggest that prices remain under pressure until the price clearly breaks above the $4,200 level. The 10-day moving average is now flat, which suggests neutral movement in the short term.
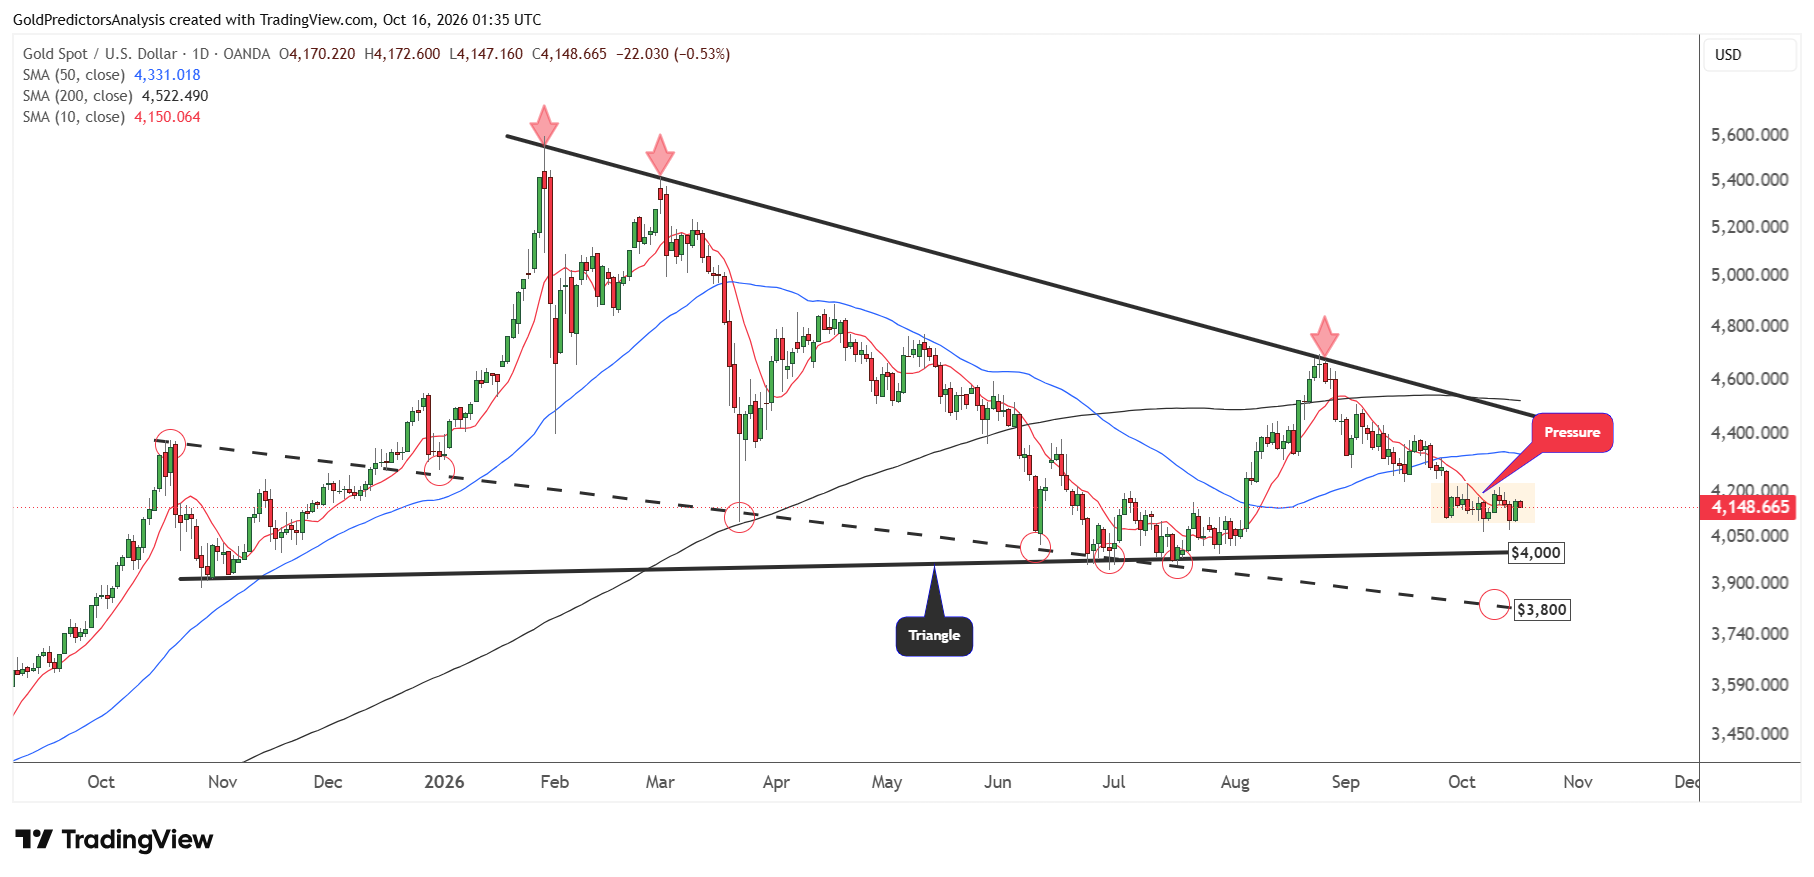
A clear break below $4,100 will push prices towards the major support at $4,000. However, a break below $4,000 will push the gold price towards $3,800, which is defined by the descending trend line that stretches from the October 2025 highs.
On the other hand, a break above $4,200 will open the way for a rally towards the 50-day SMA near $4,330 and the descending trend line near $4,450. A clear break above $4,500 will likely trigger a strong rally towards $5,000.
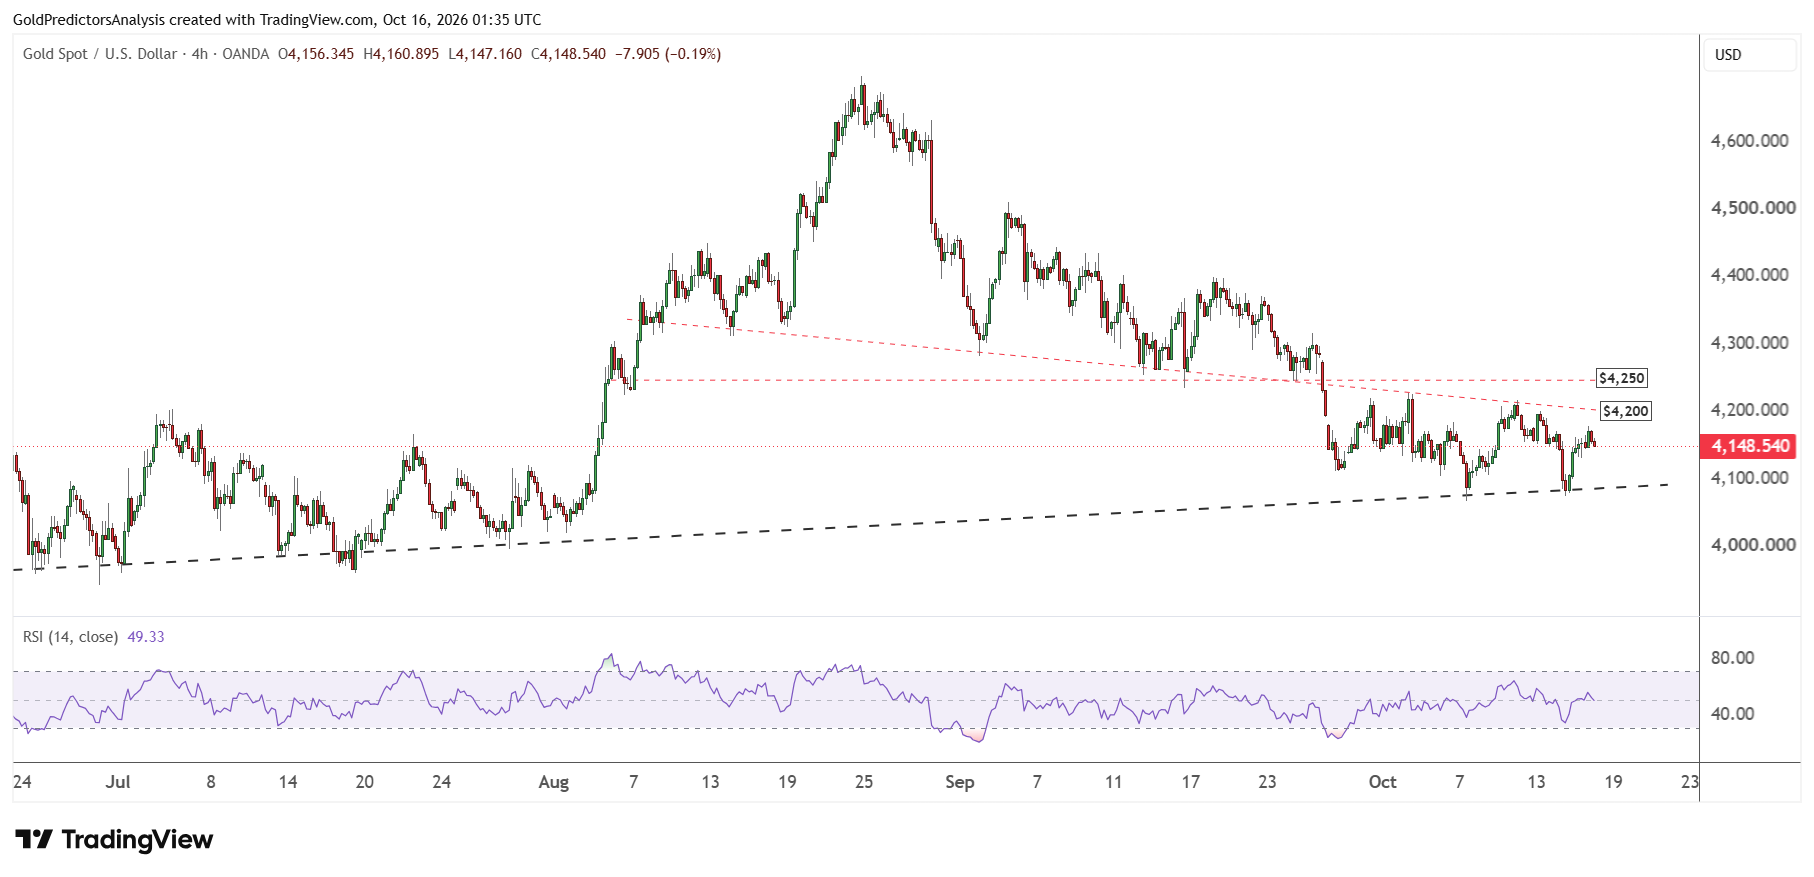
The 4-hour chart for spot gold also shows that prices have produced a rebound from the support of the ascending trend line that stretches from the June 2026 low. The 4-hour chart also shows $4,200-$4,250 as the immediate resistance. A break below the ascending trend line near $4,080 will likely push prices towards the $3,900-$4,000 area.
Gold Price Forecast
Every new Gold analysis as it publishes, today's technical signal and key levels, live price — on one page.
See all Gold forecastsSilver Price Forecast: Break Below $55 Could Expose $50
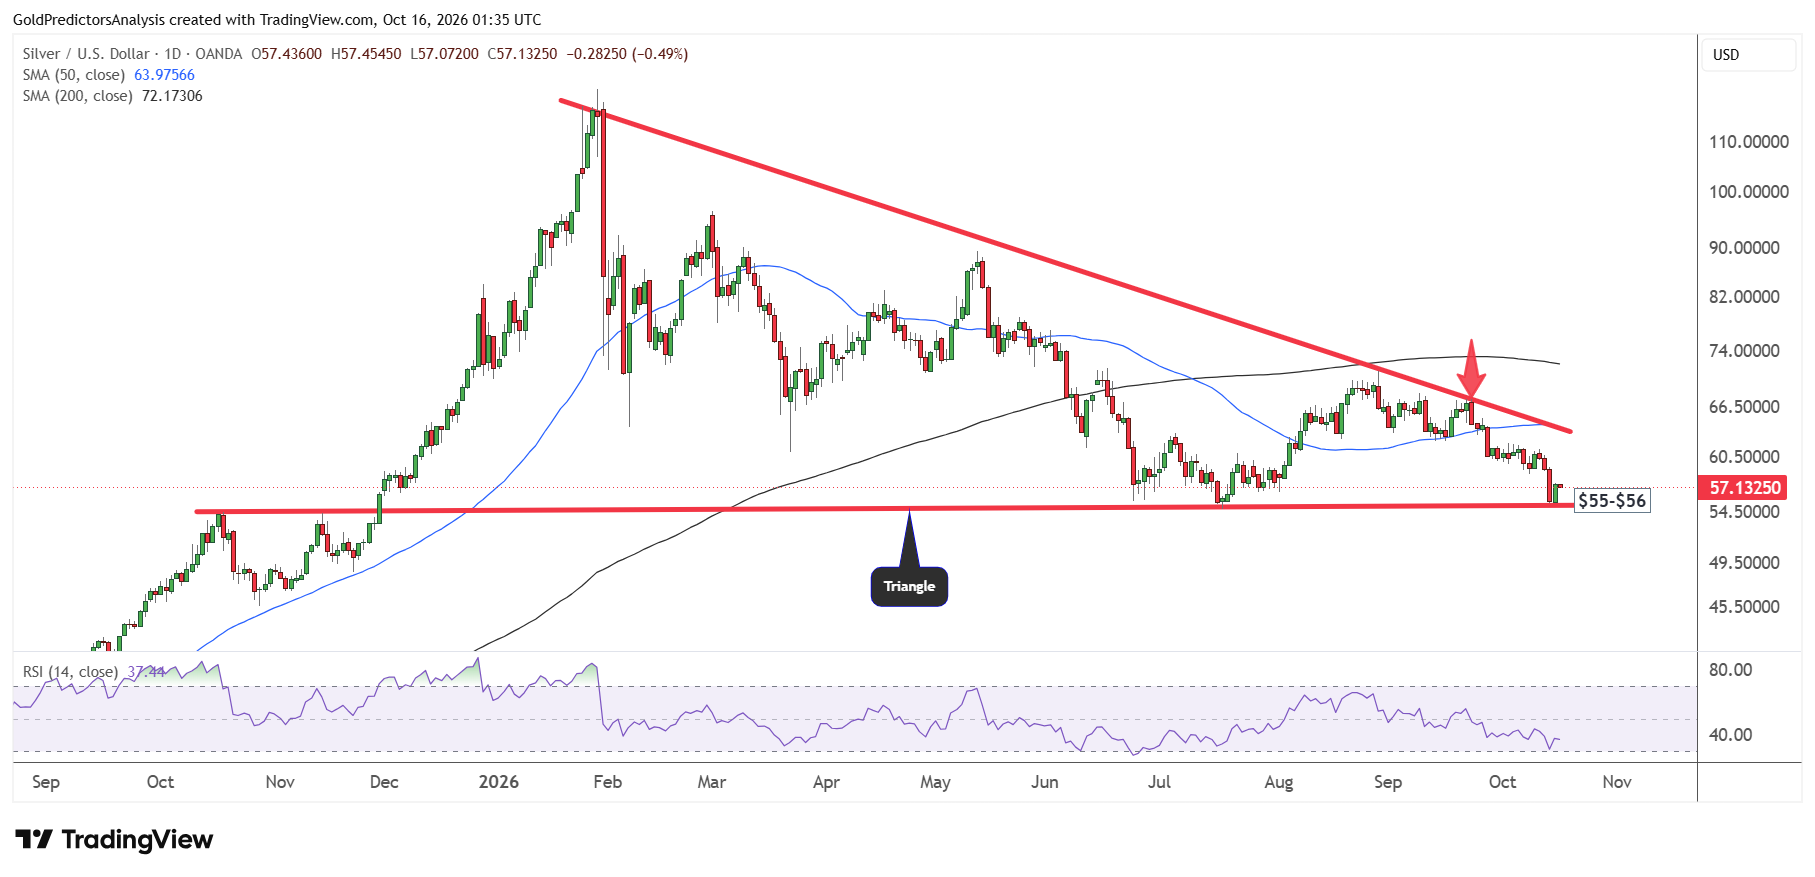
The daily chart for spot silver also shows that prices remain under pressure despite the slight rebound from the strong support of the triangle at $55 on Thursday. The price has challenged the most important support in the short term and looks to find the next move.
A break below $55 will likely trigger another drop towards the $50 region. On the other hand, a break above $64 will likely break the triangle and open the way for a rally towards the $72 area, which is defined by the 200-day SMA.
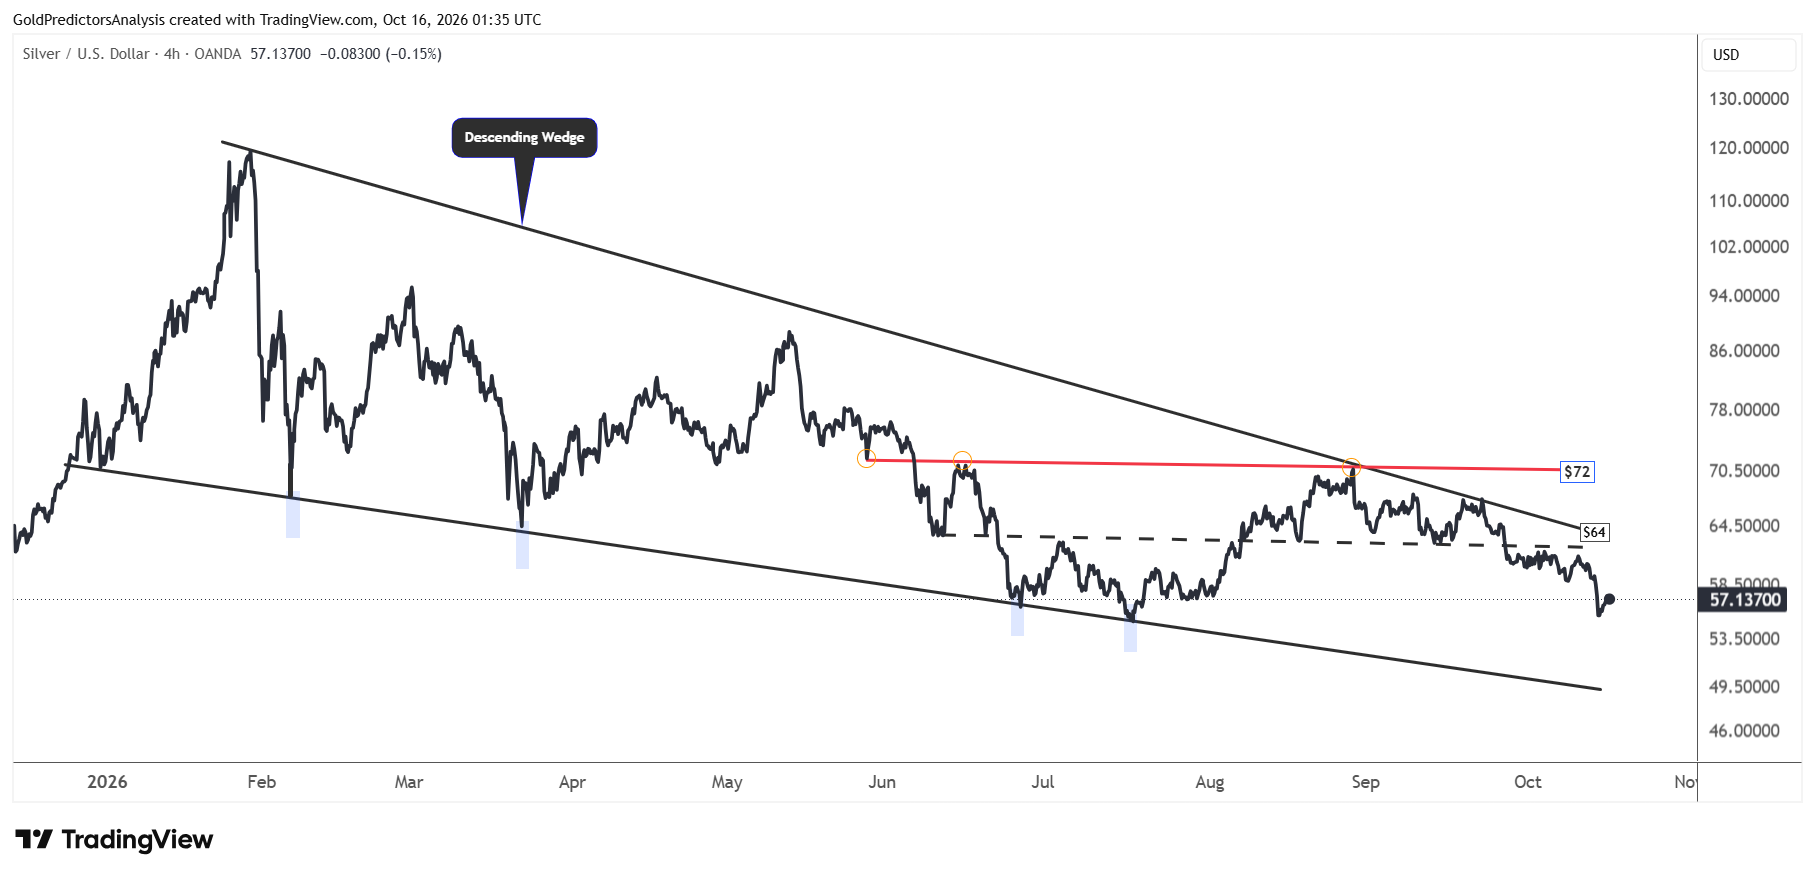
The 4-hour chart for spot silver also shows that the price dropped from the key resistance at $64. The price needs to break above the $72 area to open the way for a further rally towards the $90 region. The major support in silver remains between $45 and $50, which is defined by the support of the wedge pattern.
Gold-to-Silver Ratio Rises Above 73 as Silver Lags
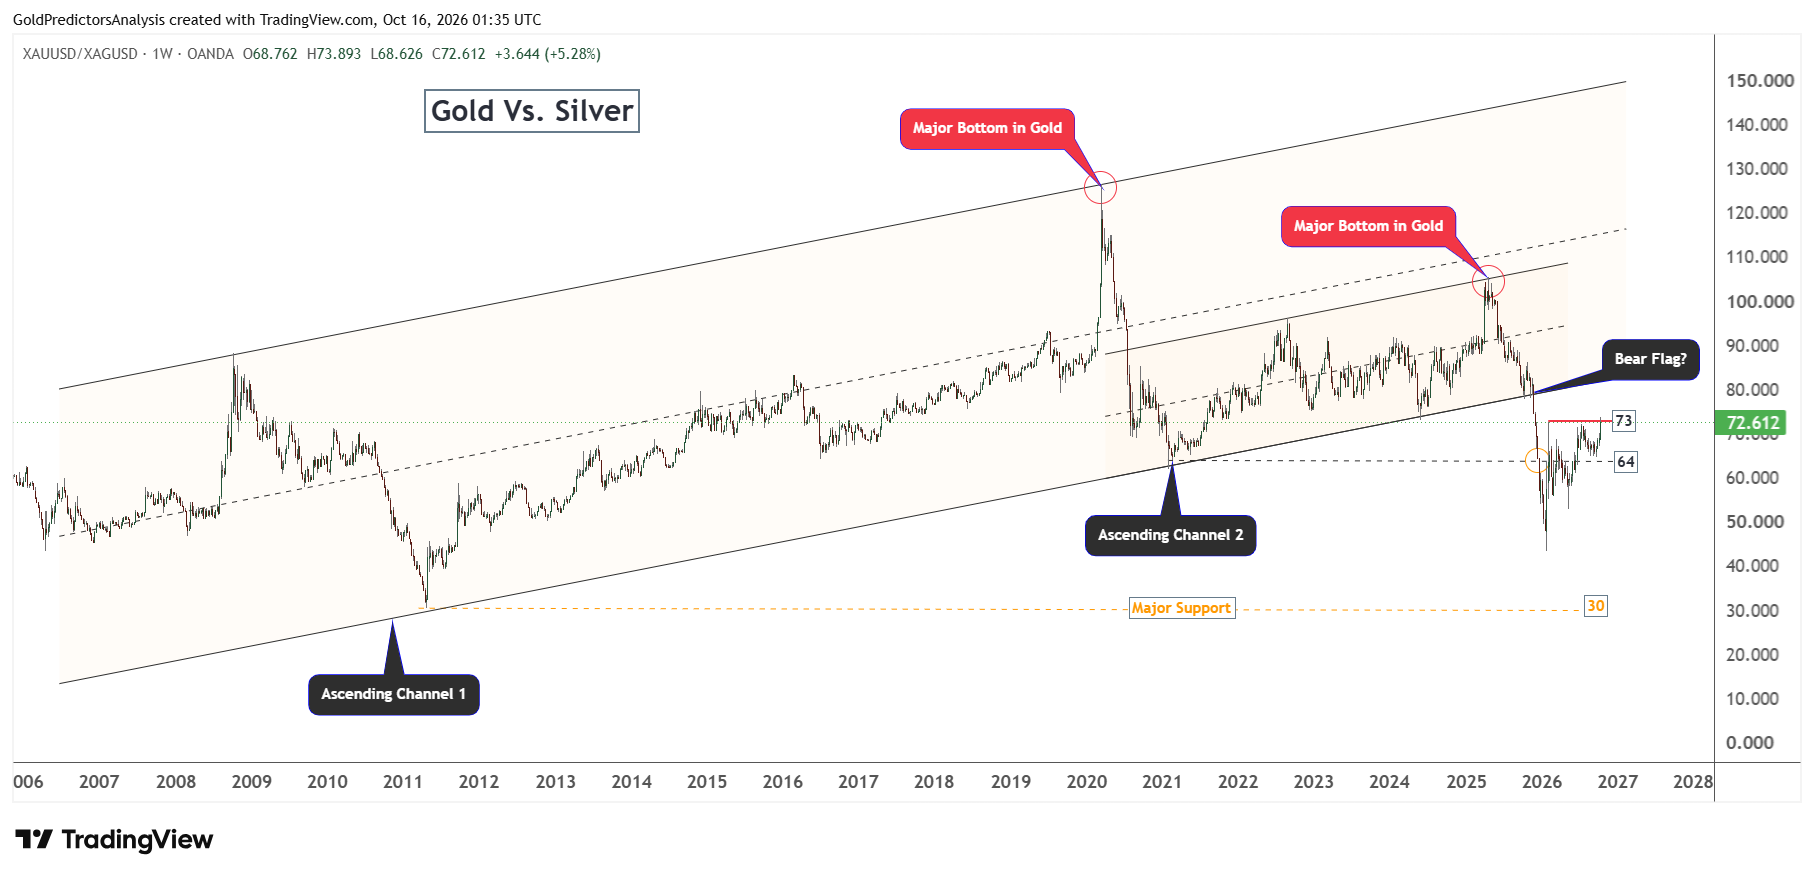
The gold-to-silver ratio has also rebounded and moved above the 73 region, which has been defined as the key resistance in the ratio. The strong rally in the ratio suggests that gold and silver prices have more room to drop. According to historical price action, major bottoms in gold and silver prices form when the ratio peaks.
The ratio produced peaks in March 2020 and April 2025 at the key resistance of the ascending channel pattern. The breakdown from this ascending channel pattern in November 2025 triggered a strong drop.
Now, the ratio is rebounding again to find the next resistance. Once the ratio produces a peak, gold and silver prices will likely confirm a bottom and initiate a strong rally.
What to Watch Next
Gold and silver prices remain vulnerable despite the rebound on Thursday. The drop in Treasury yields could support further gains in precious metals, but persistent inflation keeps the risk of a Fed rate hike in focus. The comments by Warsh could shape the next move by changing expectations for interest rates.
Gold needs to clear $4,200-$4,250 to strengthen the recovery, while silver needs to break above $64. A break below $4,100 in gold could expose $4,000, while a break below $55 in silver could bring $50 into view. The increase in the gold-to-silver ratio also shows that silver remains weaker than gold.
Read more: Softer Dollar Fuels Rebound After Hot CPI