Earnings Catalyst Meets a Potential Bottom
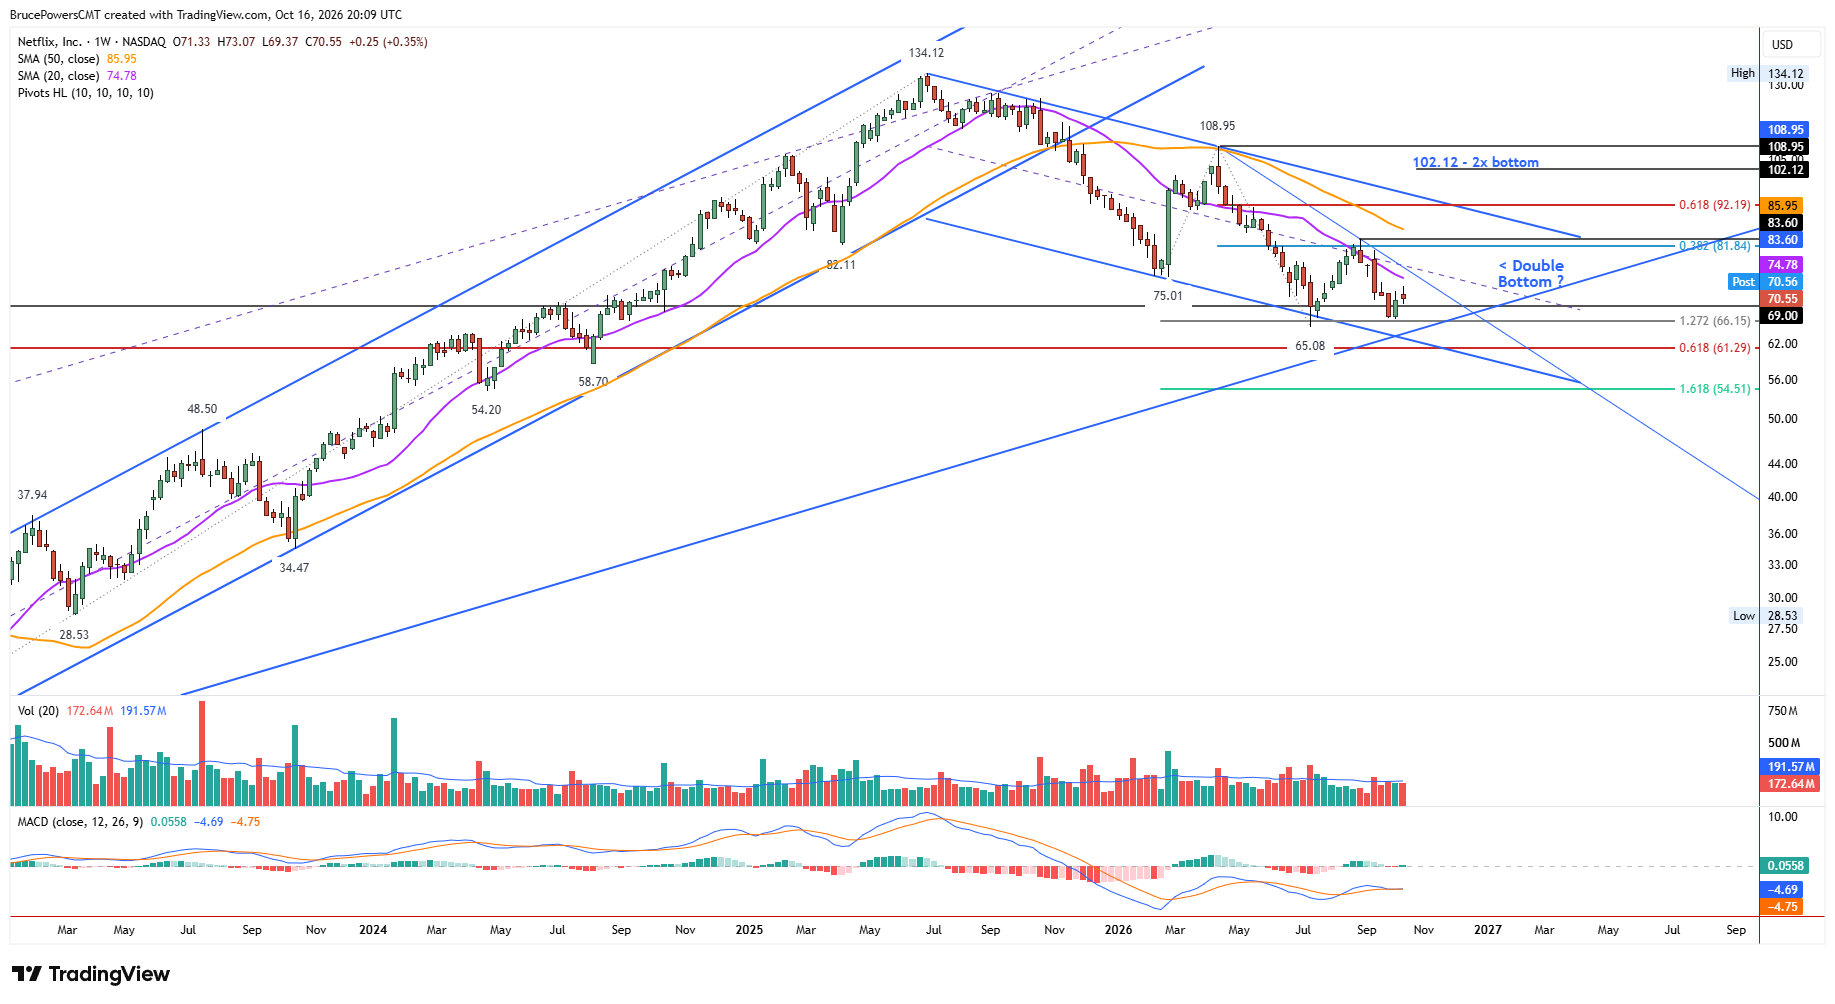
Netflix, Inc. (NFLX) reports its Q3 2026 results on Tuesday, October 20, 2026, after the market close. While much of the technology sector has been under pressure, NFLX is beginning to show the beginning of a possible bottom and completion of its bearish correction that followed the $134.12 peak in June 2025. A low was reached at $65.08 in June, and a higher swing low of $66.54 was established last week, opening the possibility of a double bottom pattern, with a breakout level at the recent lower swing high of $83.60.

Weekly Reversal Strengthens Bullish Evidence
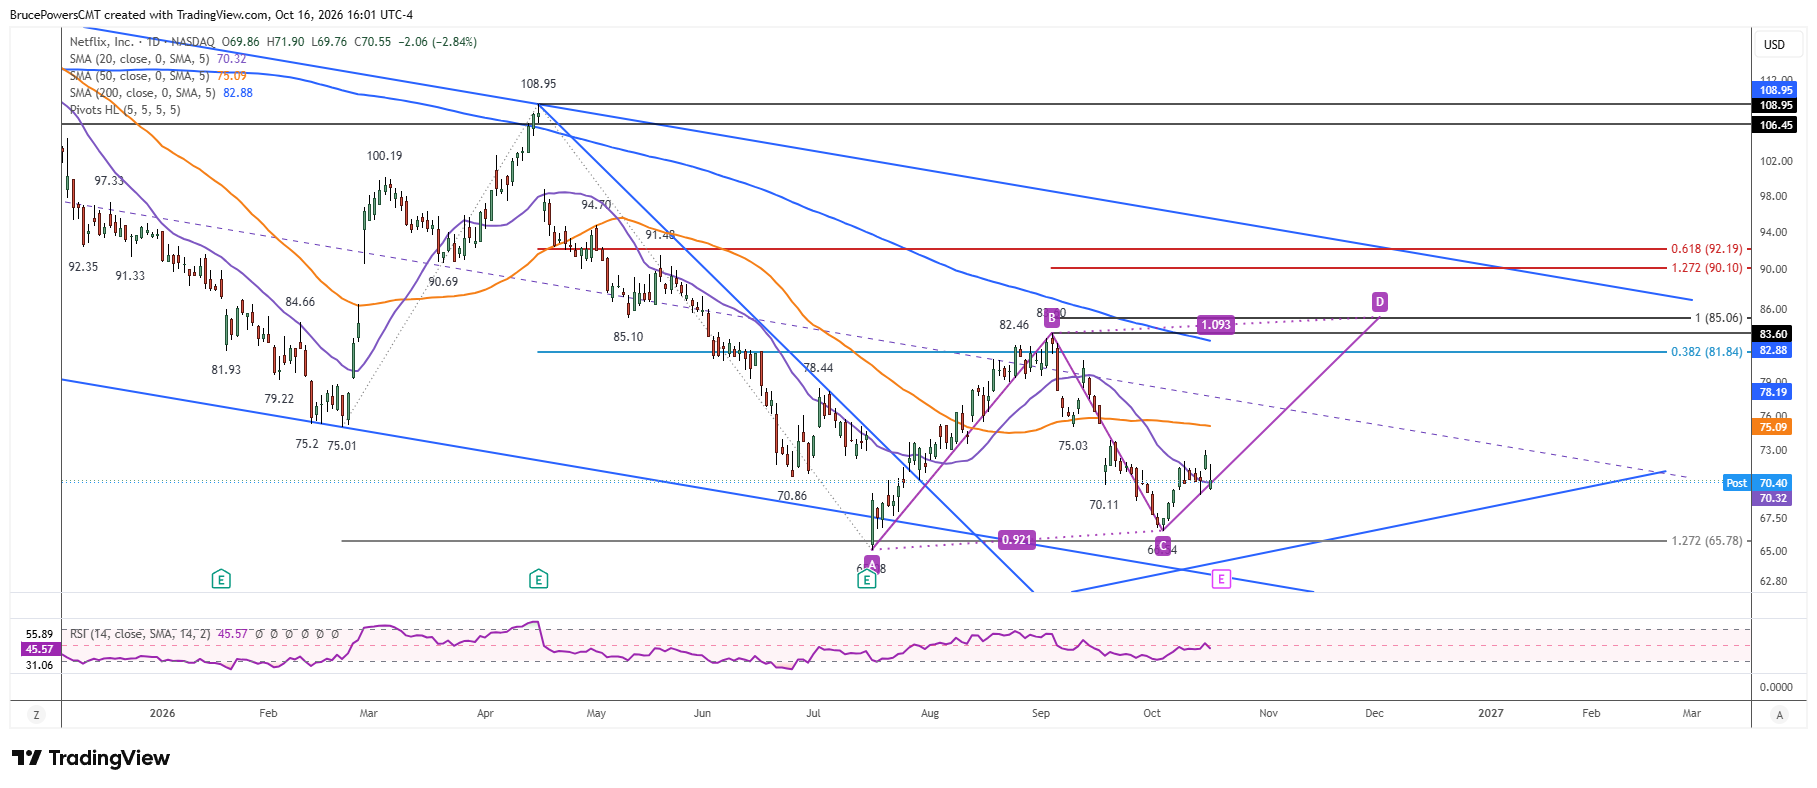
A weekly bullish reversal signal established a higher swing low last week upon the rise above last week’s high of $72.10. The new swing low is now key support at $66.54. It is a sign of strengthening and the potential for a rally that could eventually exceed the $83.60 high and trigger a double bottom breakout. If triggered, dynamic resistance near the 200-day moving average would have already been reclaimed showing strength, as it is now near $82.88 and falling. Notably, the double bottom pattern shows support above the long-term rising trendline begun from the 2002 low, adding to the bullish technical evidence that strong support has been reached.
Breakout Targets Reach Toward $102
If the double bottom eventually triggers above $83.60, suggesting a potential upside target of $102.12. First, though, NFLX needs to continue its advance from the second bottom, toward that first major upside target defined by the recent lower swing high. There is also the 100% target for a rising ABCD pattern nearby at $85.06. Therefore, the first upside target zone is from $83.60 to $85.06.
Earnings May Decide the Next Direction
With the earnings schedule for Tuesday, the technical setup may remain unresolved until then. Support at $66.54 is key, while a breakout above $83.60 would trigger the double bottom pattern and open the way toward $102.12.