


Near-Term Resistance Caps Friday’s Advance
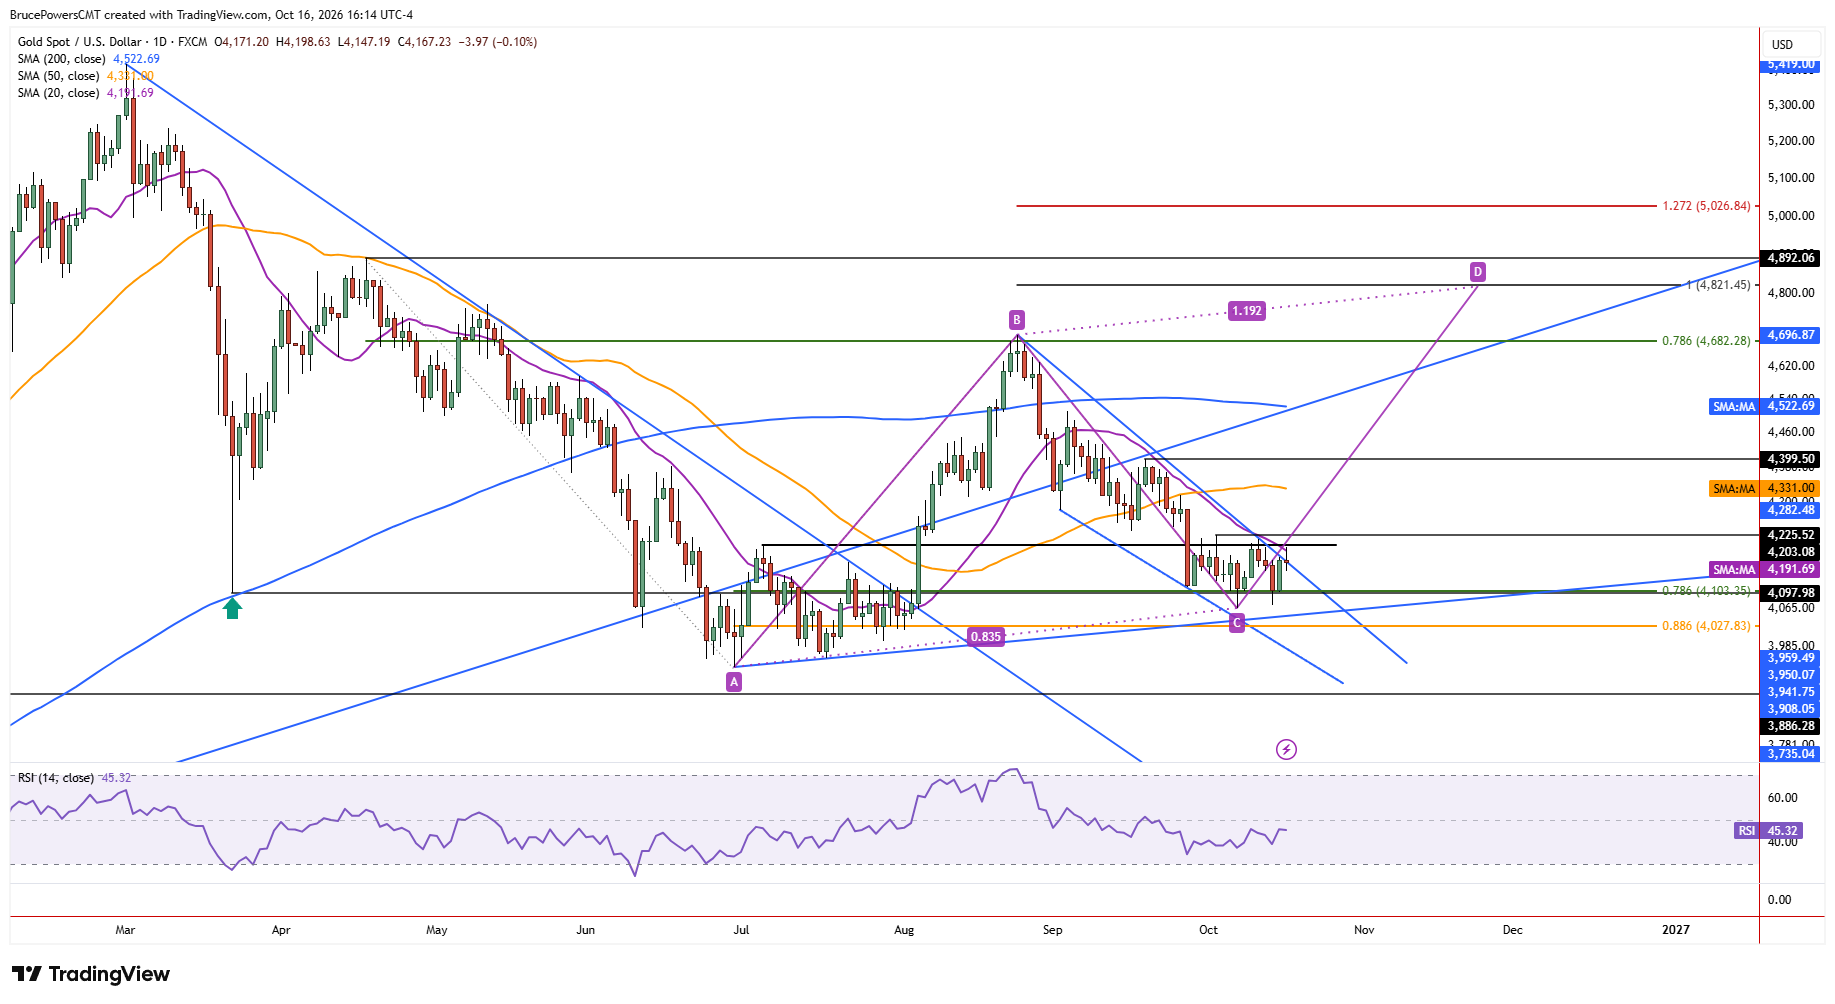
Gold pulled back after advancing to a three-day high on Friday, before sellers regained control, establishing resistance near the 20-day moving average. Trading remained in the lower half of the day’s range at the time of writing, pointing to a potentially bearish candlestick pattern. The session’s higher low of $4,147 marks a key near-term level, as a break below it would trigger a one-day bearish reversal following the failed attempt to rise above this important trend indicator.

Persistent Support Signals Underlying Resilience
This is the third consecutive week that gold has tested the key support zone, with support holding above the recent low of $4,066. Sellers have had multiple opportunities to push gold lower, but they have been unsuccessful so far. That resilience suggests underlying demand may be improving, even as the broader daily trend remains bearish.
Weekly Structure Hints at a Trend Reversal
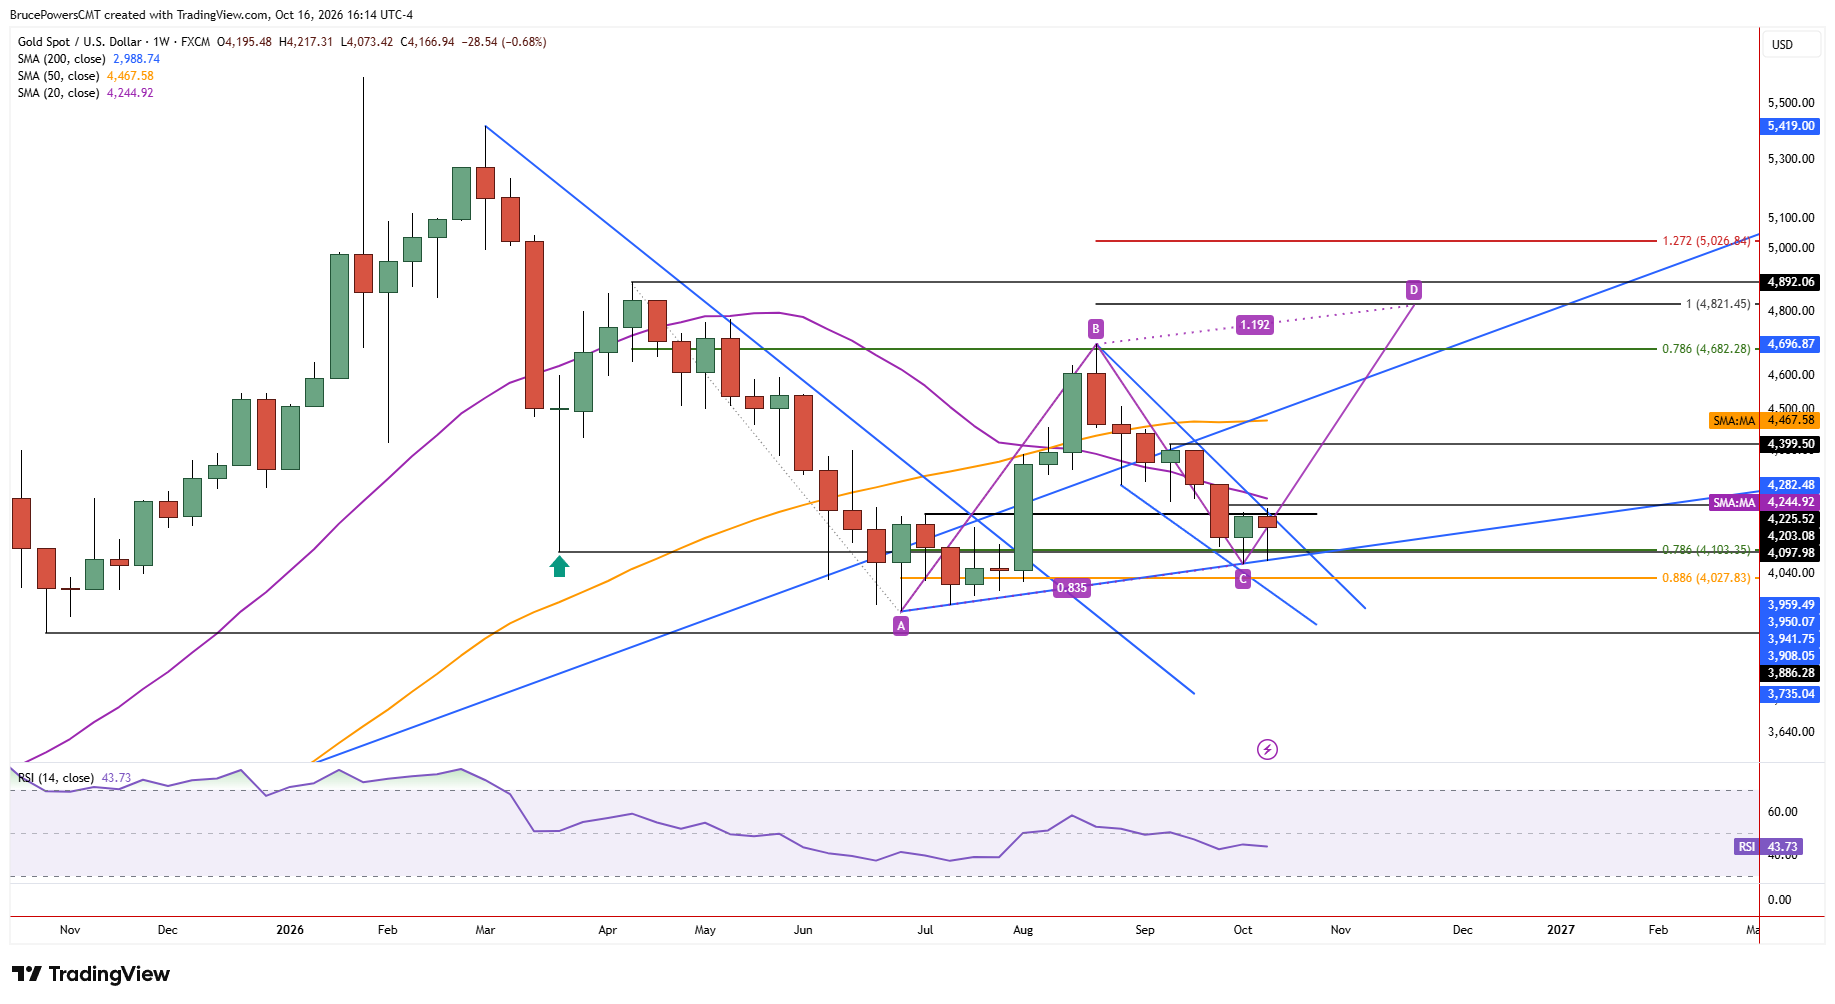
The weekly chart provides a perspective that is less apparent on the daily timeframe. This week formed a higher weekly high and higher weekly low, signaling an attempted reversal in the bearish correction. Although the breakout was not confirmed by a daily or weekly close above last week’s high of $4,208, it suggests improving underlying demand and leaves open the possibility of another attempt to break above the two-week consolidation range.
Breakout Triggers Define the Bullish Case
A move above the 20-day moving average would provide an initial sign of strength and could attract additional bullish momentum. However, a decisive advance above the recent lower swing high of $4,226 is needed to trigger a bullish reversal signal in the daily trend structure. Another earlier sign of strength would be seen on a rise above this week’s high of $4,217, as a rise above it would signal renewed strength in the weekly advance. A sustained move above the relevant swing high would also reinforce the potential for a new advance from the $4,066 support area, following the initial recovery from the early-August consolidation low.
ABCD Pattern Points Toward $4,821
An upside breakout would open the way toward a measured-move target near $4,821 (D), projected by the rising ABCD pattern on the chart. Price symmetry for the two upswings converges at that level, making it a potential resistance zone. A decisive breakout above this target, however, would signal continued strength and expose the next upside resistance zone. Until gold clears those near-term resistance levels, the ability to hold support above $4,066 remains central to the potential recovery.
Gold Price Forecast
Every new Gold analysis as it publishes, today's technical signal and key levels, live price — on one page.
See all Gold forecastsIf you’d like to know more about how to trade gold and silver, please visit our educational area.



