Natural Gas
Henry Hub’s fundamental balance now includes yesterday’s completed storage release rather than just the pending inventory estimates that we had been working with. The EIA report showed an injection of 67 billion cubic feet for the week ending October 9, lifting Lower 48 working gas to 3,567 billion cubic feet. Stocks were 45 billion cubic feet above the 5-year average but 143 billion cubic feet below the year-earlier comparison. The report was published yesterday at 10:30 a.m. Eastern.
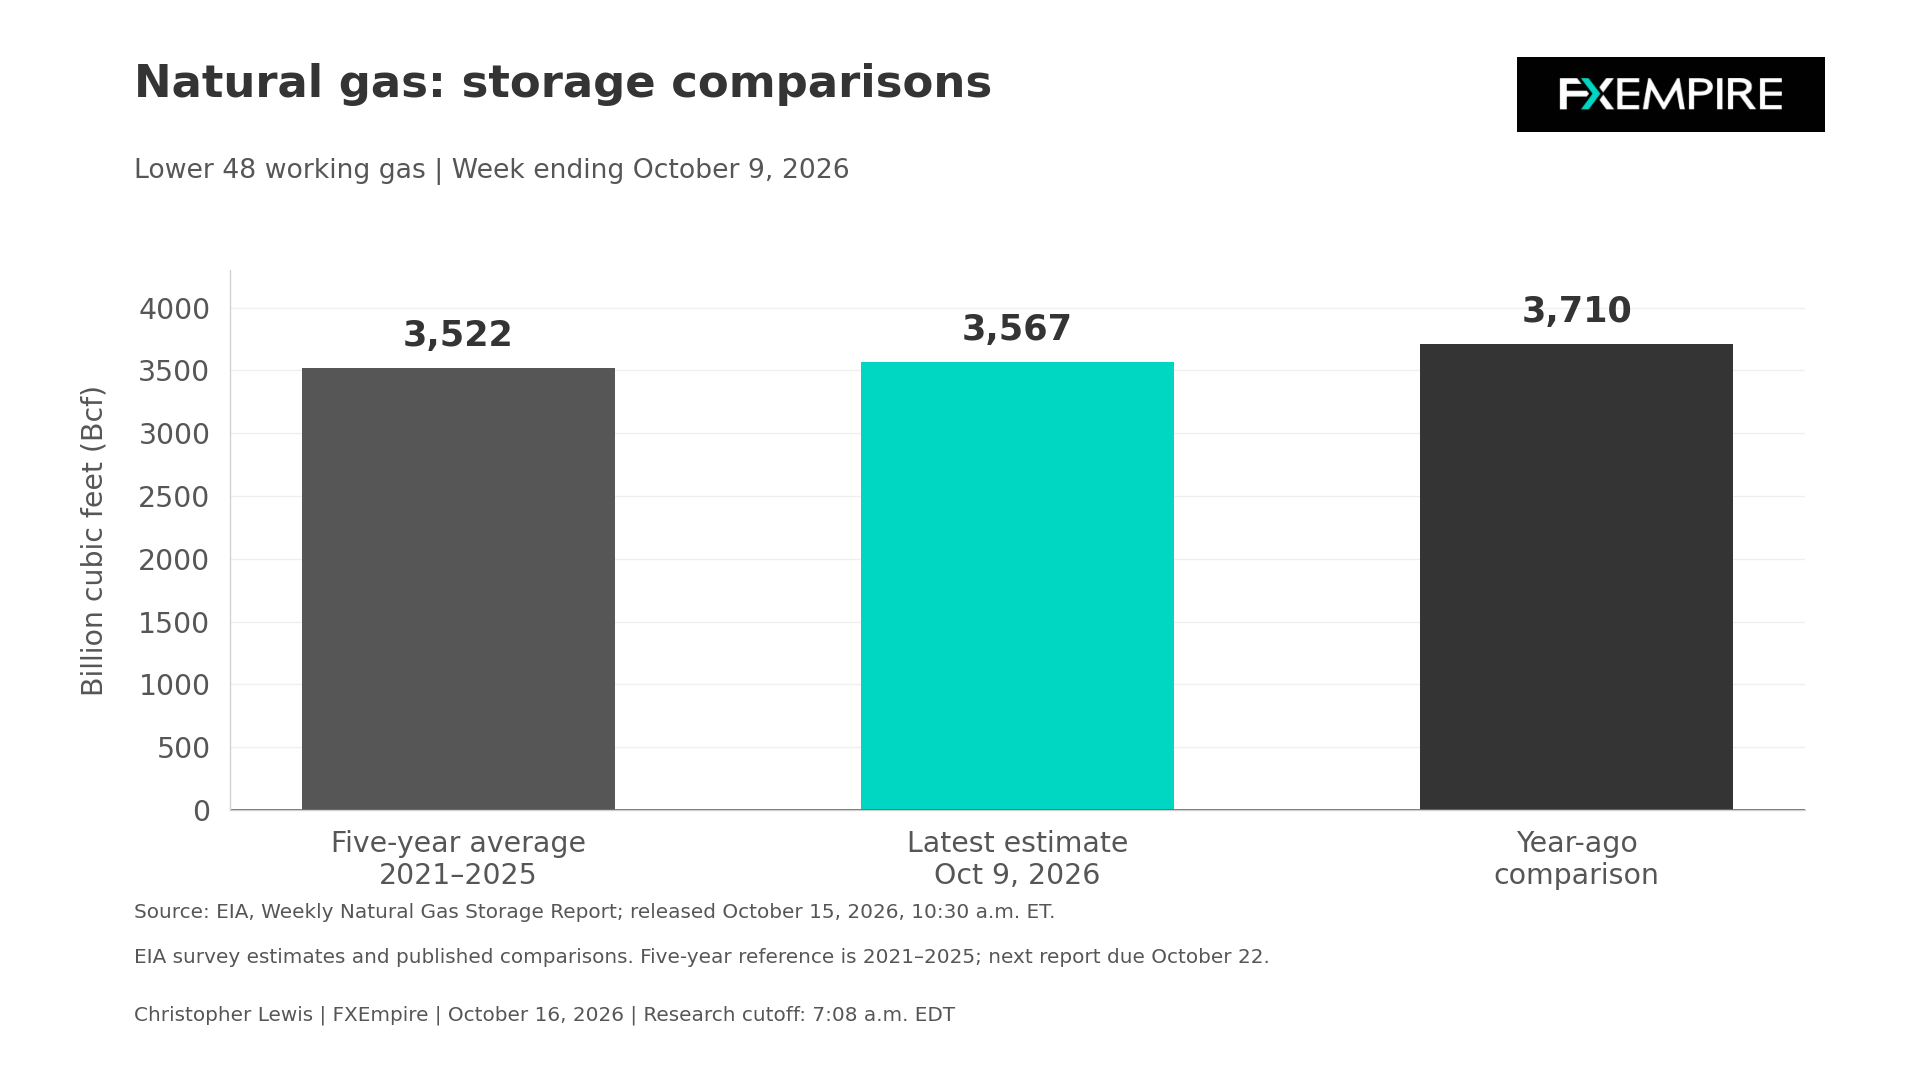
This leaves a modest seasonal buffer rather than an obvious national shortage. My interpretation is that the surplus against the average provides some protection against changing demand, while the year-earlier shortfall cautions against describing supply as exceptionally comfortable.

Regions See a Difference
Regional detail also adds an important qualification. South Central stocks were 1,097 billion cubic feet compared with the 5-year average of 1,132 billion cubic feet. Its salt cavern inventory stood at 236 billion cubic feet against a 279 billion cubic feet average. This shows why a national surplus cannot establish that every region or storage type has the same cushion. Regional availability becomes more relevant if demand rises quickly or if infrastructure restricts movement. Gas held in one location is not automatically interchangeable with supply needed elsewhere at the same moment. A claim of an actual bottleneck would still require some verified pipeline and operating notice, and none has been asserted.
Weather Remains a Factor
Weather currently offers a counterweight to the tighter regional comparisons. NOAA’s Climate Prediction Center outlook, issued October 15 at 3 p.m., favors above-normal temperatures across nearly all of the contiguous United States east of the Rockies for October 21 through 25. Probabilities exceeded 80% in parts of the Upper Midwest. Below-normal temperature odds are elevated across much of the Southwest and Great Basin.
Warmth in major northern heating regions could restrain the seasonal increase in residential and commercial demand, allowing more available supply to remain in storage. That is a forecast-based implication, not a measure of declining consumption. Southern warmth can also sustain cooling demand, so the national balance depends on where temperatures depart from normal.
For October 23 through 29, NOAA still favors above-normal temperatures east of the Rockies but expects the magnitude of warmth to diminish as the atmospheric ridge weakens. The discussion highlights increasing model uncertainty at this moment, which makes forecast revisions important. A colder change would matter most if it became persistent along the large heating-demand regions.
Natural Gas Price Forecast
Every new Natural Gas analysis as it publishes, today's technical signal and key levels, live price — on one page.
See all Natural Gas forecastsWinter Baseline
The EIA’s October 6 Short-Term Energy Outlook supplies a separate winter baseline. It projects end-of-October inventories around 3,850 billion cubic feet, roughly 2% above the 5-year average. This model assumes winter heating degree days near last winter’s national level, and inputs were closed October 1. Later weather and operational developments therefore require further assessment.
Supply Growth
Supply growth and export demand remain a competing structural influence, with the EIA forecasting U.S. dry production averaging 112.2 billion cubic feet daily in 2026 and 116.3 billion cubic feet daily in 2027, while LNG exports average 17.6 and 18.6 billion cubic feet daily. These are annual projections, not current daily production or terminal feed gas measurements. Sustained production growth would create more room to accommodate exports and domestic demand. However, a forecast of additional supply is less useful for near-term pricing than evidence that gas is actually being produced or delivered. The distinction applies to LNG capacity, capability, and realized demand on the pipeline system; they are different issues.
The next weekly storage release is October 22. Between now and then, changes in official weather guidance and verified operating information might change the outlook. The current storage injection should not be labeled as a market surprise without some type of verified expectations benchmark. Fresh daily production, LNG flows, and time-stamped official Henry Hub quotes are all in flux, with the EIA storage supplement page unable to expose the current detail in demand or supply.
The supported balance is somewhat conditional. Modest national inventory cover and regional deficits coexist.
Technical Support Remains Below Current Levels
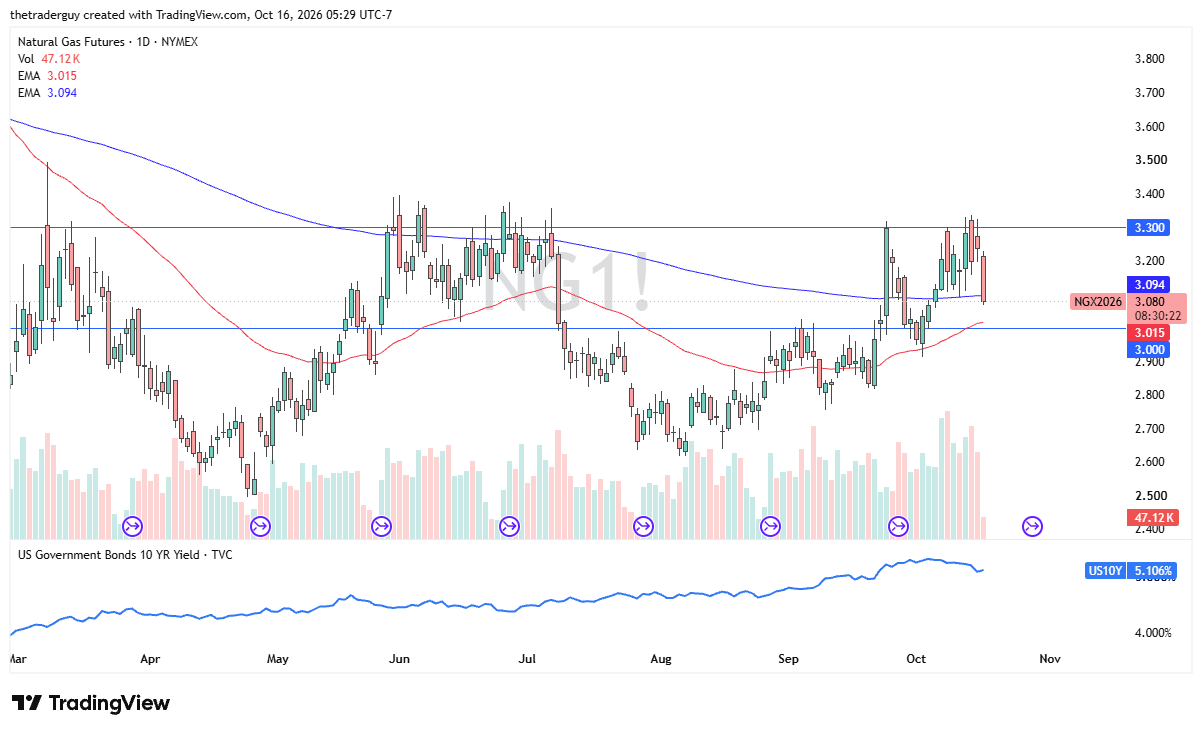
We are seeing some pressure, as the $3.30 level continues to be a bit of a barrier. The $3.30 level extends to the $3.40 level. Ultimately, the 50-day EMA sits just above the $3 level, which is previous resistance, and it is a significant market memory area. I believe that buying the dip will continue to be how many traders out there will be looking at this market.