Gold vs Yields
Gold has a fundamental assessment with a notable contrast. Yesterday’s stronger PPI report was followed by the daily Treasury observation of lower nominal and real yields. This evidence supports a discussion of competing forces in the gold market, but it does not establish that PPI caused the yield decline.
The U.S. Treasury’s 10-year constant maturity par yield fell to 2.78% on Thursday from 2.84% on Wednesday. These are daily estimates from the inflation-protected yield curve rather than live quotes, but they do give you an idea as to how the bond market is behaving.
The interpretation that I take away from this is that the lower real yield potentially reduces the opportunity cost of holding gold. An investor comparing bullion with inflation-protected government debt now faces a slightly smaller quoted real return on that asset. The level remains positive, however, so the interest-income competition has eased rather than completely disappeared.
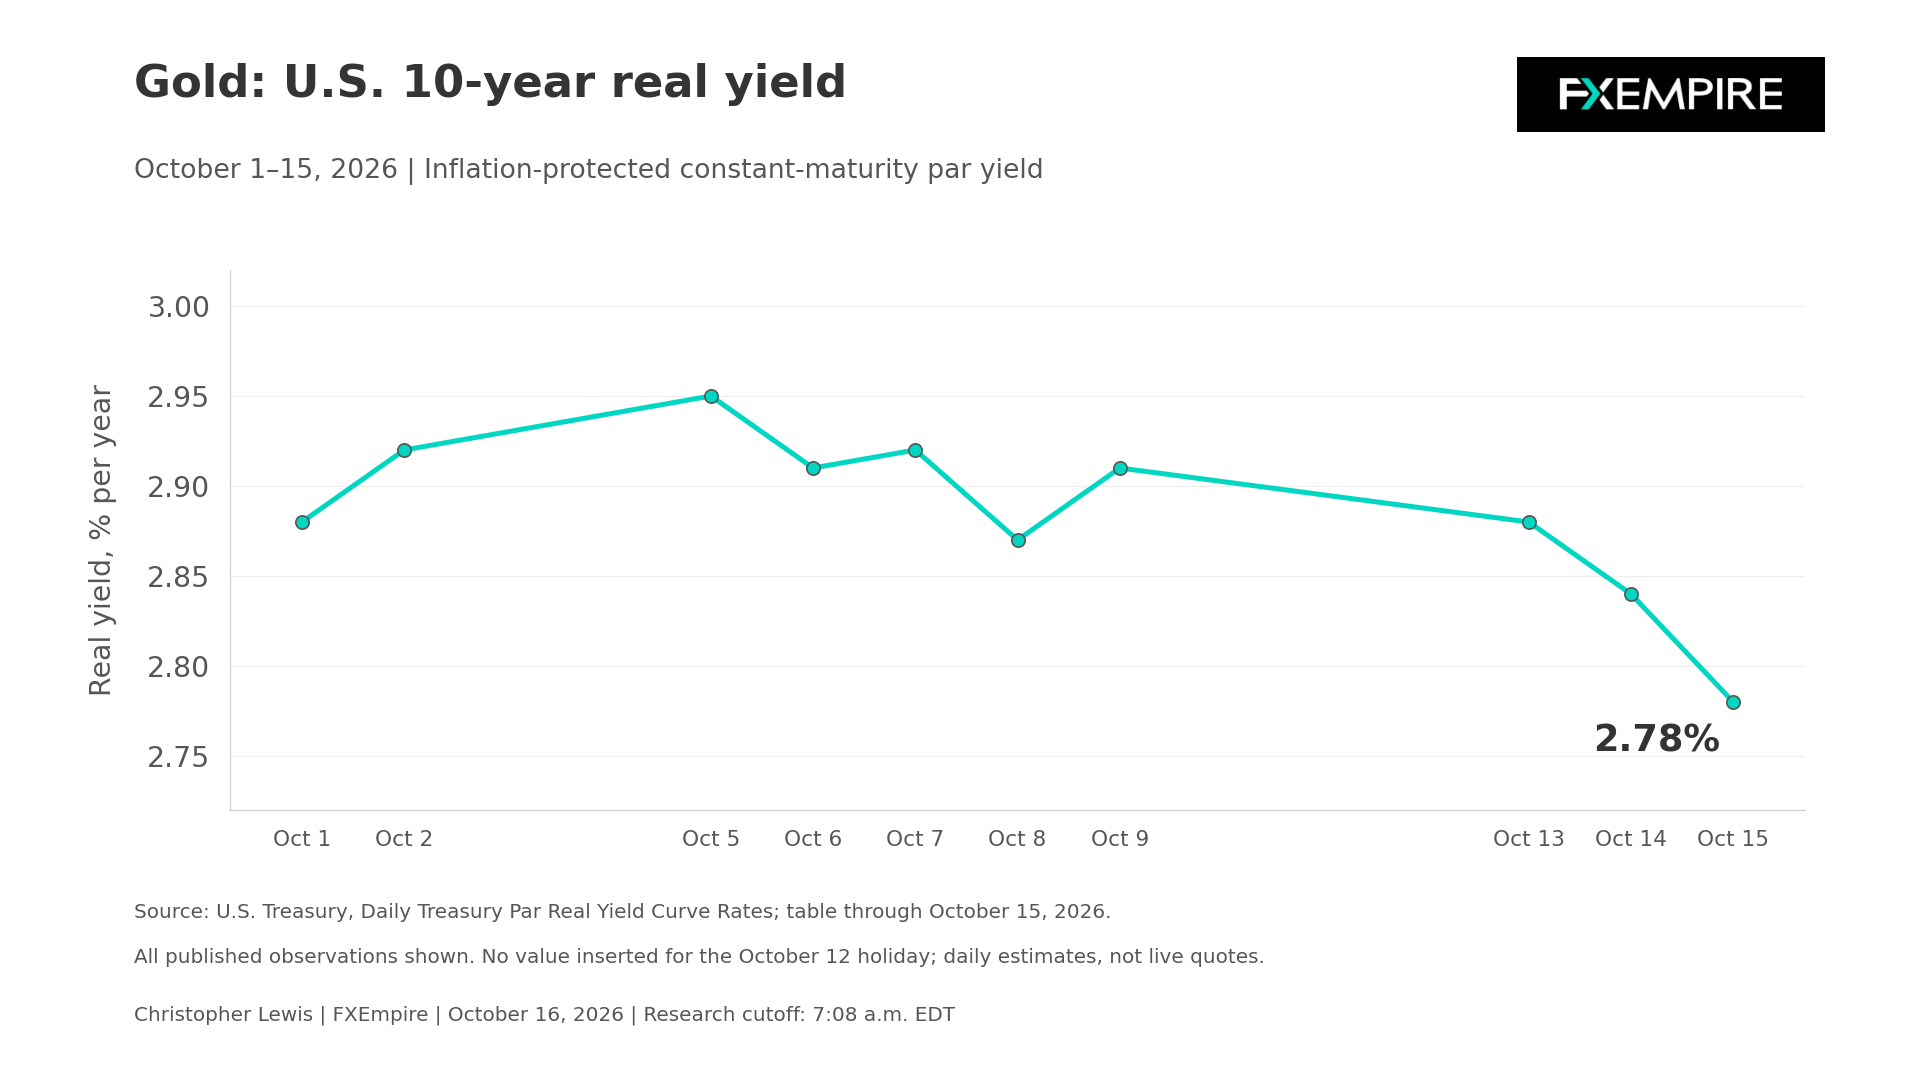
Gold’s relationship with yields will vary at times, as liquidity and demand for protection can change. Nominal rates also declined. The 2-year Treasury par yield fell from 4.82% to the 4.77% level, and the 10-year fell from 5.19% to 5.10% between October 14 and October 15. The broad decline differs from the mixed maturity movement seen during the previous day. It is a change in the financing backdrop, but does not necessarily identify a single cause.
Inflation remains the counterweight. BLS published September PPI on Thursday, with final demand prices increasing 1.3% monthly after seasonal adjustment and 6.3% annually before adjustment. The measure excluding food, energy, and trade services rose 0.5% monthly and 5.0% annually. September readings are preliminary, and earlier months were revised.
For gold, persistent producer-price pressure can support interest in purchasing-power protection while complicating expectations of monetary easing. These channels can coexist at the same time and have been seen from time to time in the markets. The question now is whether future inflation pushes real financing costs higher or whether demand for protection remains strong enough to outweigh them.
The real-yield measure also needs to be distinguished from a simple subtraction of current CPI inflation from a nominal bond yield. The Treasury series comes from inflation-protected securities at a fixed maturity. This makes it a useful financial benchmark, but it is neither a forecast of gold’s return nor a complete measure of every investor’s expected purchasing-power gain.
The Wednesday CPI release provides separate consumer-price evidence. September headline CPI increased 0.6% monthly, seasonally adjusted, and 3.7% annually unadjusted. Core CPI rose 0.3% monthly and 2.6% annually. Producer and consumer prices cover different baskets and transactions in the U.S. economy, so their rates are not added together, nor are they treated as interchangeable.
The last Federal Reserve decision was the September 16, 25-basis-point increase in its target range to 3.75% to 4%. The statement also emphasized elevated inflation and restoring price stability. That existing decision is distinct from any expectation about the next meeting scheduled for October 27 and 28.
Gold Price Forecast
Every new Gold analysis as it publishes, today's technical signal and key levels, live price — on one page.
See all Gold forecastsAs things stand right now, the Fed funds watch tool still believes that the Federal Reserve will be on hold for this month. Import prices are due today in New York, followed by industrial production. Neither has massive influence on the market, but they become part of the bigger puzzle for figuring out inflationary pressures.
The more supportive combination would be a continued easing in real yields alongside evidence that inflation is contained without a sharp deterioration in economic activity. A renewed rise in real yields would challenge that interpretation. If inflation and activity send conflicting signals, gold may face competing protection and financing-cost influences.

Technical Analysis
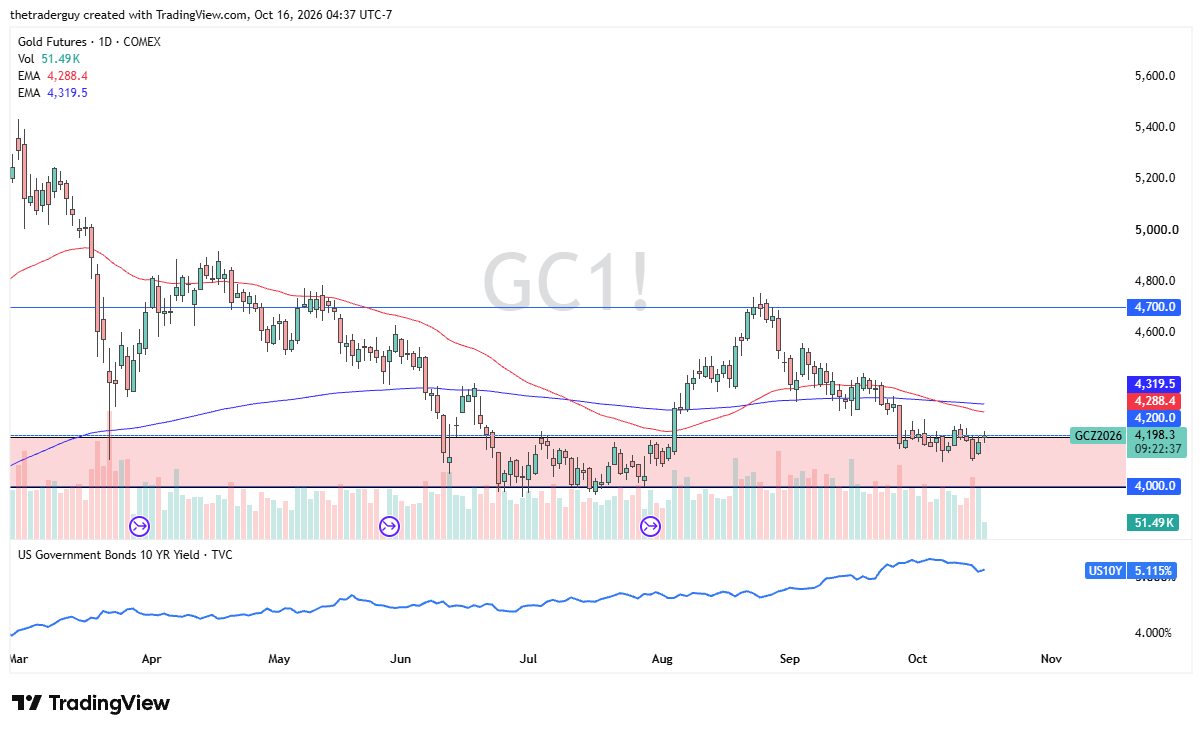
Gold is testing the top of a major demand zone that extends from $4,000 to $4,200. This is a market that remains very noisy and very choppy, but it is in an area that, if yields can ease a bit, could be enticing for bulls.
Short-term pullbacks continue to look like short-term buying opportunities, but a breach below the $4,000 level would, in fact, have me thinking things get much more bearish.