WTI Crude Oil
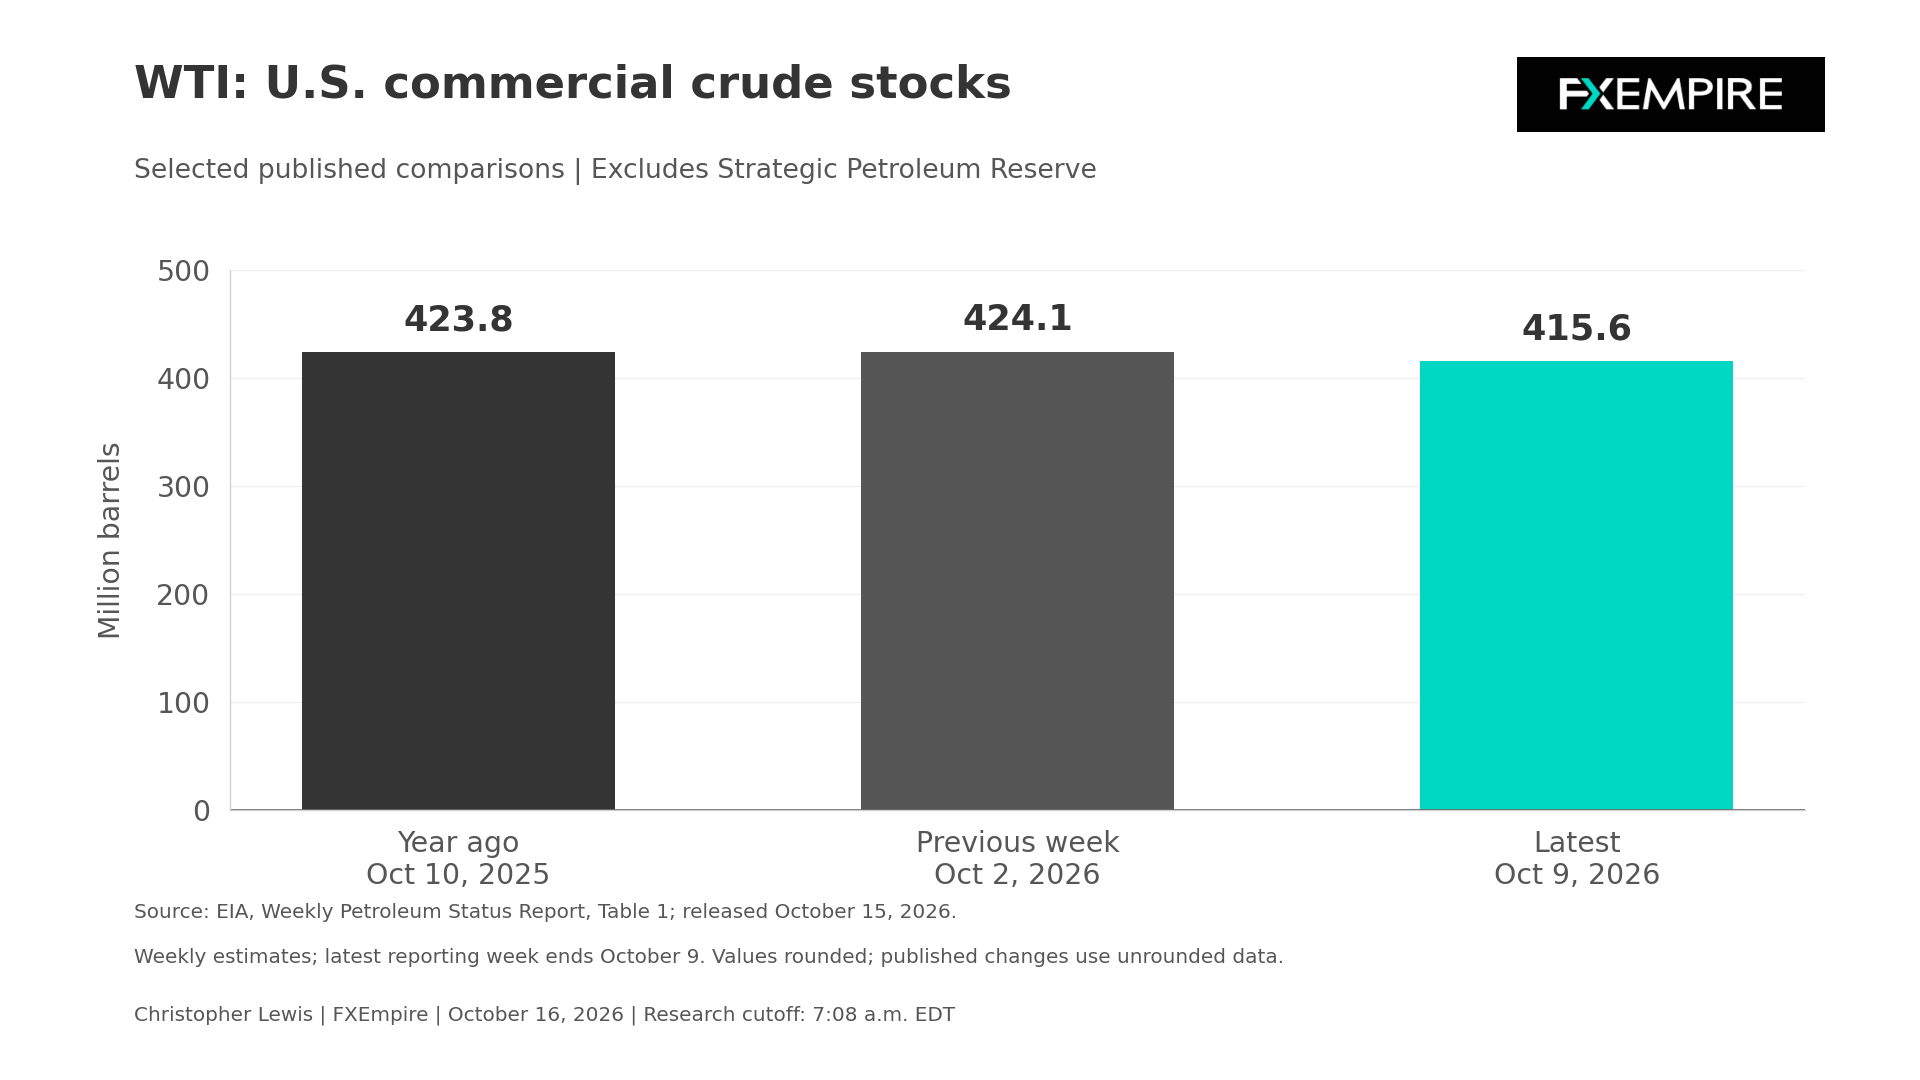
Yesterday’s holiday-delayed EIA petroleum report is moving the WTI crude oil market. For the week ending October 9, commercial crude inventory, excluding the Strategic Petroleum Reserve, fell by a reported 8.6 million barrels to 415.6 million. The previous week’s published level was 424.1 million, and the corresponding year-earlier figure was 423.8 million.
The operating details support a more specific interpretation rather than demand strength. Estimated crude production fell 300,000 barrels per day to 13.689 million, while imports declined to 6.049 million barrels per day. Refinery crude inputs increased to 16.615 million barrels per day. Reduced incoming supply and sustained processing both matter to the draw. Inventory alone cannot isolate consumer demand in this scenario.

Product Stocks Show Contrasting Signals
Product stocks offered contrasting signals. Gasoline inventories increased by a reported 3.5 million barrels, while distillate stocks declined 2.5 million to 102.6 million. Refinery utilization reached 93.5%. The combination suggests a crude draw should be read alongside the product balance. Refiners can consume more crude while individual fuels accumulate or tighten for multiple different reasons.
Emergency reserve policy remains relevant in the background for WTI-grade crude oil. As of October 10, the Energy Department authorized exchanges of up to 4 million barrels for ExxonMobil and BP America to address weather-related disruption from the hurricane in the Gulf of Mexico. Another sustained reduction in commercial stocks would reinforce concern about accessible U.S. barrels. Conversely, recovering production or inputs could loosen the balance without requiring a collapse in demand. The next report needs to show whether the decline was temporary or persistent, particularly if refinery activity remains firm.
Technical Setup
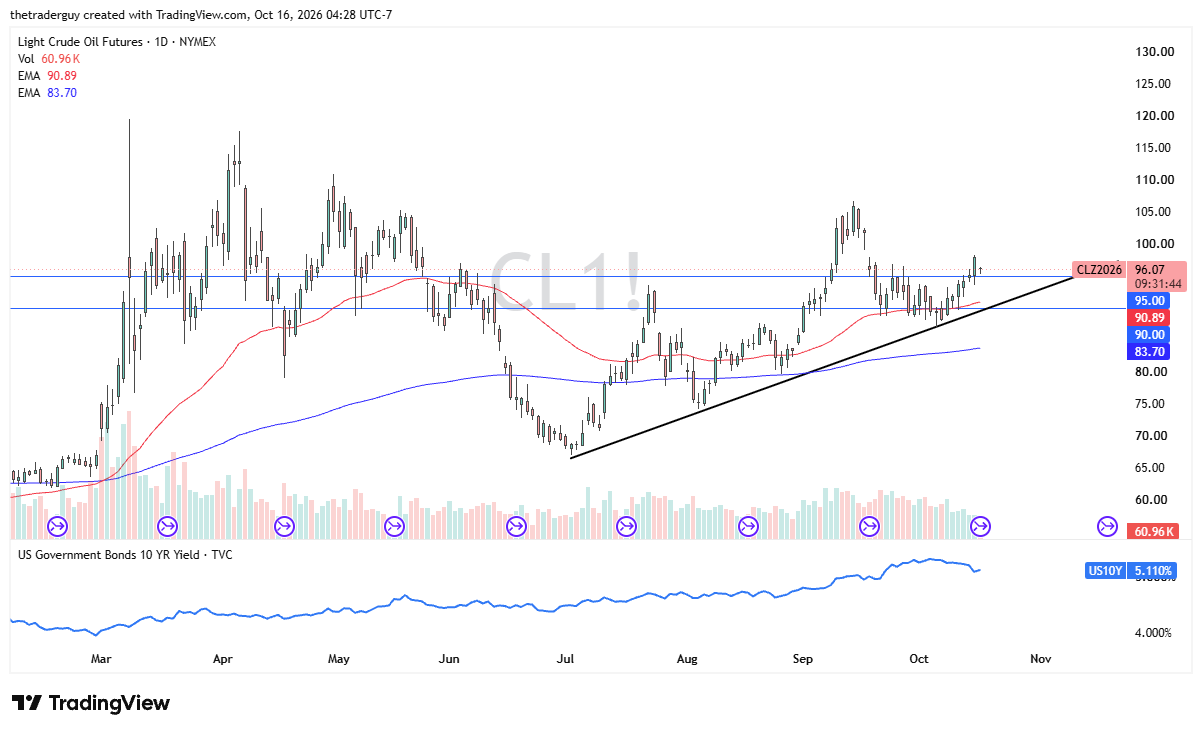
The WTI crude oil market is currently hanging around the $95 level, showing signs of support as we had gapped lower and then bounced from that area. From the $95 level, I see support all the way down to at least the 50-day EMA, if not the $90 level. This remains very much a buy-on-the-dip type of scenario from what I can see, and the gap from several weeks ago is all the way up toward the $102 level. So, I suspect that bullish traders may still have that in mind.
Brent
Brent’s international balance remains shaped by the difference between recovering production and reliable delivery. The IEA October 14 Oil Market Report estimated September global oil supply at 102.3 million barrels per day, up 2.5 million from August. That is evidence of a recovery in the agency’s assessment, but it doesn’t imply that depleted inventories at consuming locations have been completely restored.
Brent Oil Price Forecast
Every new Brent Oil analysis as it publishes, today's technical signal and key levels, live price — on one page.
See all Brent Oil forecastsInventory Composition
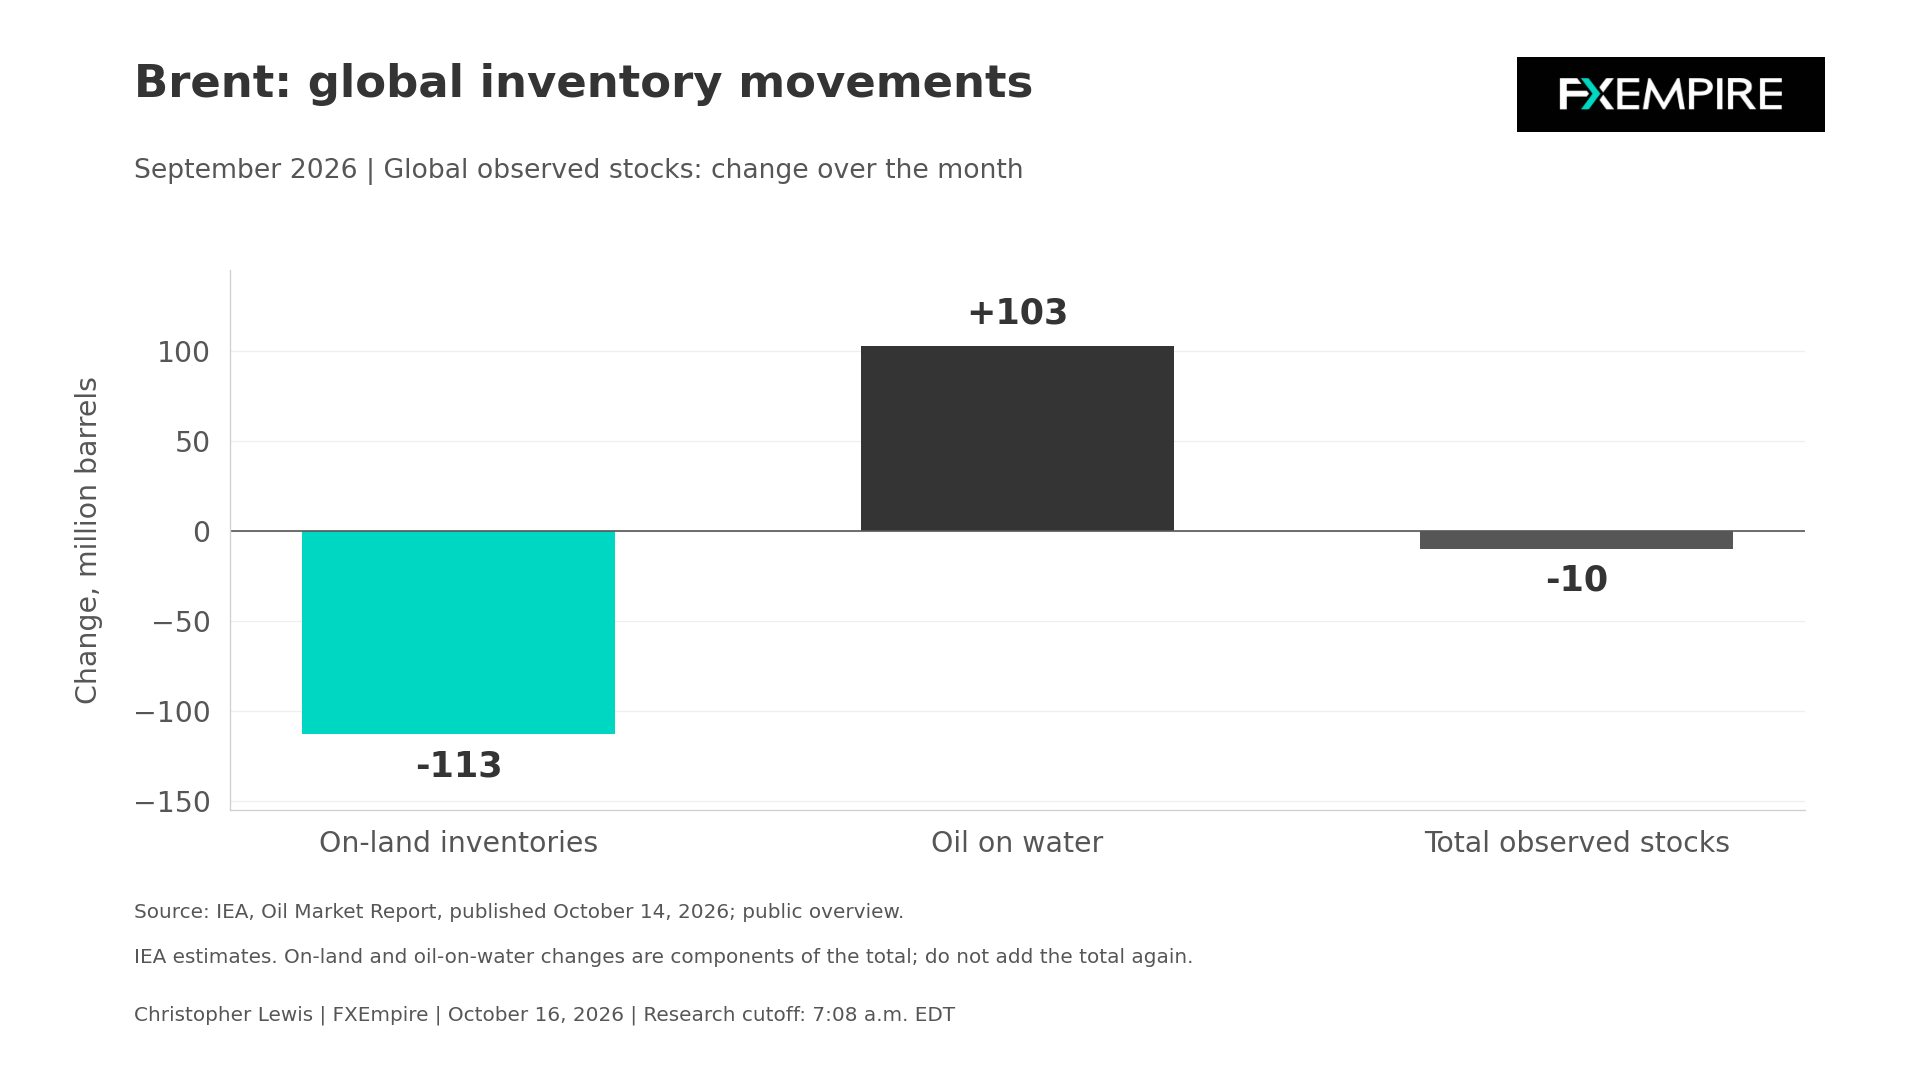
The inventory composition explains the concern. September on-land stocks fell 113 million barrels, while oil on water rose 103 million, leaving total observed stocks roughly 10 million lower. My interpretation is that a modest aggregate decline can conceal a more substantial and consequential reduction in immediately accessible land-based buffers. Cargoes can eventually replenish tanks, but transit and delivery risk affect the timing.
Demand also limits a purely bullish reading. The IEA forecasts fourth-quarter global oil demand to decline 2.5 million barrels per day from a year earlier. This is still just a forecast, though, rather than a completed quarterly observation.
October 6 EIA
EIA’s October 6 outlook offers an older baseline. It estimated Middle Eastern production shut-ins at 4.8 million barrels per day in September, compared with 5.8 million in August. The fourth-quarter Brent spot-price forecast averaged $105 per barrel, and the model inputs did close October 1, so later developments are outside this forecast and must be kept in the back of your mind.
The question for Brent is going to be whether or not improving production becomes dependable supply at refineries and storage terminals. Restoring land-based inventories would weaken the scarcity argument more convincingly than an increase in cargo still at sea. The Brent market still remains highly exposed to global supply risk, but has different pressures than the WTI market, which seems more of a temporary type of scenario.
Technical Outlook
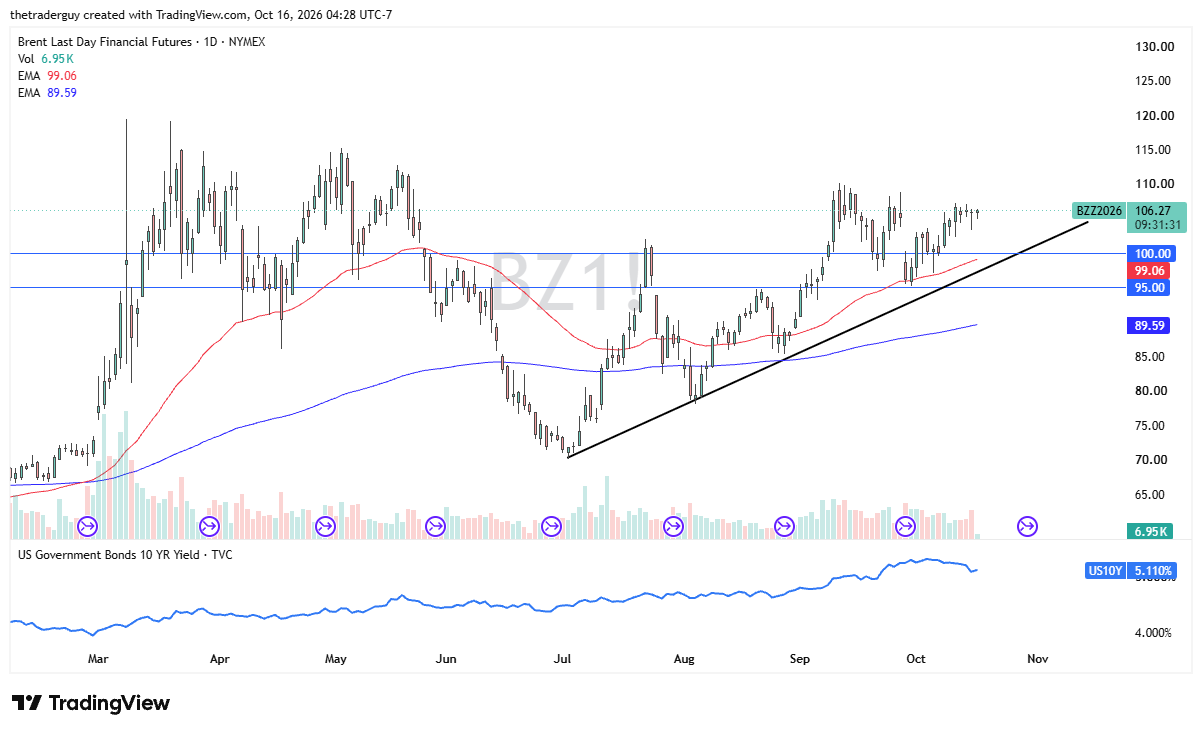
The Brent market did initially try to pull back early during trading on Friday, but has since seen buyers coming into the market, showing resiliency and continuing upward pressure. This market, much like its cousin the WTI market, remains very much buy on the dip, but it seems to be facing quite a bit of resistance near the $110 level.