The Dow Is Holding Up, but Tech Is Still Taking the Hit
The stock market is not getting a broad Friday recovery. The Dow is higher because money is finding financials, healthcare and a few consumer names. The S&P 500 is lower, and the Nasdaq is taking the bigger hit as chip and AI shares continue to lose ground.
The rotation has not changed. AI buyers did not come back after Thursday’s bounce, and the group that carried the market higher is now pulling on the Nasdaq. The Dow has enough support to stay green. That does not repair the weak side of the market.
At 15:07 GMT, the Dow Jones Industrial Average is trading 52,392.15, up 214.46 or +0.41%. The S&P 500 Index is trading 7,725.94, down 18.12 or -0.23%, while the Nasdaq Composite is trading 26,442.176, down 270.851 or -1.01%.

Daily S&P 500 Index (SPX) Technical Analysis
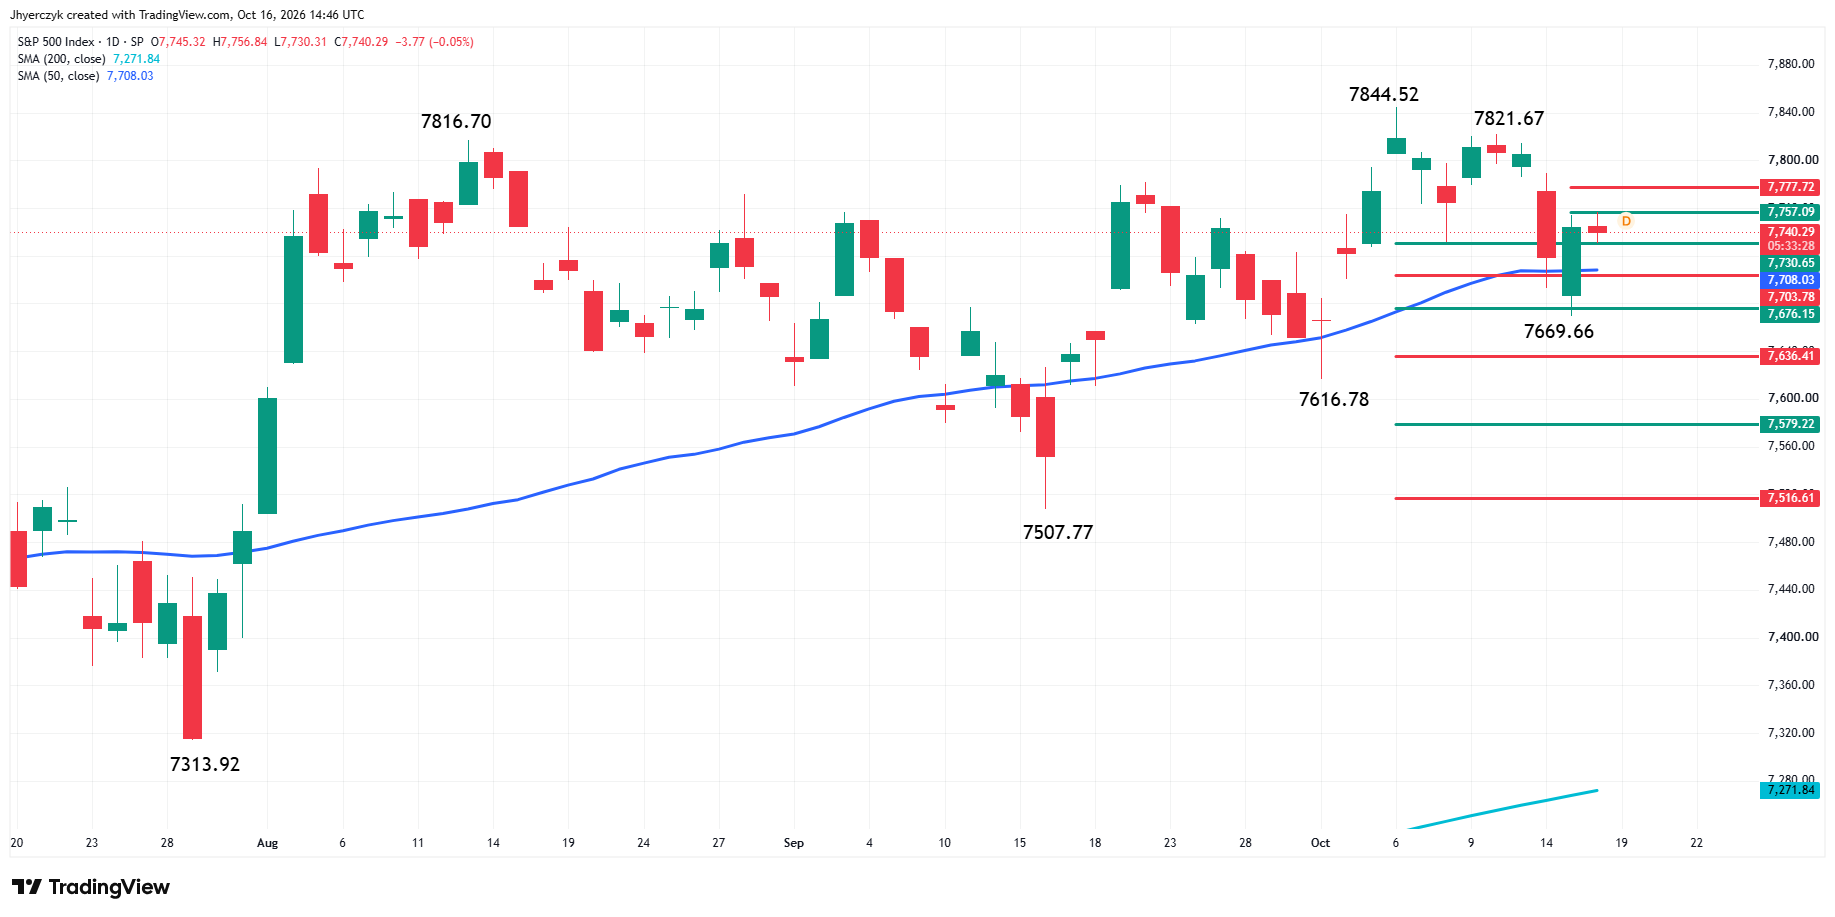
The S&P 500 Index is putting in a mixed performance early Friday. The main trend is down according to the daily swing chart. A trade through 7669.66 will signal a resumption of the downtrend. The main trend will change to up on a trade through 7821.67, followed by the record high at 7844.52.
The new minor range is 7844.52 to 7669.66. Its retracement zone at 7757.09 to 7777.72 is the first resistance zone target.
The intermediate range is 7507.77 to 7844.52. Its retracement zone at 7676.15 to 7636.41 was tested successfully on Thursday when the market reached 7669.66 and rebounded.
The swing chart downtrend and the formation of the secondary lower top at 7821.67 against the record high at 7844.52 has me leaning toward the downside. However, crossing to the strong side of the 50-day moving average at 7708.03 has complicated matters by shifting momentum back to the upside.
The key area to watch is the retracement zone at 7757.09 to 7777.72. This zone could either stop the current rally or act as a trigger point for an acceleration to the upside. This retracement area controls the short-term direction and the main trend indicator controls the longer-term outlook. The 50-day moving average controls the momentum.
Dow Jones Price Forecast
Every new Dow Jones analysis as it publishes, today's technical signal and key levels, live price — on one page.
See all Dow Jones forecastsChip Sellers Are Still Running the Nasdaq
The semiconductor group is down again, and the selling is not limited to one stock. Micron, AMD and Sandisk are lower, while the VanEck Semiconductor ETF is off more than 1% Friday and nearly 9% for the week.
The China competition story is still hanging over memory stocks. That concern came in after a powerful run in the group, and traders are now looking at how much of the AI spending trade was already priced in.
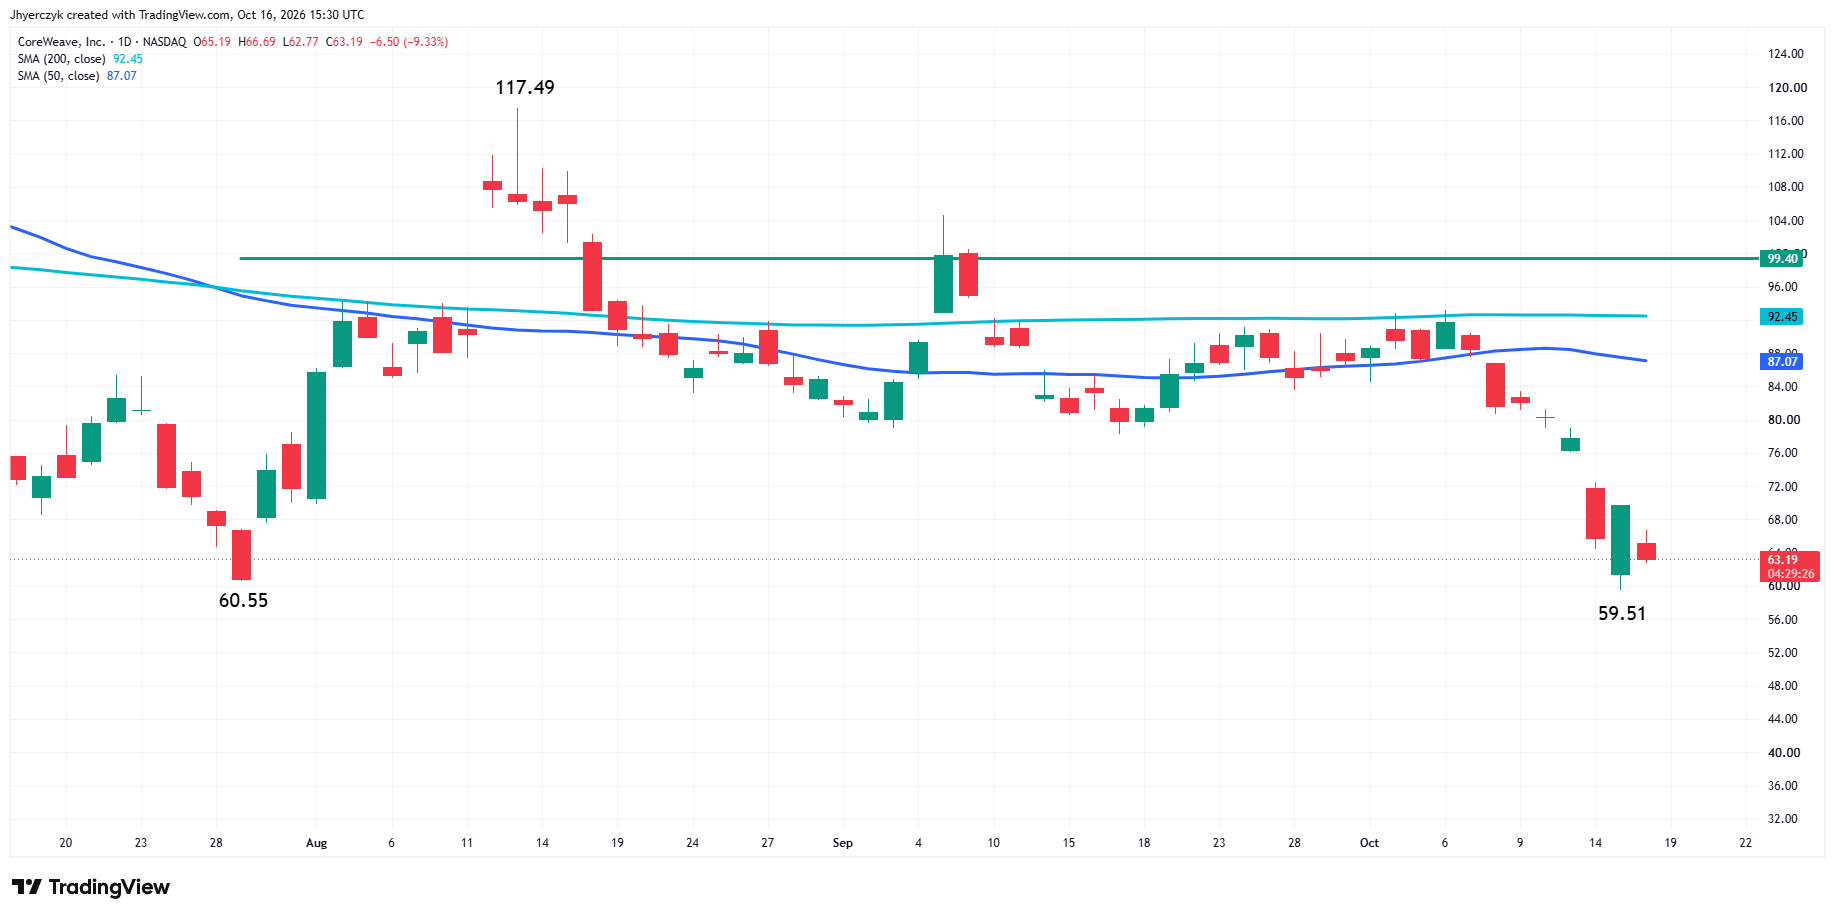
CoreWeave is lower again after Thursday’s recovery failed to hold. The company has become one of the clearest examples of the debt problem inside the AI build-out. When long-term rates rise, traders have less patience for companies that need to keep borrowing to fund growth.
Tesla is higher after unveiling its next-generation Roadster, but one strong name does not change the group. The Nasdaq needs more than a Tesla bounce. It needs the chip and AI sellers to stop pressing.
The Dow Still Has Buyers
The money coming out of tech is not leaving the stock market altogether. JPMorgan and Goldman Sachs are higher, while Nike and Merck are also adding to the Dow’s gain.
That is the reason the Dow is up for the week while the S&P 500 and Nasdaq are heading lower. The Russell 2000 is also in correction territory. The rotation has been selective, not broad enough to pull every index along with it.
Alcoa is higher after better-than-expected third-quarter earnings and a rebound in alumina. The company also pointed to data-center growth as a positive for aluminum demand. That is a different way to own the data-center trade than buying another chipmaker with a large AI premium already built into the price.
Travelers is lower despite beating estimates. The stock market is still rewarding the areas it wants to own and punishing the ones it does not. A beat is not enough when sellers are already in control of a group.
Inflation Still Sits Behind the Rotation
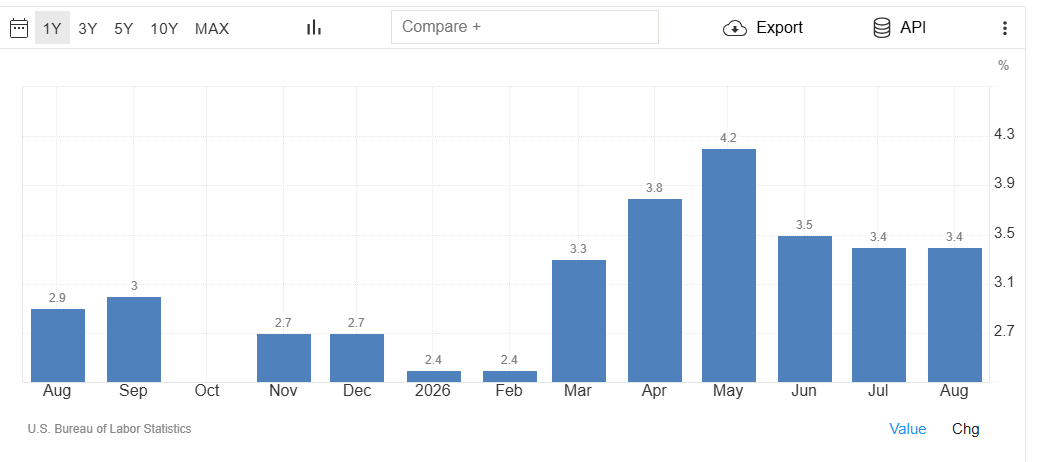
The hot CPI and PPI reports did not disappear because the dollar backed off Friday. Wholesale prices posted their largest increase since 2022, and consumer inflation remains well above the Fed’s 2% target.
Fed Chair Kevin Warsh did not give the market a new reason to price an October rate increase. FedWatch shows an 85% chance the Fed leaves rates unchanged at the October 27-28 meeting.
That helped take some immediate pressure out of the rate trade. It did not answer the bigger question over what happens before year-end. The AI group is trading as if higher borrowing costs and richer valuations cannot coexist for long.
What to Watch
The Dow is holding the rotation together, but the former leaders are still under pressure. The Nasdaq needs the chip group to stop making new weekly lows before a broader stock-market recovery can take hold. Until then, buyers are staying with financials, healthcare and selected industrial names while technology remains the weak side.
The S&P 500 held the intermediate retracement zone Thursday and is trading above the 50-day moving average. The main trend remains down, with the secondary lower top at 7821.67 still standing against the record high at 7844.52. The 7757.09 to 7777.72 retracement zone is where the recovery has to prove itself.
More Information in our Economic Calendar.