The Dow Jones Industrial Average ended the week near 52,000 as investors weighed the tariff relief by President Trump and a selloff in AI stocks. The correction in US Treasury yields and strong earnings by the companies could support a rebound. The increase in costs for imports may squeeze profits, while persistent inflation keeps further rate hikes by the Fed in focus. The index needs to clear 52,400 to strengthen the recovery towards 55,000. In my view, the broader outlook remains positive if the Dow remains above major support at 50,000. This article presents the main economic drivers and technical levels that could shape the next move in the Dow Jones.

Trump Tariffs: Russia Waiver and Stalled US–Mexico Trade Talks
President Trump issued the order to waive new tariffs related to Russia under the Graham Act. This relief covers 100% of duties linked to purchases of Russian energy and threatens major buyers such as India and China. The sanctions under early measures remain in place. The waiver removes the potential source of trade disruption and could ease concerns about the supply of global energy.
The trade talks between the US and Mexico offer less relief. The Wall Street Journal reported that the negotiations had stalled after opposition from Commerce Secretary Howard Lutnick. He reportedly opposed lowering 25% tariff on Mexican cars and 50% duties on steel and aluminum. The manufacturers still face uncertainty about costs in the future. If the materials are expensive, then companies may have to accept lower profits or raise the price. But higher prices could hurt sales.
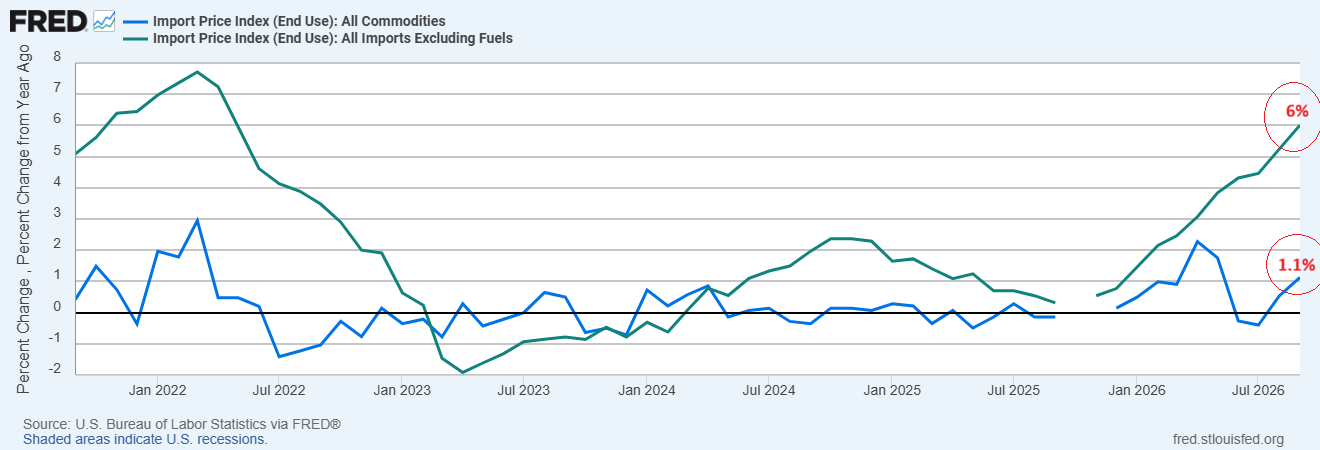
The imported goods are becoming more expensive. The import prices rose 1.1% in September and 8.1% over the past year. These figures do not include tariffs and do not show the extra cost of duties imposed by Trump.
It means that the imported goods were becoming more expensive before changes in tariffs. The high cost of imports could make it harder for companies to pay tariffs without raising prices. The chart below shows that the import prices with and without fuel are rising dramatically in 2026.
Dow Jones Price Forecast
Every new Dow Jones analysis as it publishes, today's technical signal and key levels, live price — on one page.
See all Dow Jones forecastsDow Jones Fundamentals: AI Selloff, Inflation and Earnings
AI Stock Selloff Tests the Dow’s Relative Strength
The weekly performance for Dow Jones has become uneven. The index gained over 0.5% last week, but the Nasdaq 100 lost over 5% and the S&P 500 dropped nearly 1.95%. The concerns about AI spending and financing weighed on technology stocks.
This split between the stocks suggests that investors are becoming more selective about growth and valuations. The relative strength for Dow Jones is encouraging but it does not remove the risk that broader selling could spread to technology and industrial members.
US Inflation Keeps Fed Rate Hike Risks in Focus
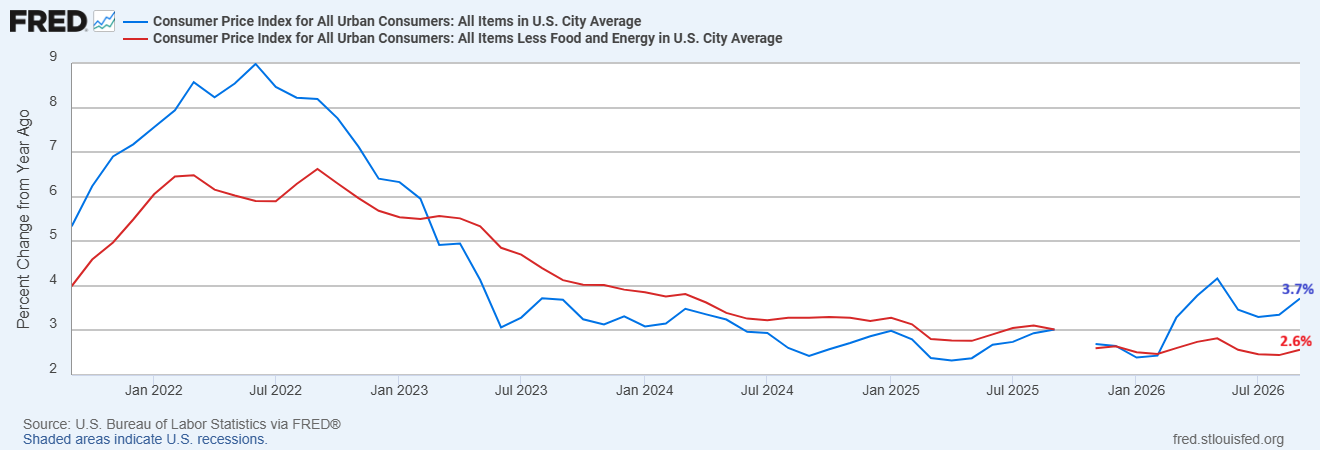
Inflation remains major challenge for stocks. The US CPI for September increased 3.7% from a year earlier, while the core CPI increased 2.6%.
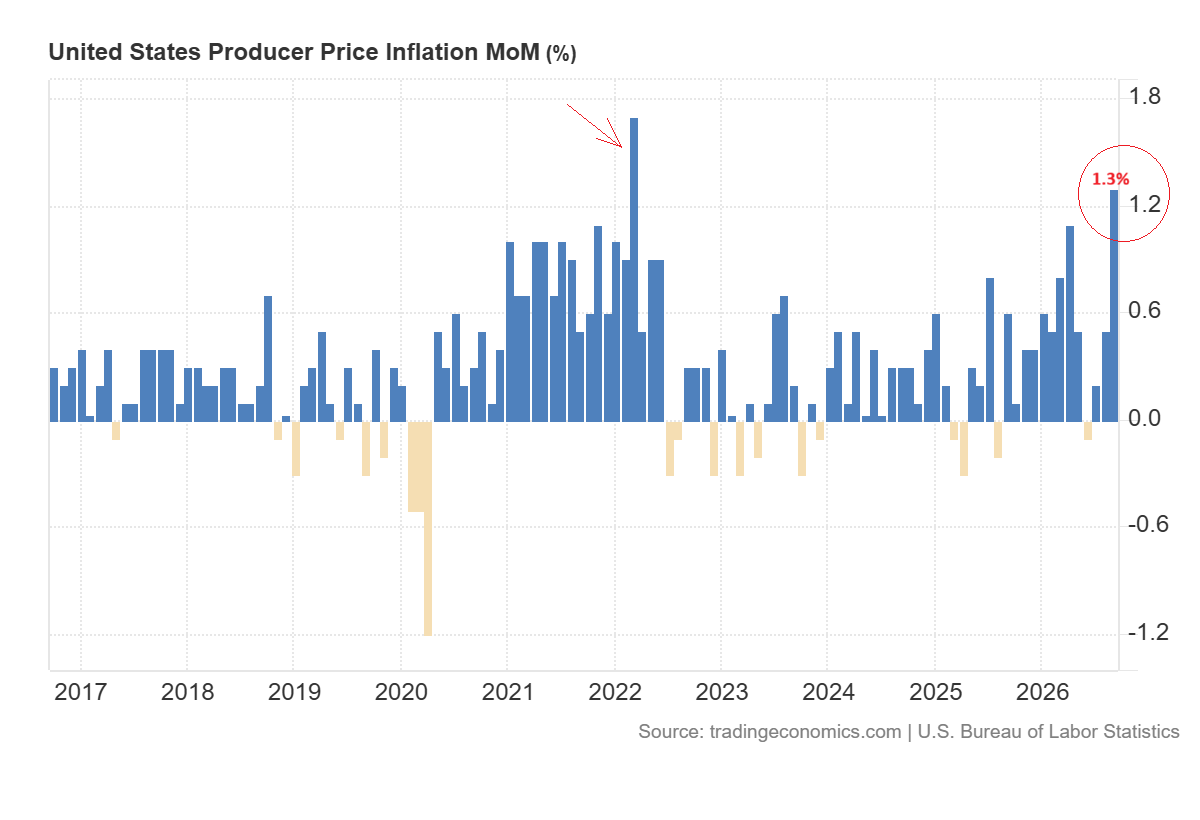
Producer prices jumped 1.3% during the month.
Fed Chair Kevin Warsh did not provide any clear signal on Friday about interest rates. The 10-year Treasury yield dropped to 5.10% last week, which provided some relief. But the persistent price pressure keeps further tightening in play. The high cost of borrowing could restrain investment and stock valuations.
Retail Sales and Earnings Support the Dow Jones Outlook
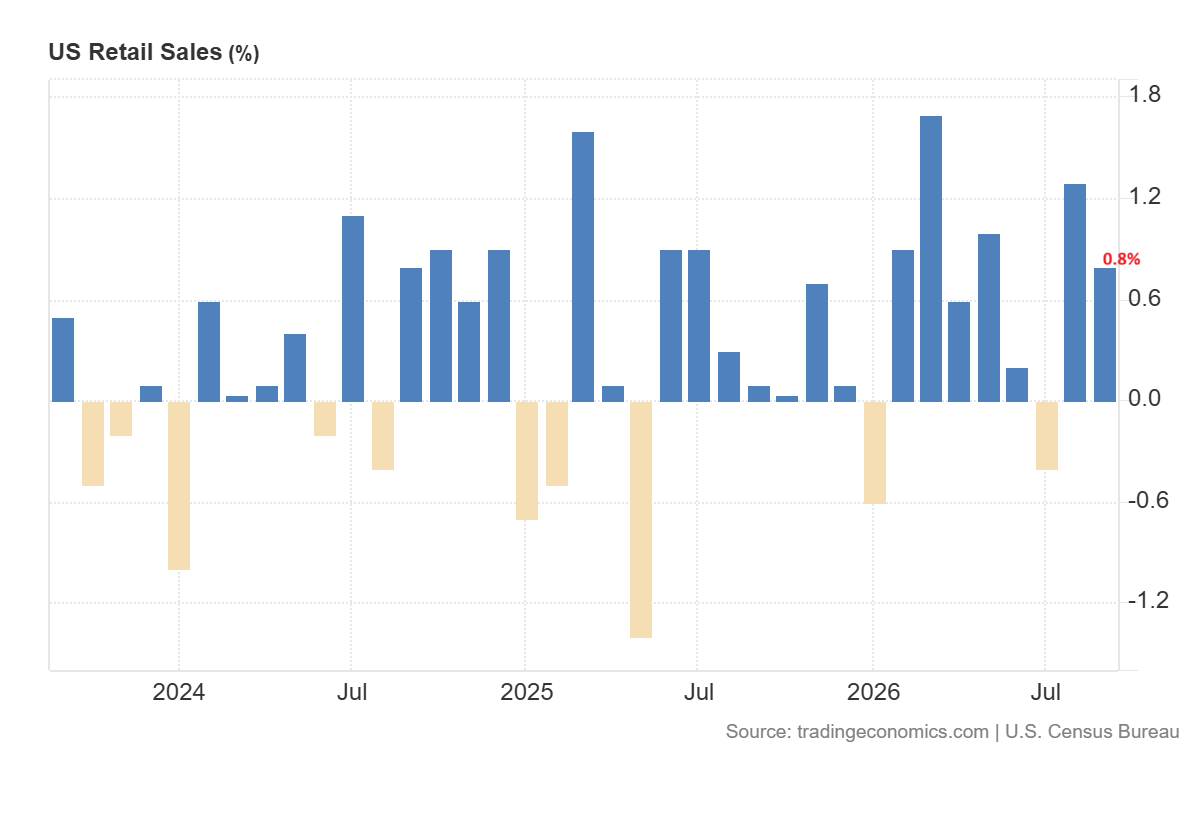
Consumer spending still supports the growth outlook. The chart below shows that retail sales increased by 0.8% in September. But the data include price increases, so they do not show an equal rise in sales volumes.
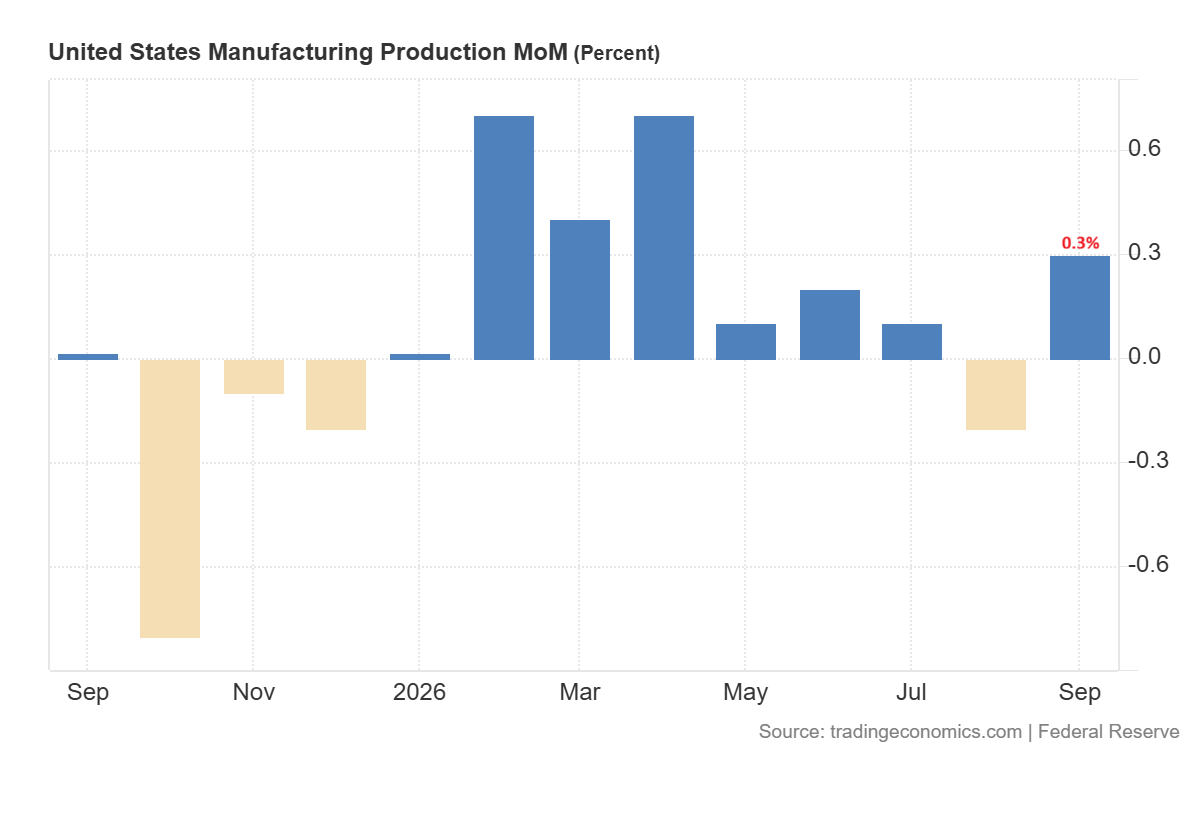
The manufacturing sector offers more cautious signal. The chart below shows that the factory output increased by 0.3% in September, while the growth slowed to a 0.7% annualized pace in Q3. This mix of data suggests that the economy is still growing, but the growth in manufacturing remains slow.
The earnings provided the Dow Jones another source of support. The Travelers Companies, Inc. (TRV) reported the Q3 core earnings of $9.18 a share on Friday. This is up from $8.14 a year earlier. The record investment income supported the result while share buybacks also lifted earnings per share.
In my view, the outlook for Dow Jones will further improve if the profits spread across more companies and tariff relief supports cost containment. But persistent energy inflation and weaker company guidance would increase the risk of another pullback.
Dow Jones Technical Analysis: 50,000 Support and 55,000 Target
Weekly Chart: 50,000 Support Keeps 55,000 in View
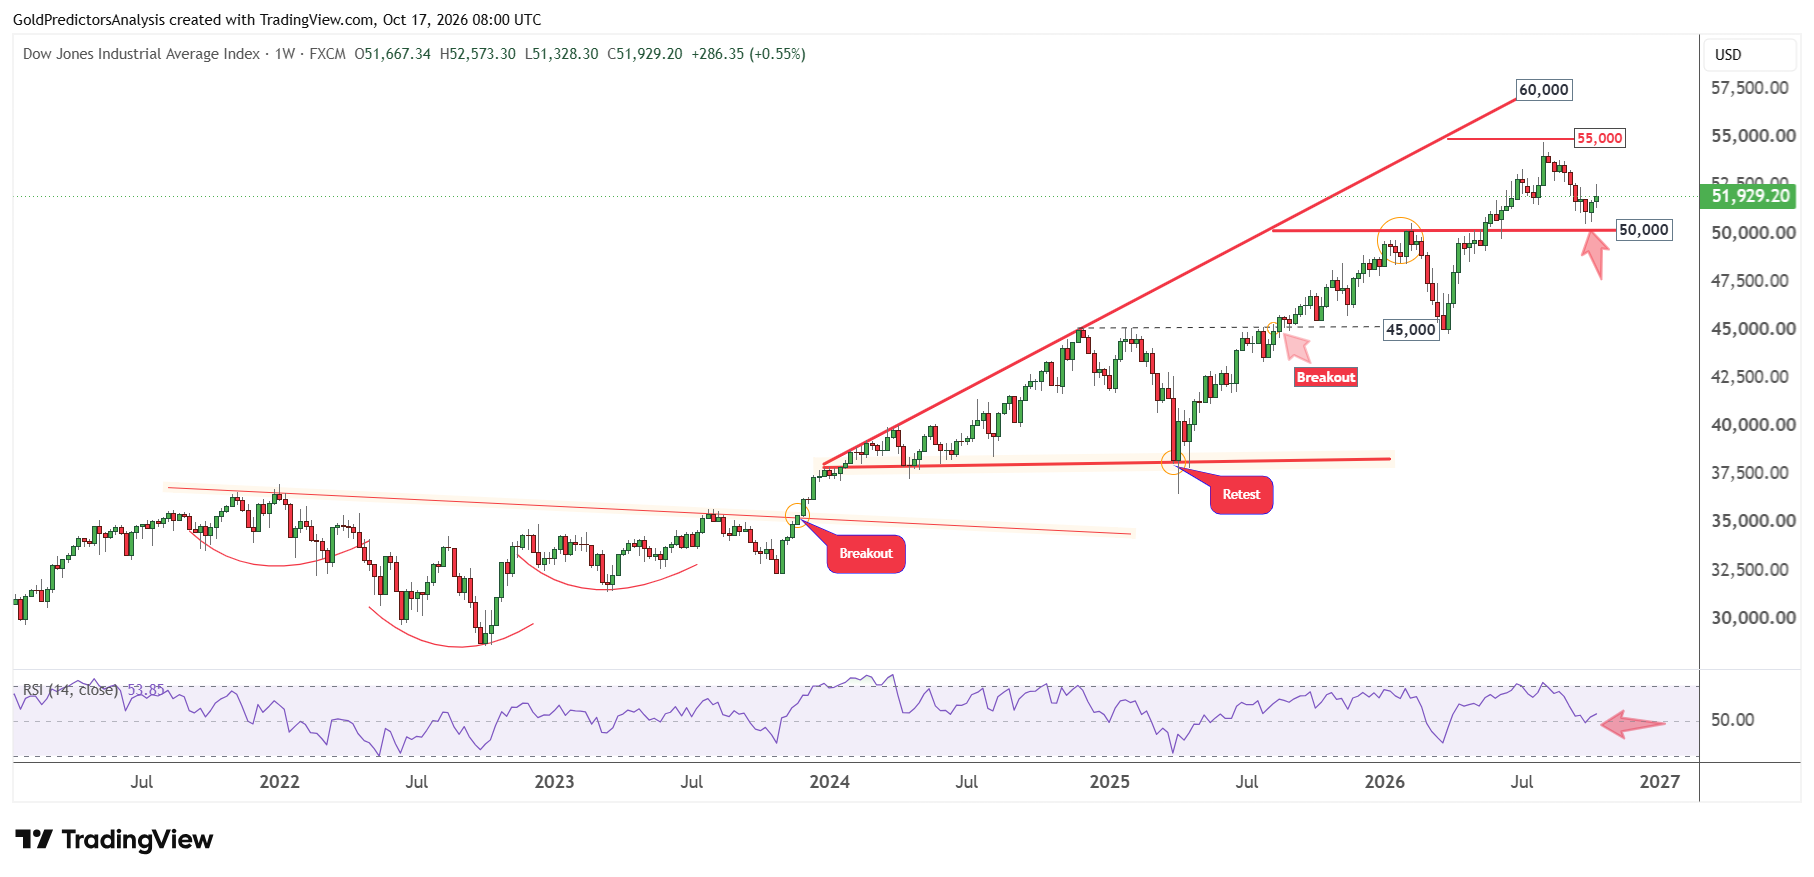
The weekly chart for the Dow Jones shows that the index has produced a low at the major support in the 50,000 area. The index produced a low at 50,507 and has rebounded higher. The RSI also produced a low at the midline, when the index produced a low at support in the 50,000 zone.
This suggests that if the index holds this support level, it may rally towards resistance in the 55,000 area. On the other hand, a break below 50,000 will open the way for a drop towards the 45,000 area.
Despite the correction in the index, the overall price structure remains constructive with the formation of an inverted head and shoulders pattern from September 2021 to July 2023 and ascending broadening wedge pattern from January 2026.
This suggests that if the index holds the 50,000 level, it may move towards the 55,000 area as the next target. A break above 55,000 will trigger a rally towards the 60,000 area.
Daily Chart: 52,540 Breakout Could Strengthen the Recovery
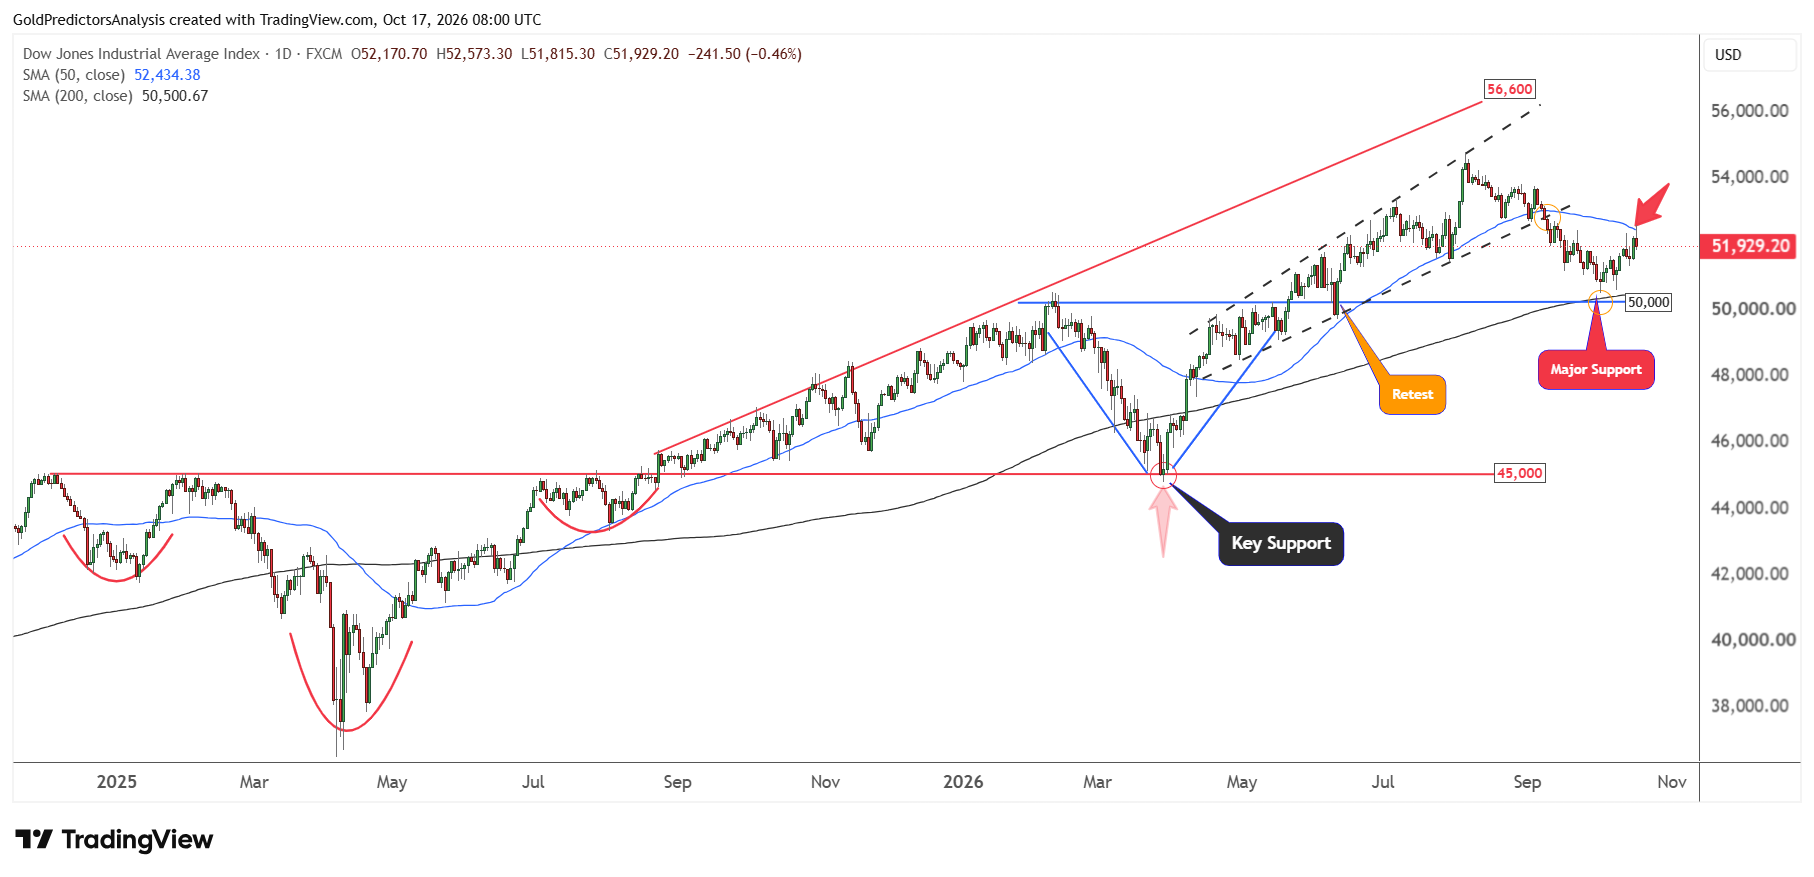
The daily chart for the Dow Jones also shows strong constructive price action. The rebound from 50,000 was triggered at the 200-day SMA, and the rally has found resistance at the 50-day SMA. The drop on Friday was exactly from the 50-day SMA in the 52,430 area. Then the index produced a bearish hammer candle.
This means that if the index continues to move below 51,390, it will likely move towards the 50,000 area. But a break above 52,400 will open the way for a rally towards 53,655 and then the 55,000 level in the short term. The inverted head and shoulders pattern in Q1 and Q2 2025 and the V-shaped recovery in April 2026 suggest constructive price action in the index.
4-Hour Chart: 51,300 Breakdown Could Expose 50,000
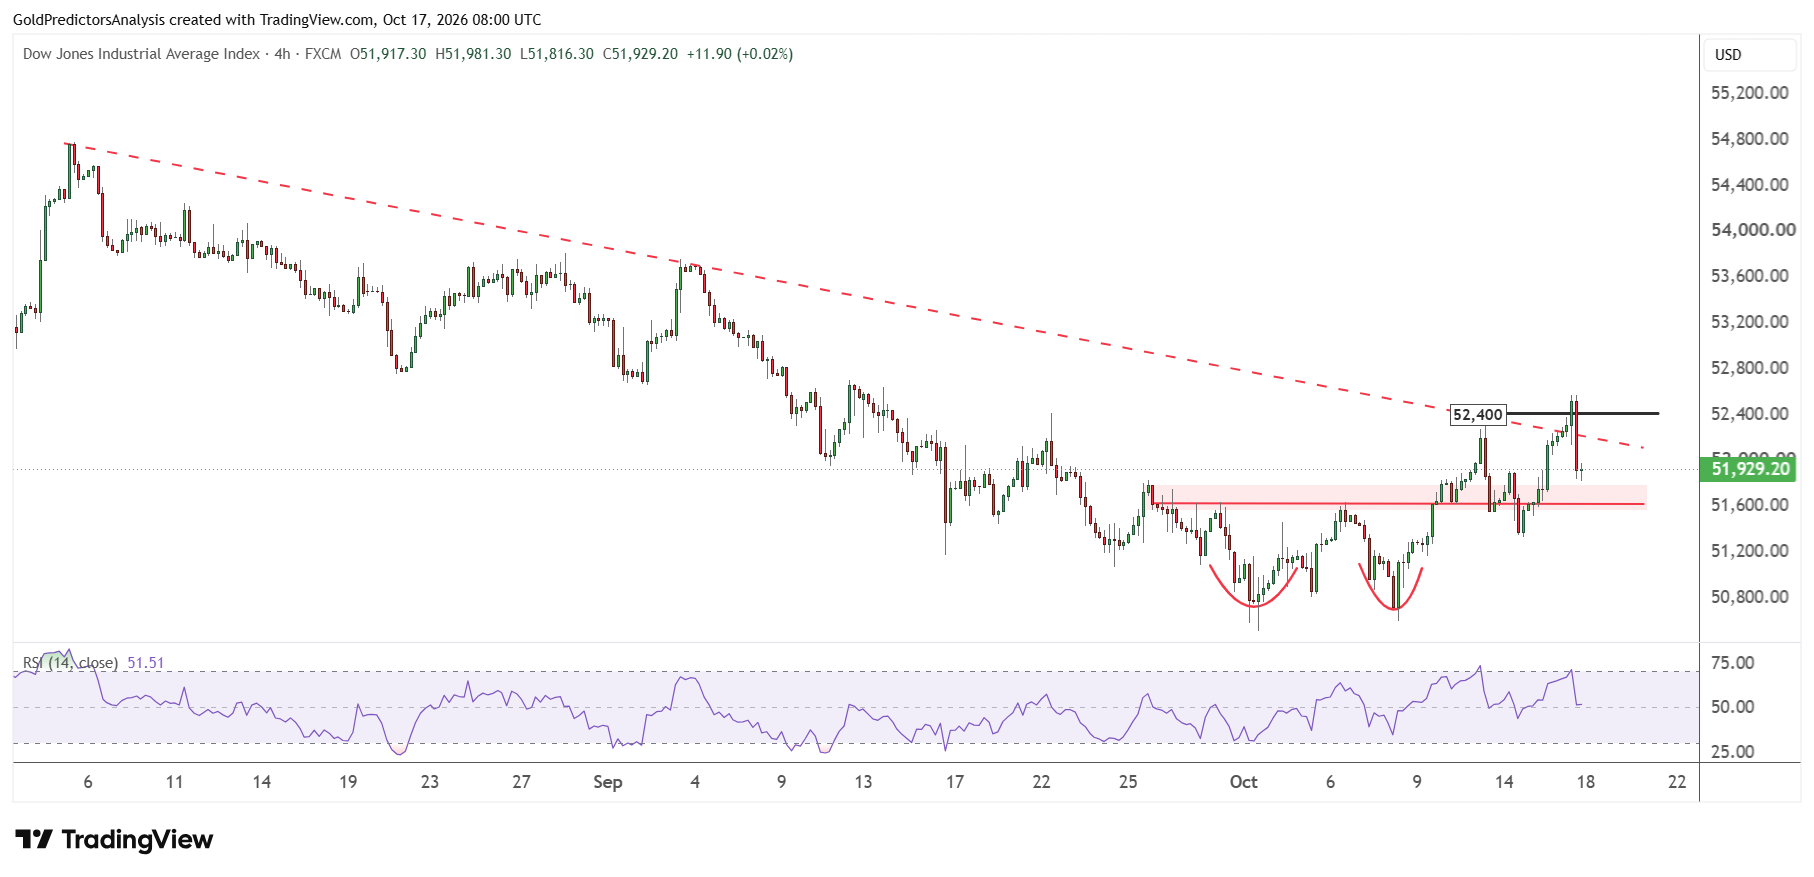
The 4-hour chart for the Dow Jones shows a negative trend in the short term. The index attempted to break above the descending trend line that stretches from the August 2026 highs, but it failed to sustain the rally and moved back below 52,000.
If the index recovers back above 52,400 again next week, it will continue the rally towards higher levels. But a break below 51,300 will suggest further downside towards the 50,000 area.
What to Watch Next
The market will watch the response to the tariff waiver by President Trump and any progress in the trade talks between the US and Mexico. The company’s earnings will also show whether businesses can protect profits as import costs continue to increase. The low oil prices and Treasury yields could support the recovery in Dow Jones. But persistent inflation and weaker earnings guidance could limit further gains.
The Dow Jones needs to clear the 52,400 area to strengthen the rebound. A clear break above this zone could open the way towards 53,655 and then 55,000. A drop below 51,300 would increase the risk of another test of 50,000. In my view, the broader outlook remains constructive as long as the major support of 50,000 holds. A break below this support could bring the 45,000 area into focus.