
The Dow Jones Industrial Average rebounded on Friday from the key support zone as investors looked for the bank earnings and US inflation data. The index has recovered from the key support of 50,000, but high oil prices and costs of borrowing could limit further gains. Trump’s unresolved trade talks with Canada also leave businesses facing uncertainty over costs and investment. In my view, stronger earnings and softer inflation would provide stronger support to the index. This article discusses the latest tariff developments, main market drivers and key technical levels that may shape the next move in Dow Jones.

Trump Tariffs: Canada Talks and Refunds in Focus
The US was firm in trade talks with Canada on October 8. US Trade Representative Jamieson Greer said that senior officials were in regular contact, but Washington had not changed its position. He said that the US was still ready to negotiate, but his comments gave no clear sign that tariff relief was close.
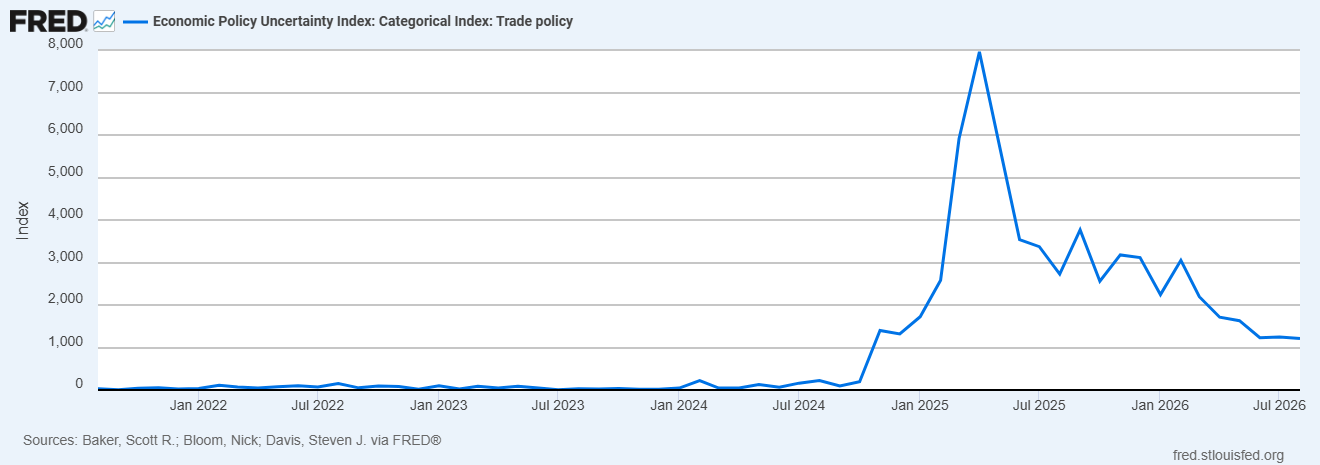
This uncertainty could delay the investment and make it harder for companies to plan their costs. A deal could ease this pressure but the market needs to see clear progress. The chart below shows historical uncertainty around US trade policy and provides context for the unresolved negotiations.
The Trump administration also widened cooperation on manufacturing trade policy. The US and 14 other economies announced joint effort to address excess production in key industries. The sectors include electric vehicles, batteries, chemicals, semiconductors and solar panels.
This initiative could lead to coordinated measures that support domestic producers. But the additional trade barriers could increase sourcing costs for companies that use imported parts. The statement announced cooperation without setting new tariff rates.
Tariff refunds offered a more positive development. The US Court of International Trade certified a class of importers seeking refunds of duties collected under the emergency powers of Trump. The class covers importers that paid those tariffs and have not filed their own refund lawsuits in court.
Repayments over time could improve cash flow and give affected businesses more room to invest. But the decision sets no immediate payment date. The benefit to earnings will depend on when eligible businesses receive the cash.
Dow Jones Price Forecast
Every new Dow Jones analysis as it publishes, today's technical signal and key levels, live price — on one page.
See all Dow Jones forecastsDow Jones Fundamentals: Inflation and Earnings Shape the Outlook
High Oil Prices and Inflation Risks Challenge the Recovery
Energy prices remain a major risk to the Dow. Brent oil settled at $107.24 a barrel on Friday, while WTI oil closed at $93.09. Hurricane Isaias prompted companies to shut more than 70% of production of crude in US Gulf waters.
The comments by Trump about productive talks with Iran had pushed oil lower earlier in the session, but the risk of supply lifted prices again. The persistent fuel costs could squeeze industrial margins and household budgets. The sustained drop in oil prices would ease that pressure.
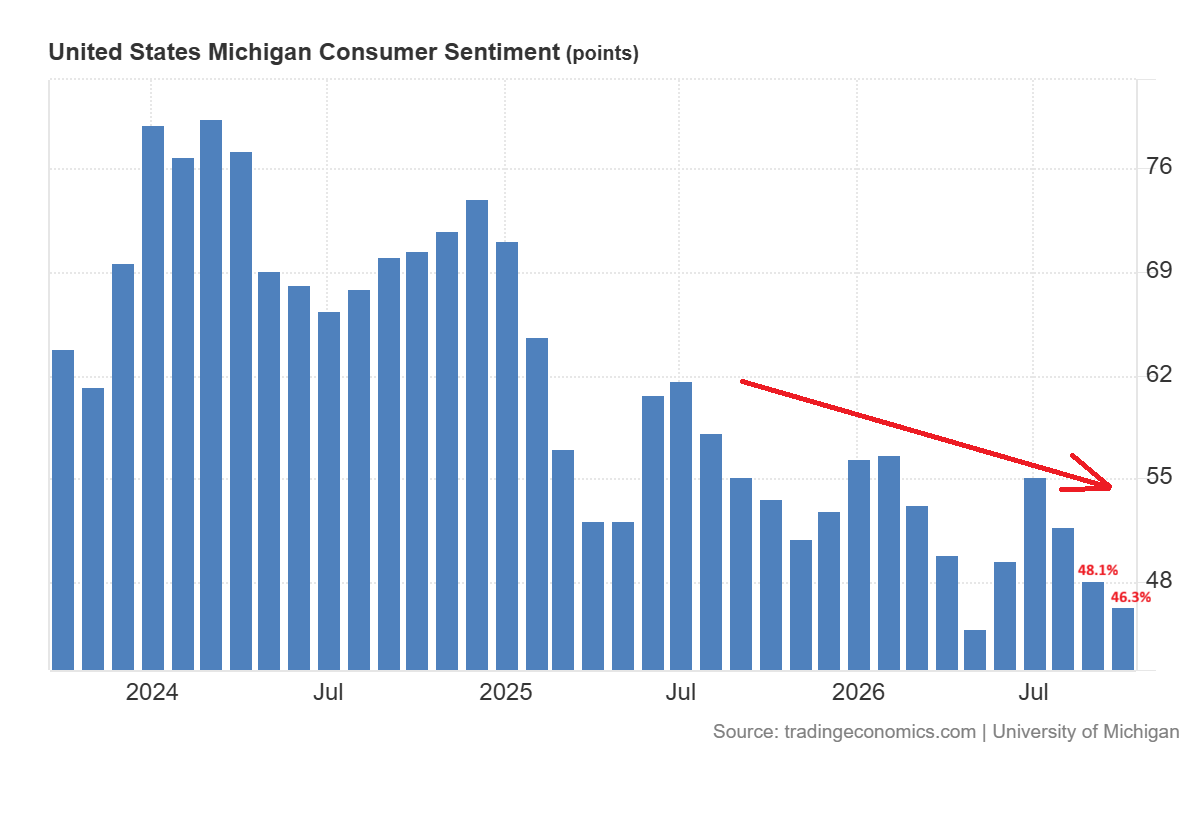
The consumer survey on Friday added to the concerns of inflation. The preliminary sentiment index by the University of Michigan dropped to 46.3 in October from 48.1 in September.
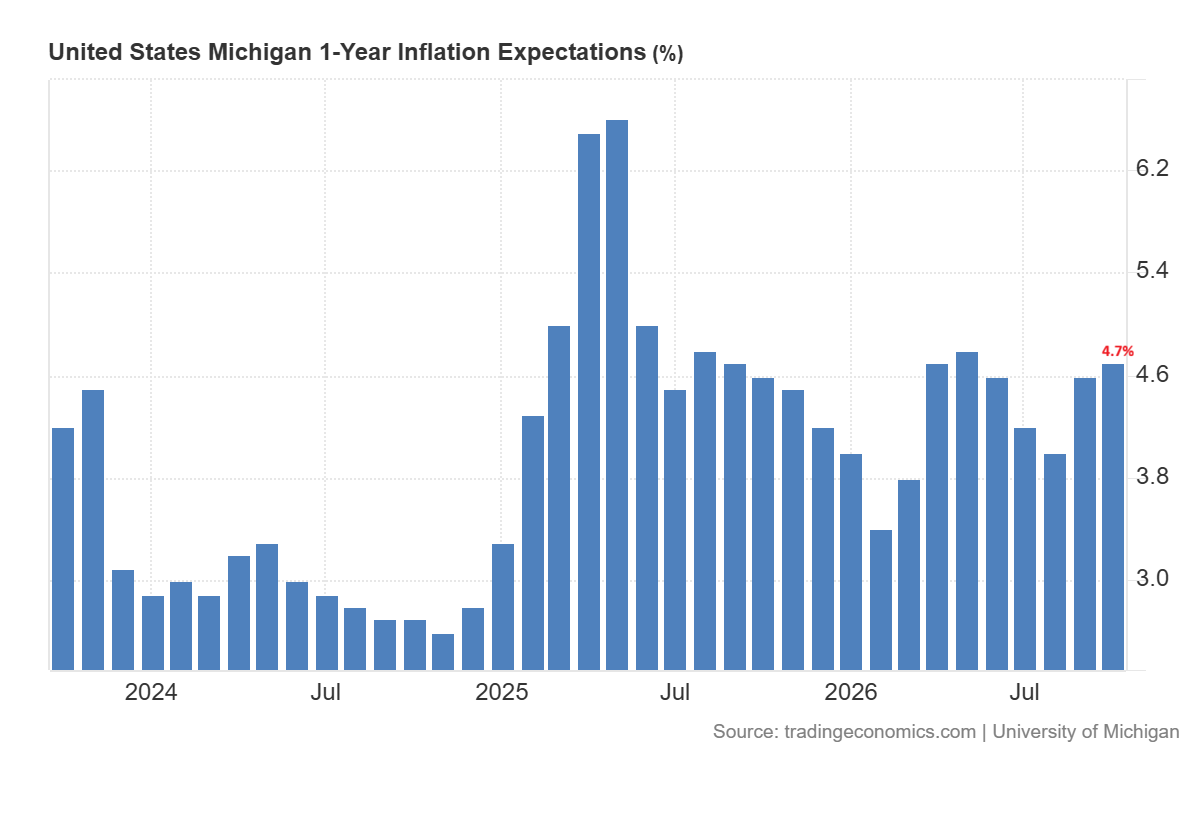
Consumers also increased their expectations for inflation over the next year to 4.7% from 4.6%. High prices and borrowing costs weakened the conditions for buying durable goods.
This creates a difficult mix for the consumer businesses of Dow. The demand could soften while costs remain high. The Fed minutes released on October 7 also showed that most officials saw another increase in interest rates likely before the end of the year.
Apple and Verizon Weaken Ahead of Bank Earnings and CPI
Verizon Communications (VZ) dropped nearly 10% on Friday after SpaceX announced a spectrum acquisition that could strengthen the mobile services. The deal still requires regulatory approval, but investors reacted to the threat of stronger competition.
Apple Inc. (AAPL) also dropped nearly 1% after a report that said the company had asked some suppliers to cut the production of components for the latest premium iPhones. The weakness in some of the major stocks limited the rebound in the Dow Jones. The index needs support from several sectors to extend its recovery.
The next major test comes from earnings and inflation data. JPMorgan Chase & Co (JPM) and Goldman Sachs Group Inc. (GS) will release their Q3 2026 earnings on October 13. The CPI data for September will be released on October 14. Their results will help investors assess profits and the effect of higher rates on customers.
The 10-year Treasury yield ended Friday near 5.24% that keep the costs of borrowing elevated. The strong earnings and softer inflation could support gains in the Dow. The disappointing data or renewed price pressure could weaken confidence and bring further Fed tightening back into focus.
Dow Jones Forecast: 50,000 Support Puts 55,000 in View
Short-Term Development: 51,800 Breakout Could Strengthen the Recovery
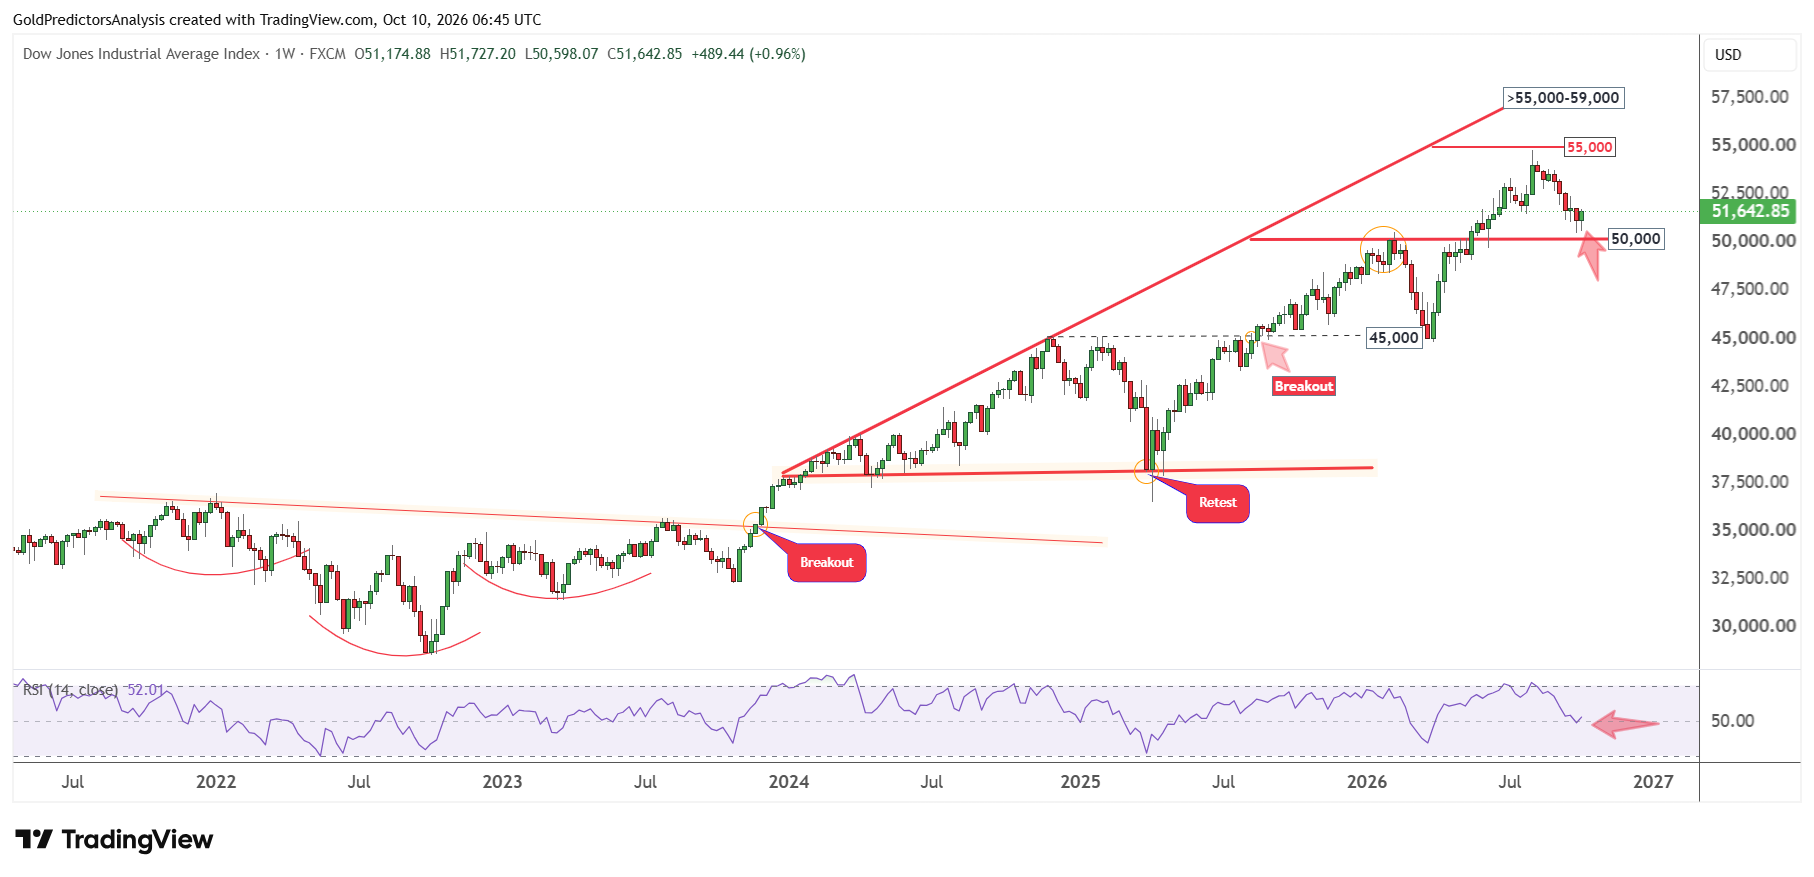
From a technical perspective, the Dow Jones has hit the significant support near the 50,000 level and produced a positive candle last week. The weekly candle is an inside bar candle, which points to a reversal in the Dow Jones market.
A break above the 51,800 level will likely initiate a strong rally in the Dow Jones towards the 55,000 area. On the other hand, a break below 50,000 will suggest a deeper correction towards the 45,000 level.
The emergence of inverted head and shoulders patterns from September 2021 to July 2023 and then the broadening wedge formation from January 2024 suggest positive price action in the Dow Jones market. Moreover, the RSI is turning from the mid-level, which suggests that the Dow Jones may show strength during the next few weeks.
Short-Term Development: Key Resistance at 52,400–52,650
The daily chart for the Dow Jones also showed that the index has hit the major support level near the 50,000 area. The low was formed at 50,507 on 1 October 2026, and then the price reversed higher to close the week at the 51,642.85 level.
The immediate resistance now remains the 50-day SMA at 52,650. A break above the 50-day SMA will likely trigger a strong rally towards the 55,000 area. On the other hand, the index must hold the 50,000 area to protect the bullish outlook.
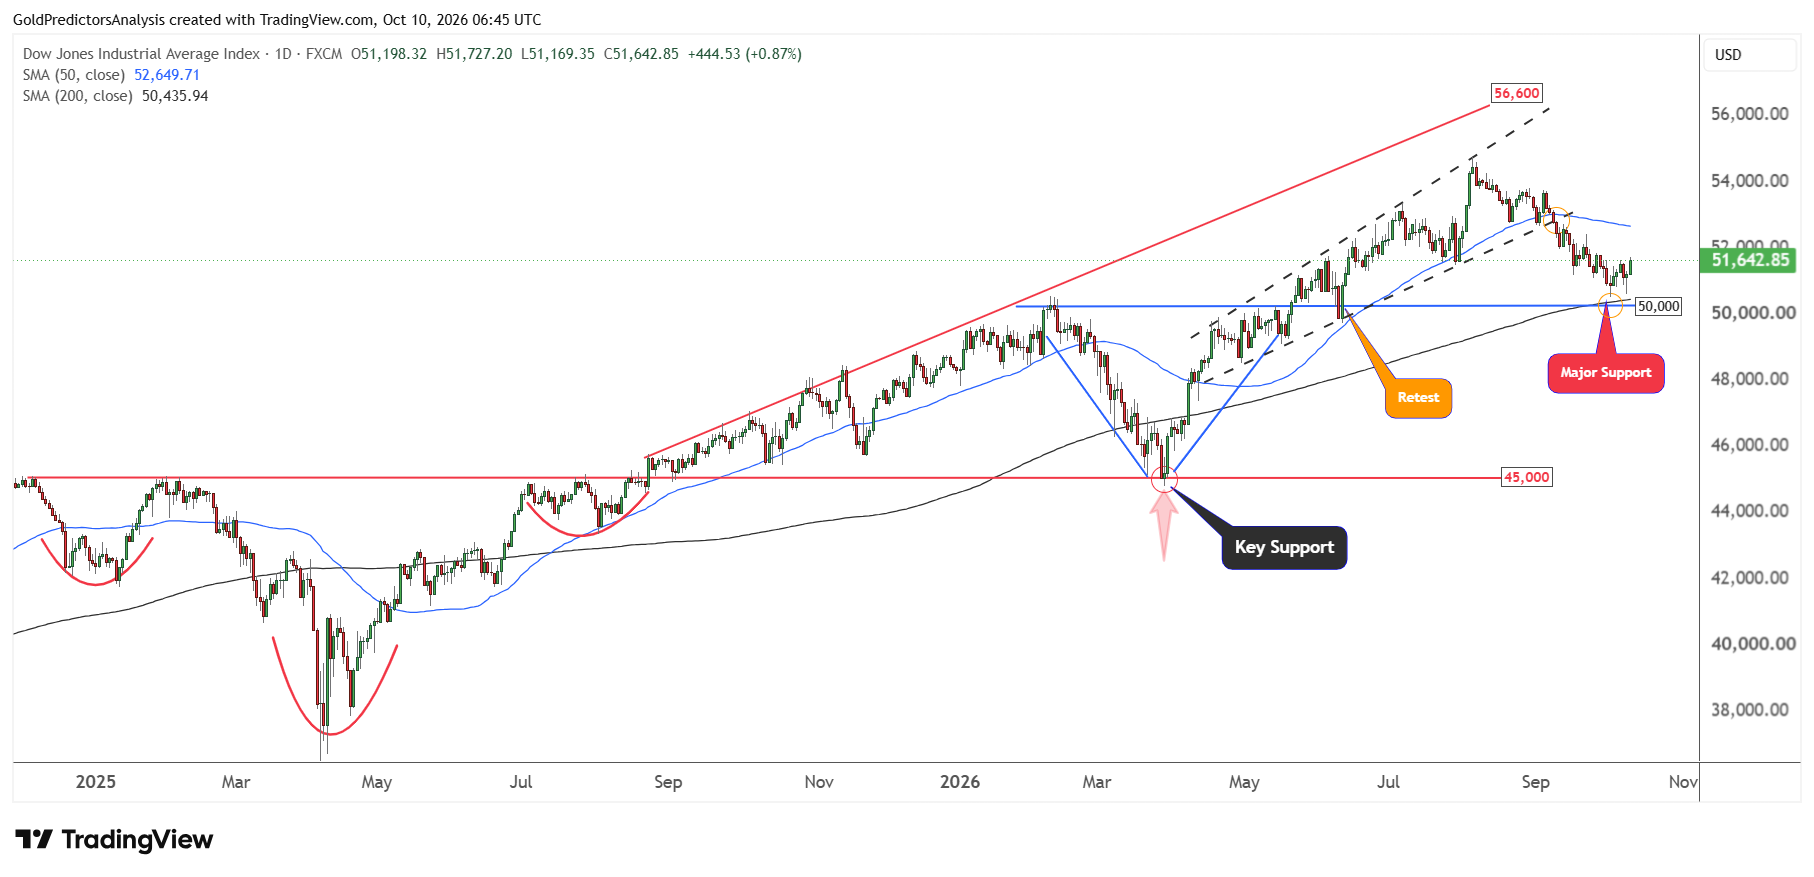
The formation of a V-shaped recovery in March 2026 and then the strong bullish trend suggest a positive movement in the Dow Jones next week.
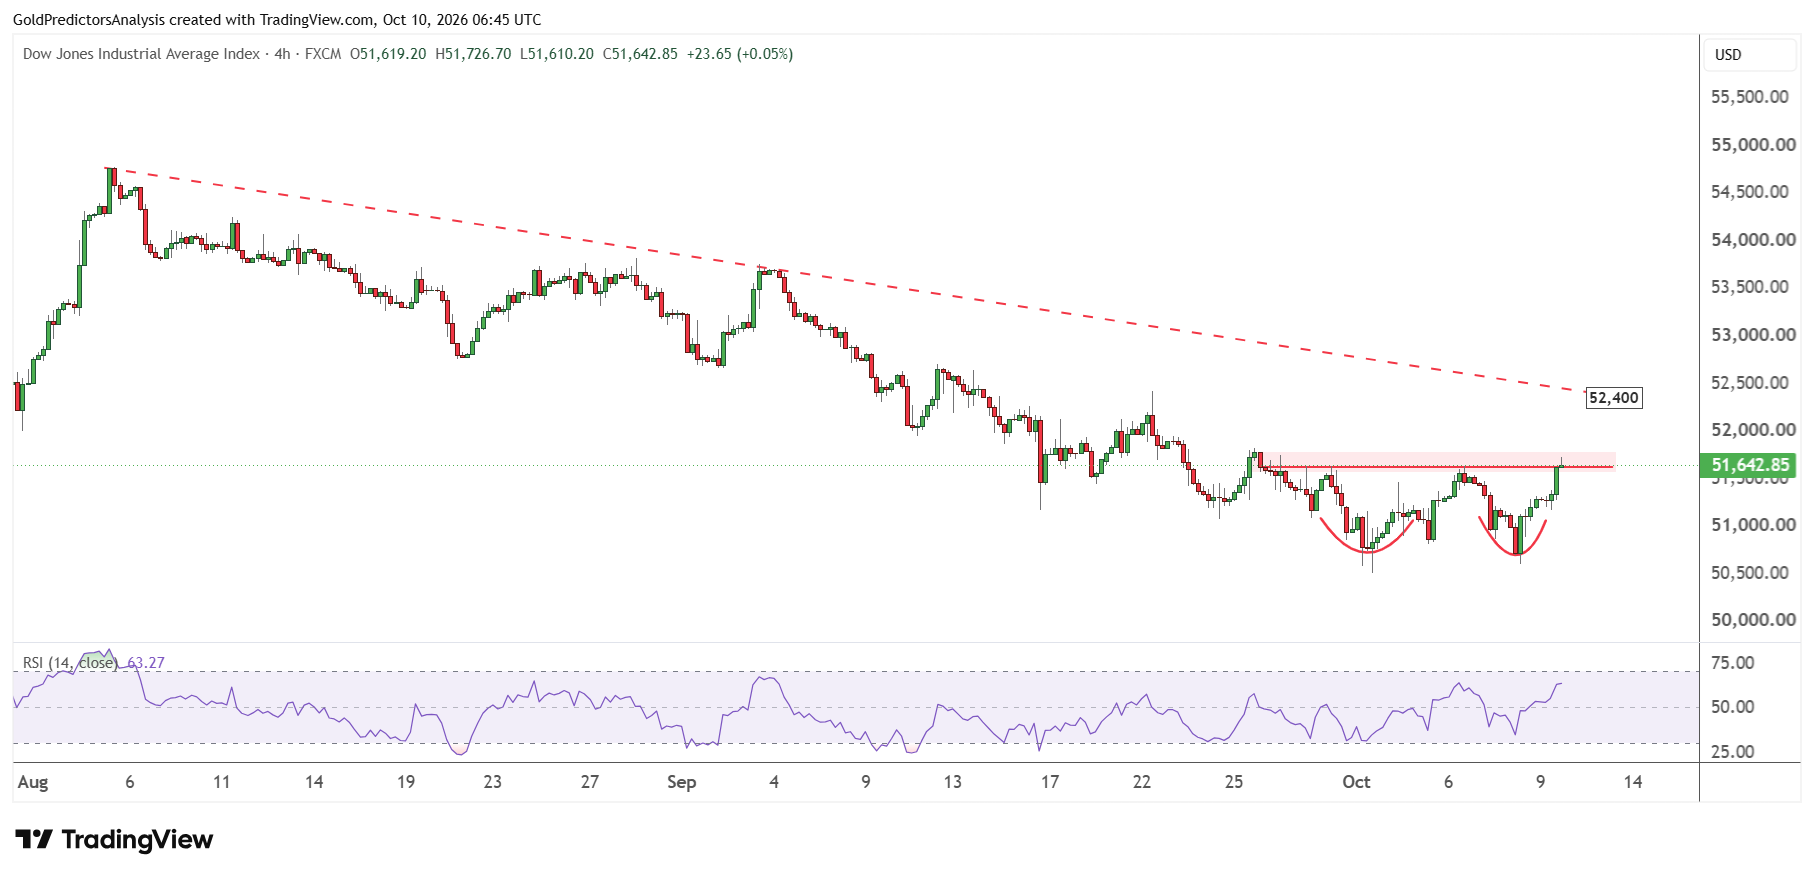
The strong reversal from the 50,000 area in the Dow Jones is also highlighted in the 4-hour chart below. The index has formed a double bottom pattern, with the first low formed at 50,507 on 1 October 2026 and the second low formed at the 50,598 level on 8 October 2026.
The index is now attempting to break the neckline of this double bottom at 51,785. A break above this neckline will likely push the index towards the key resistance at the 52,400 level. This key resistance is defined by the descending trend line that stretches from the 5 August 2026 highs. A break above 52,400 will confirm a bottom and trigger a strong rally in the Dow Jones.
What to Watch Next
The next earnings and inflation reports could shape the recovery in the Dow. Strong profits would support confidence, while softer inflation could ease pressure for the rate hikes by the Fed. However, high oil prices could keep the costs of business elevated. The unresolved tariff talks may also delay investment. The recovery in Dow Jones needs stronger earnings and clear signs that cost pressures are easing.
The technical outlook remains constructive as the Dow stays above 50,000. A break above 51,800 would strengthen the recovery, but resistance at the zone of 52,400-52,650 could slow further gains. A break above these levels could open the way towards 55,000. On the other hand, a break below 50,000 would weaken the bullish structure and increase the risk of a deeper correction towards 45,000.
Read more: Tech Rally Puts 8,000 in View for S&P 500 Despite Fed Risks