The S&P 500 remains close to record highs as technology stocks continue to lead the rally. The breakout above 7,800 puts 8,000 in view, but the rise in oil prices and Treasury yields creates risk for the index. The FOMC minutes kept another rate hike by the Fed on the table despite growing expectations for a pause in October. The heavy borrowing to fund AI growth also raises concerns about the cost of financing and future profits.
Inki Cho, Senior Financial Markets Strategist at Exness, commented:
AI-related demand has been an important driver of the S&P 500’s recent gains, although the market remains sensitive to developments in the bond market and expectations around Fed policy. Elevated Treasury yields could put additional pressure on companies facing higher financing costs, while upcoming earnings will be an important test of whether profit growth can support current valuations. Strong results could help sustain investor confidence, but any disappointment or renewed pressure from yields could contribute to further volatility
In my view, the S&P 500 remains in a bullish trend, but stronger earnings and broader gains across sectors are required to strengthen the outlook. This article presents the latest market drivers, valuation risks and key technical levels that could shape the next move in S&P 500.

FOMC Minutes and AI Debt Test the S&P 500 Rally
The September FOMC minutes showed that most officials considered another increase in the interest rate likely before the end of the year. The policymakers remained concerned about persistent inflation even after raising rates in September.
However, they mentioned that future decisions would depend on incoming economic data. The expectations of the rate hike in October dropped to 19.2%. This gives stocks some support because a pause in October would allow more time to assess the economy. But the FOMC minutes leave further tightening on the table.
The bond market remains the more immediate challenge. The 10-year Treasury yield touched 5.36% on Wednesday, which is the highest level since 2002. S&P 500 futures pointed to weaker start on Thursday as global bond concerns persisted. The high yields increase the cost of financing and reduce the present value of future profits. That can pressure stocks even if the Fed pauses in October.
The minutes also showed that some officials wanted better preparations for possible Treasury market stress while noting that markets were functioning smoothly.
AI spending adds another layer of uncertainty to the market. Broadcom Inc. (AVGO) and Oracle Corp. (ORCL) seek financing for the purchase of AI chips. This could support demand for Nvidia Corp. (NVDA) and other suppliers, but it also increases the exposure of the industry to high borrowing costs.
The shares of Samsung dropped after the preliminary earnings missed expectations despite the increase in sharp profits. That reaction suggests investors want results that justify the high expectations of the market. Since the major US companies will report Q3 earnings next week, their profit outlooks and returns on AI spending could shape the next move in the S&P 500.
S&P 500 Price Forecast
Every new S&P 500 analysis as it publishes, today's technical signal and key levels, live price — on one page.
See all S&P 500 forecastsS&P 500 Fundamentals: Oil, Inflation and Valuation Risks
Oil Prices and Bond Volatility Raise Market Risks
The rise in oil prices remains a key threat to the outlook. Brent oil climbed back above $104 on Thursday as attacks on Gulf shipping revived the concerns of supply. The high fuel costs can squeeze household spending and company margins. They also increase the risk that inflation stays elevated.
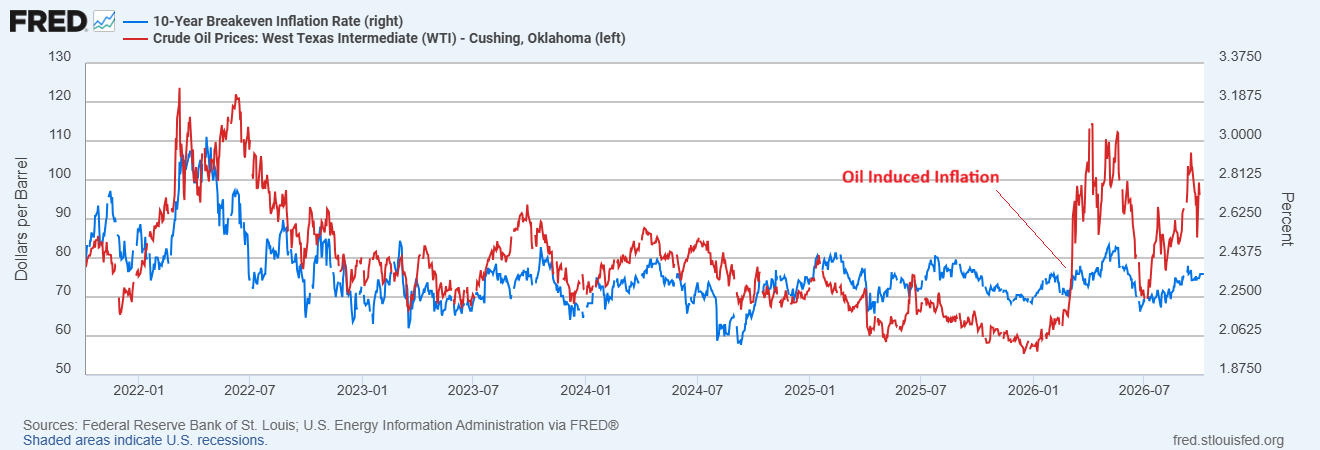
The chart below shows a close relationship between the movements in crude oil and 10-year breakeven inflation since March. The breakeven inflation measures the gap between nominal Treasury yields and inflation protected yields. But the inflation is only one driver of the cost of borrowing. The strong demand and heavy debt issuance also matter.
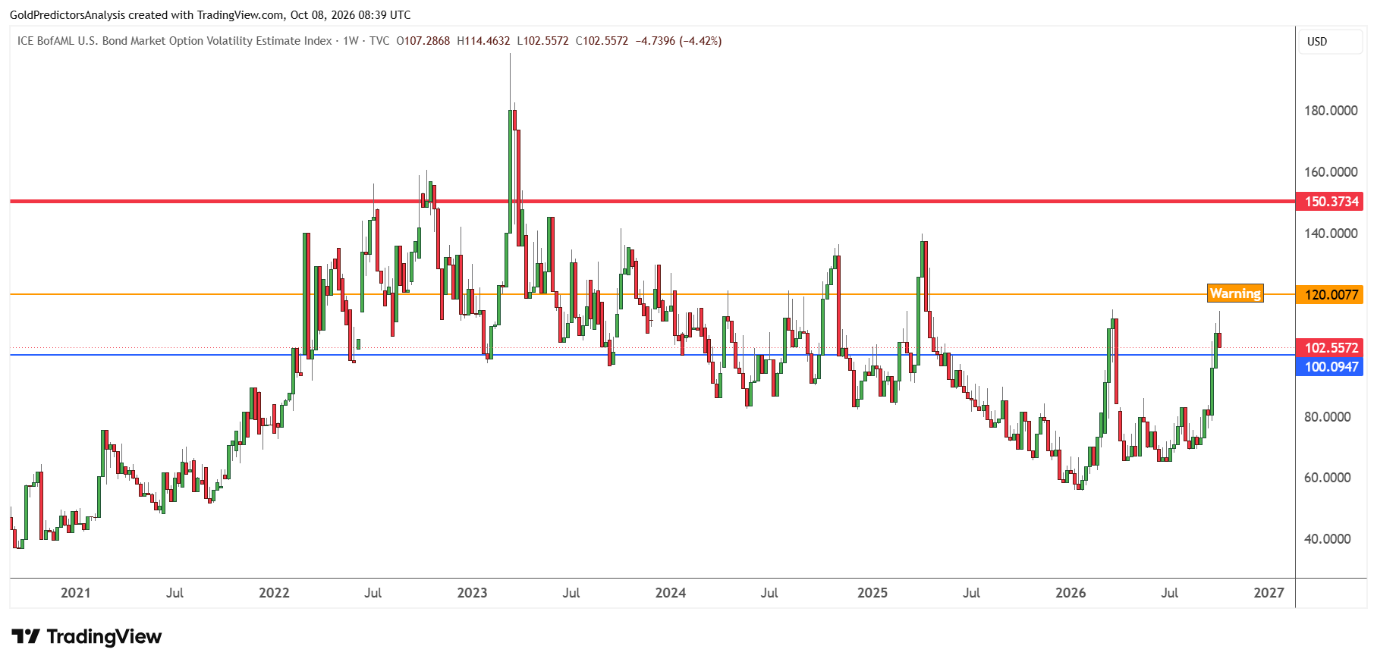
Meanwhile, the MOVE index is approaching the warning level of 120, which indicates the rise in the volatility in bonds. The increase in the bond volatility can tighten financial conditions and increase pressure on stocks.
US Jobs and Yield Curve Signals Shape the Outlook
The chart below shows that the payrolls in September increased by 29,000, down from a revised 133,000 in August.
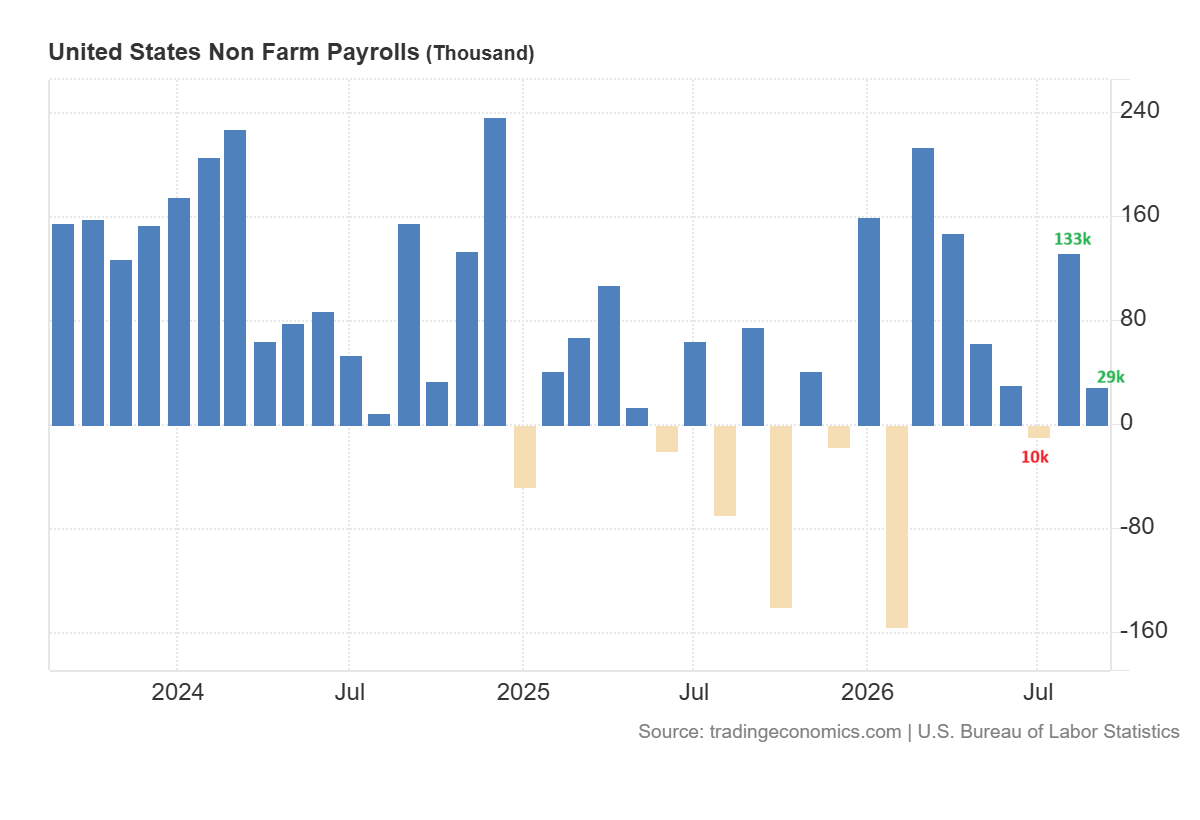
The unemployment rate in the US increased to 4.2%, while the participation rate changed little and the average workweek remained at 34.4 hours. The slow hiring gives the Fed more room to pause, but it also raises questions about future demand.
The chart below shows that the employment in manufacturing, construction and transportation remains resilient. This supports the broader economic outlook.
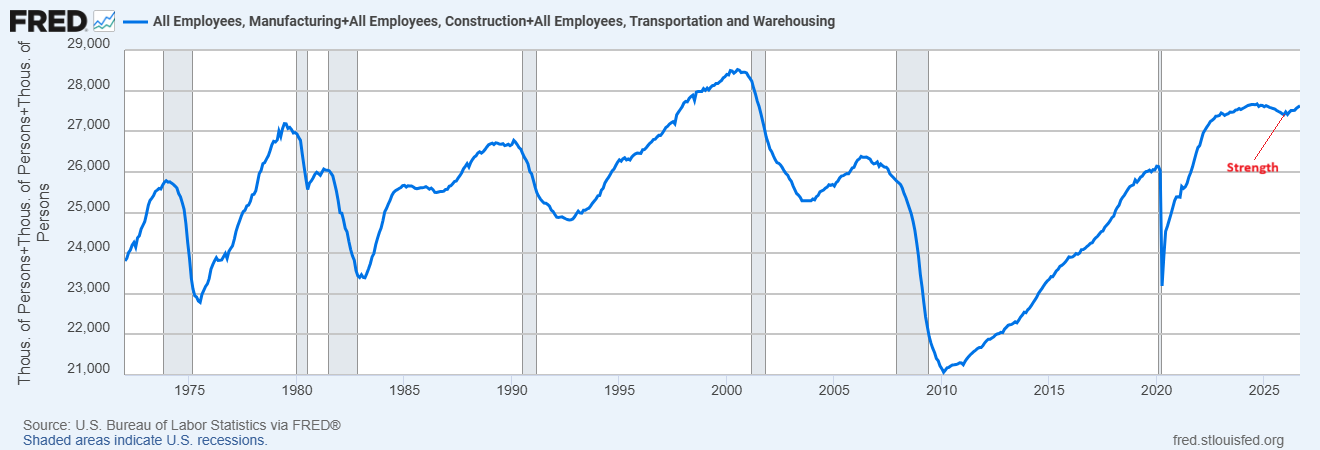
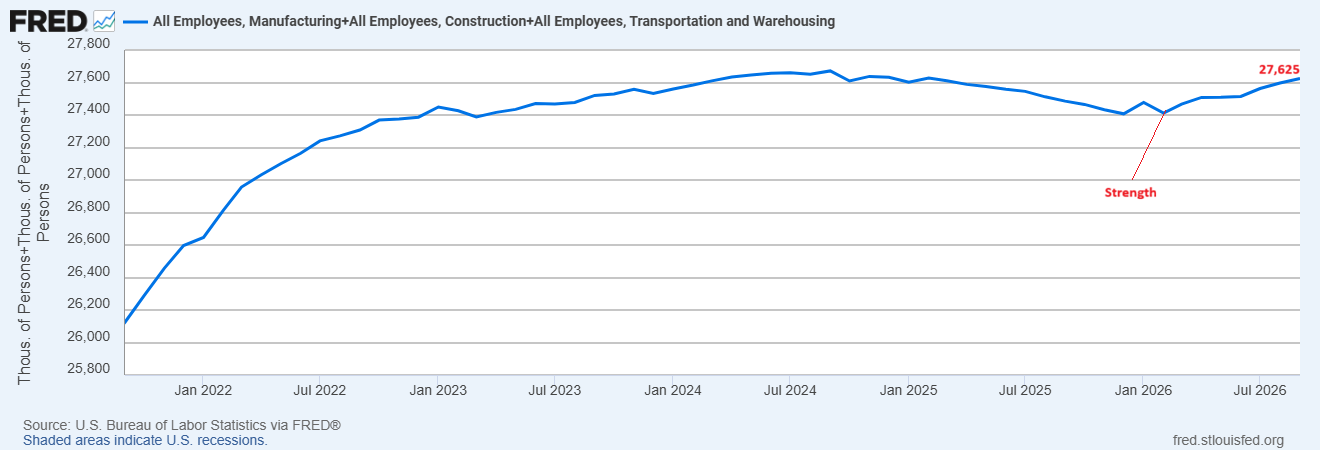
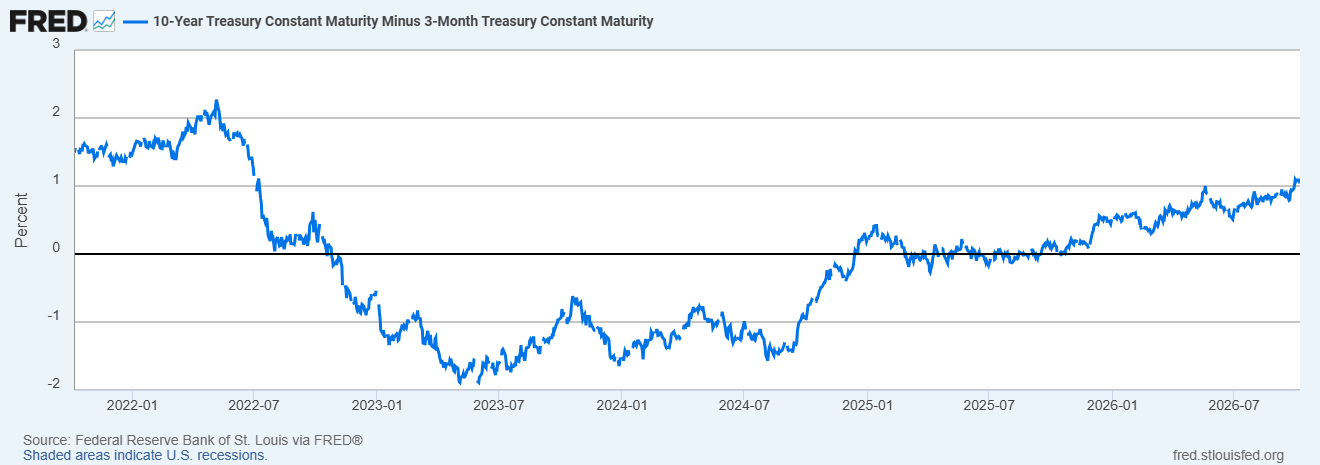
The 10-year/3-month Treasury spread has also stayed positive for more than 120 days. The S&P 500 also remains above the 12-month weighted moving average. These conditions support a risk-on signal and suggest that the broader advance remains intact despite the growing pressure from borrowing costs.
S&P 500 Valuations: Buffett Indicator and Shiller CAPE
The market breadth and valuation still warrant caution. The gains in the US stock market remain concentrated in the technology stocks, while the equal-weighted S&P 500 lost ground in September. The chart below shows that the S&P 500 Information Technology index has broken the cup and handle formation and continues to surge to record levels.
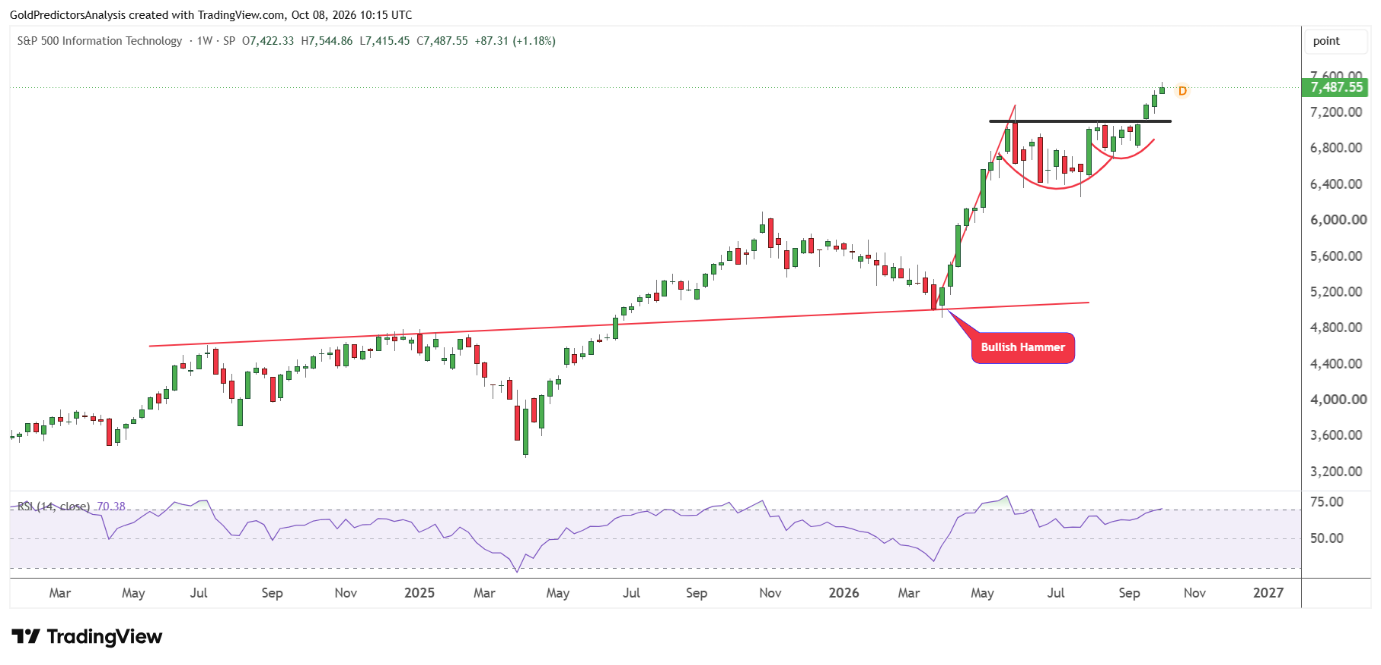
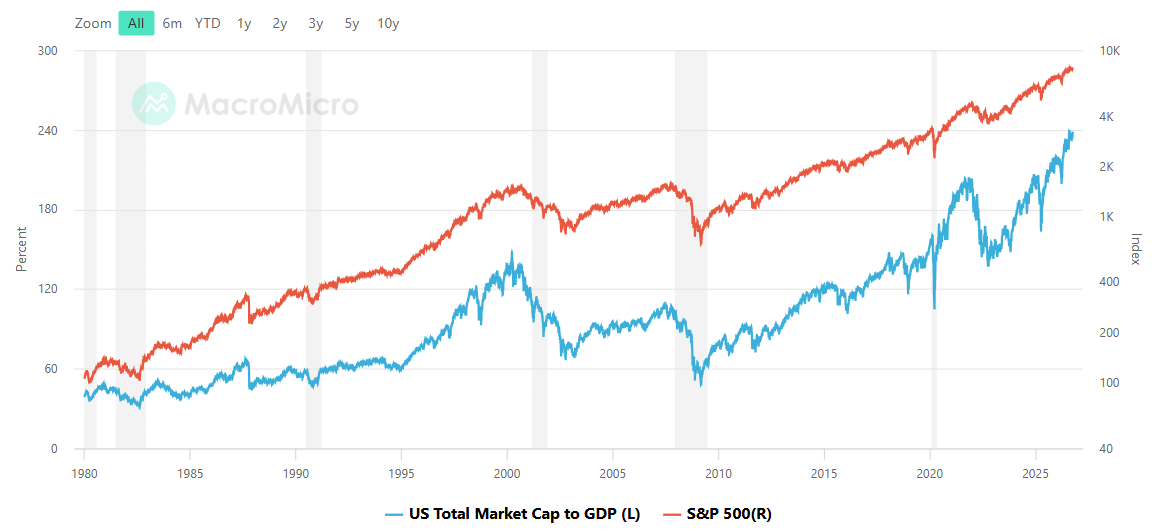
This leaves the headline index vulnerable if the biggest technology companies reverse. The valuation series puts the Buffett Indicator at more than twice its historical average. This measure compares the total US stock market value with economic output, reducing its reliance on fluctuating profit margins.
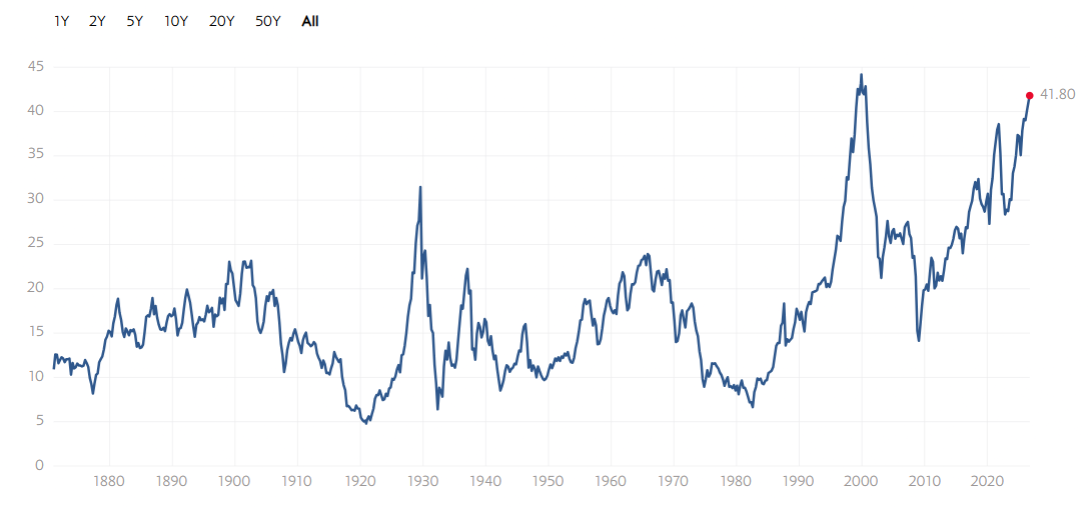
Shiller’s CAPE compares prices with ten years of inflation-adjusted earnings. It stood near 41.8, just below the 1999 peak of 44.2. These readings point to expensive stocks, but there is still no sign of a correction in the stock market as technology stocks continue to support strong momentum.
S&P 500 Technical Analysis: 7,800 Breakout Puts 8,000 in View
From a technical perspective, the S&P 500 remains in a strong bullish price structure, as seen in the daily chart below. The chart shows that the S&P 500 formed a basing pattern with an inverted head and shoulders from January 2025 to June 2025.
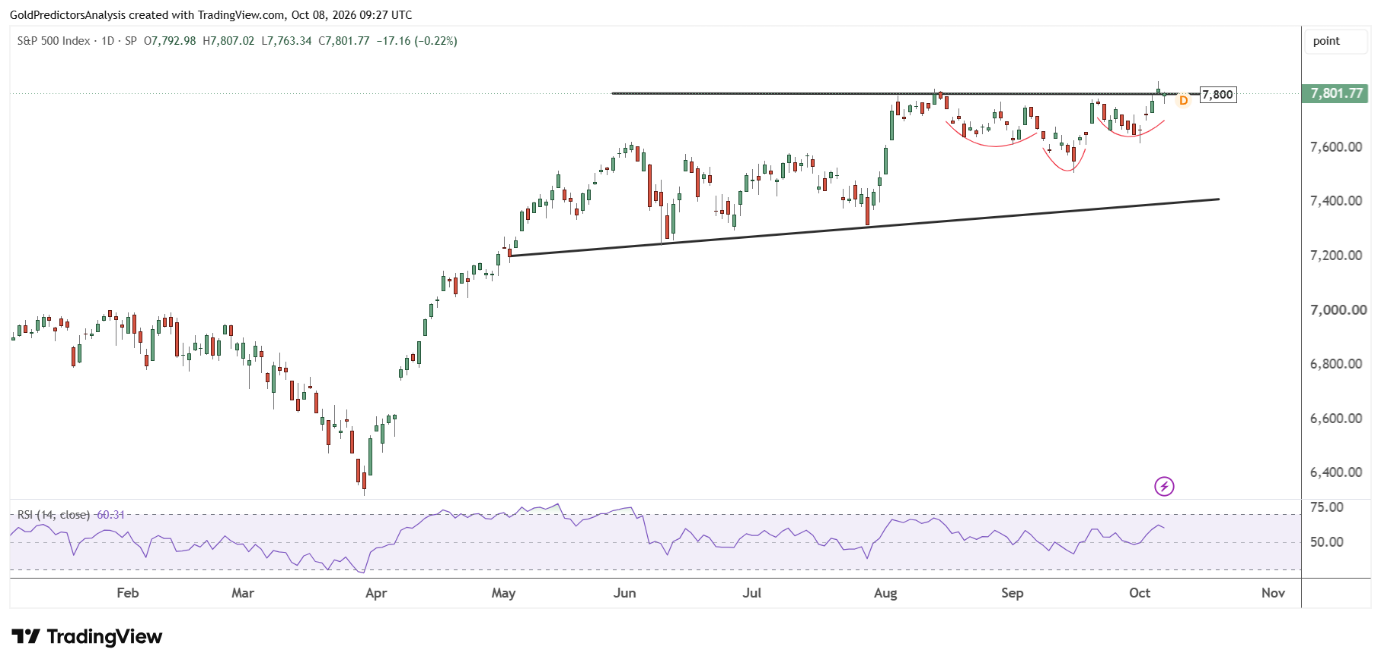
Then the index formed an ascending broadening wedge pattern. The strong V-shaped recovery in March 2026 and the price compression in July 2026 led to a strong surge in the S&P 500. The index has now broken above the 7,800 level and marked a high of 7,844 on Tuesday.
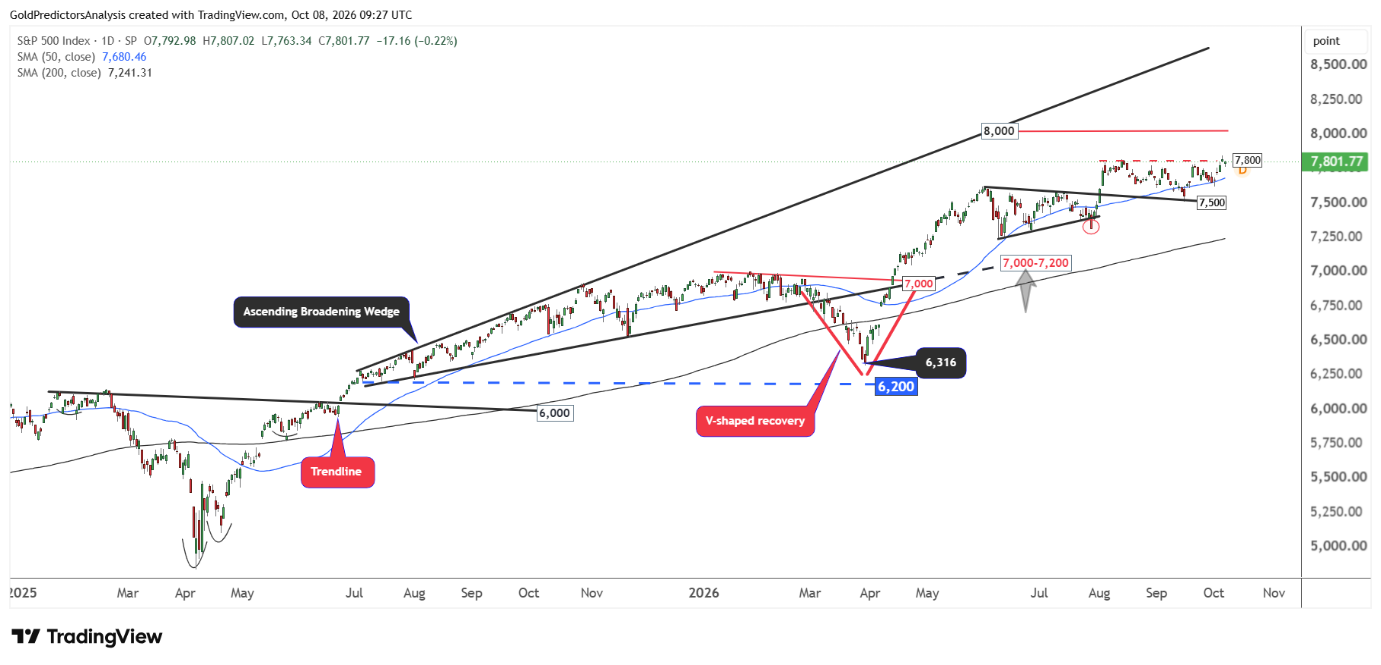
The S&P 500 is consolidating around this level, which suggests that it will likely move towards 8,000 in the short term as the immediate target.
However, a breakout above the 8,000 level is likely, which would open the way towards 8,500. The price consolidation in the S&P 500 in 2026 supports a compression and suggests a strong bullish outlook for the index.
What to Watch Next for the S&P 500
The S&P 500 remains bullish as technology stocks continue to lead the rally. The breakout above 7,800 supports a move towards 8,000. A sustained break above 8,000 could open the way towards 8,500. The recent price compression also supports this outlook. The broader strength across other sectors would strengthen the outlook and reduce reliance on a few large companies.
But the rise in oil prices and high Treasury yields could slow the rally in the S&P 500. The high cost of fuel can keep inflation elevated and squeeze margins for companies. The Fed’s pause in October offers some support, but the market still expects a rate hike in December. The market will watch earnings and bond yields to gauge the next move in the index. In my view, the S&P 500 shows bullish structure, but the valuation remains expensive. The expensive valuation leaves stocks vulnerable if profits fail to meet expectations.
Read more: SPX Eyes 8,000 Despite Fed Risks