


Rally Loses Momentum Near Session High
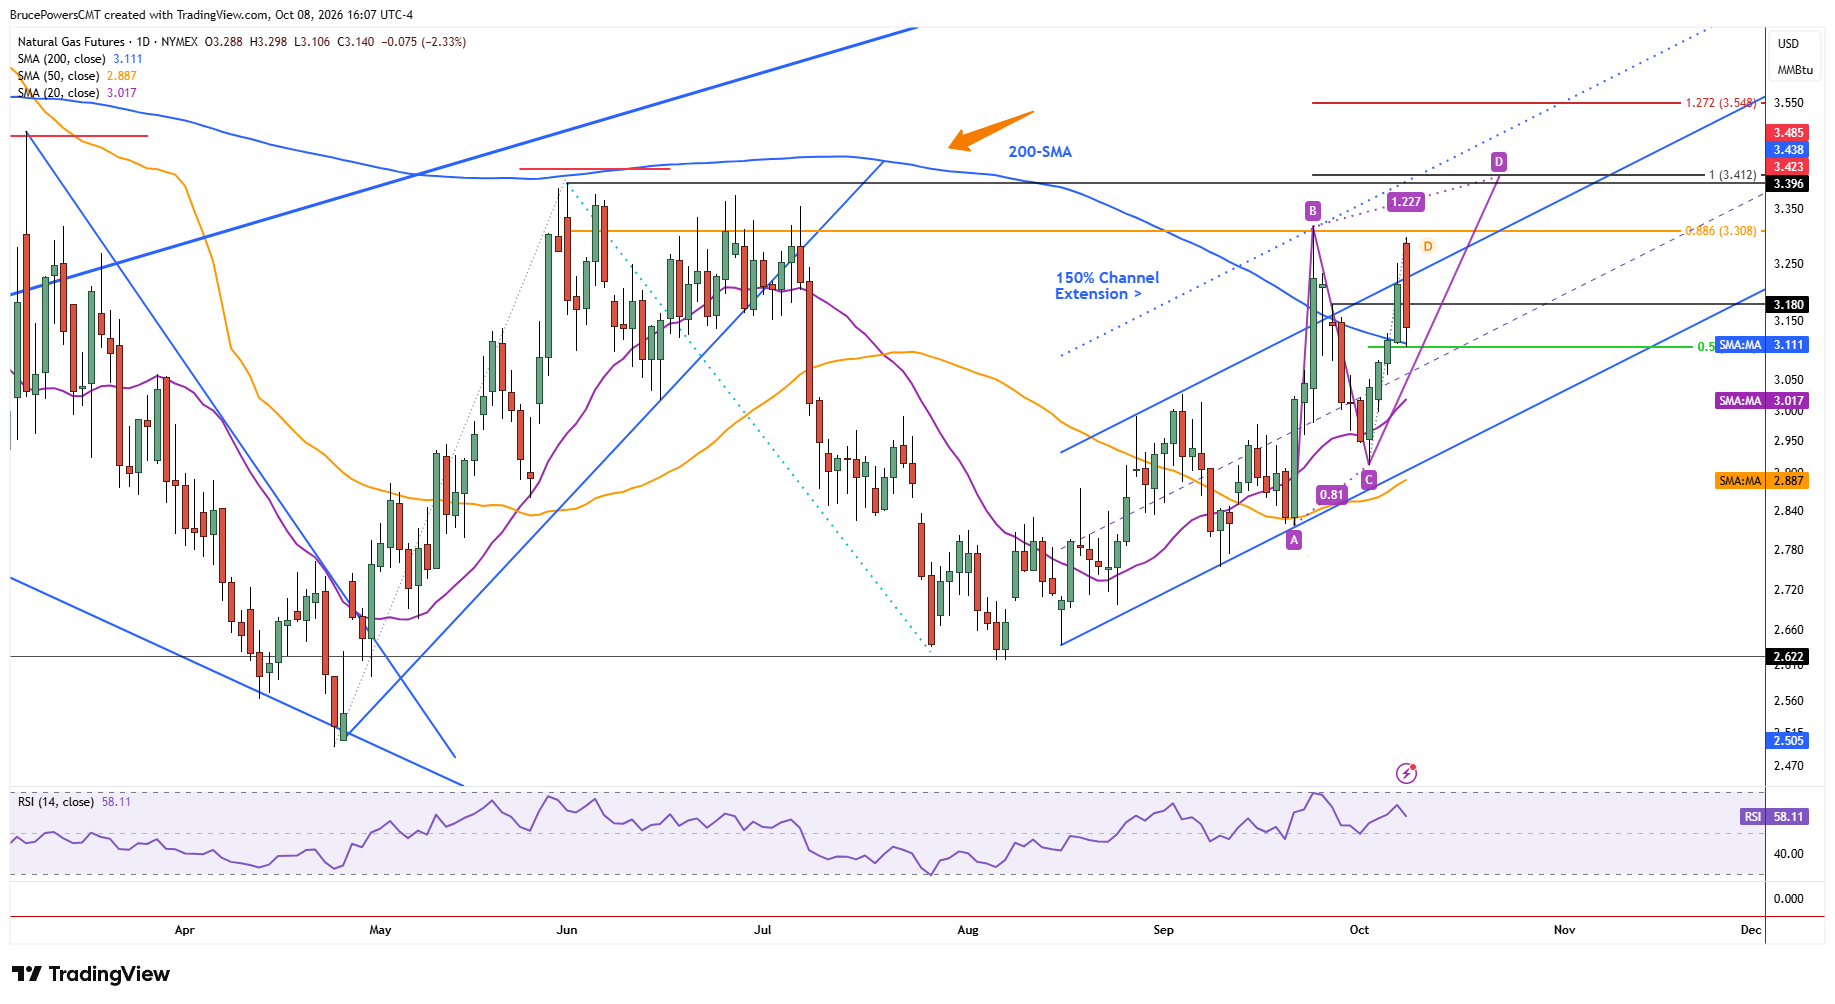
Natural gas showed signs of short-term exhaustion on Thursday after reaching a high of $3.298, earlier in the session. Sellers subsequently took back control and drove price down to a new intraday low of $3.106. That low found support near the 200-day moving average after it was reclaimed on Wednesday. The reversal shows that sellers remain capable of regaining control, but support near $3.11 is now critical to determining whether the broader advance remains intact.

Key Support Confluence Near $3.11
A sharp intraday decline followed the high, and trading remaining in the lower half of the session, suggesting additional downside pressure. Key short-term support is now Thursday’s low, especially since it is aligned with the 200-day moving average, now near $3.11, and the 50% retracement of the prior upswing at $3.105. The confluence of support adds to the significance of this area as a pivot level. A decisive break below it would increase the risk of a deeper pullback, while a successful test could help stabilize the recent advance.
September High Marks Resistance
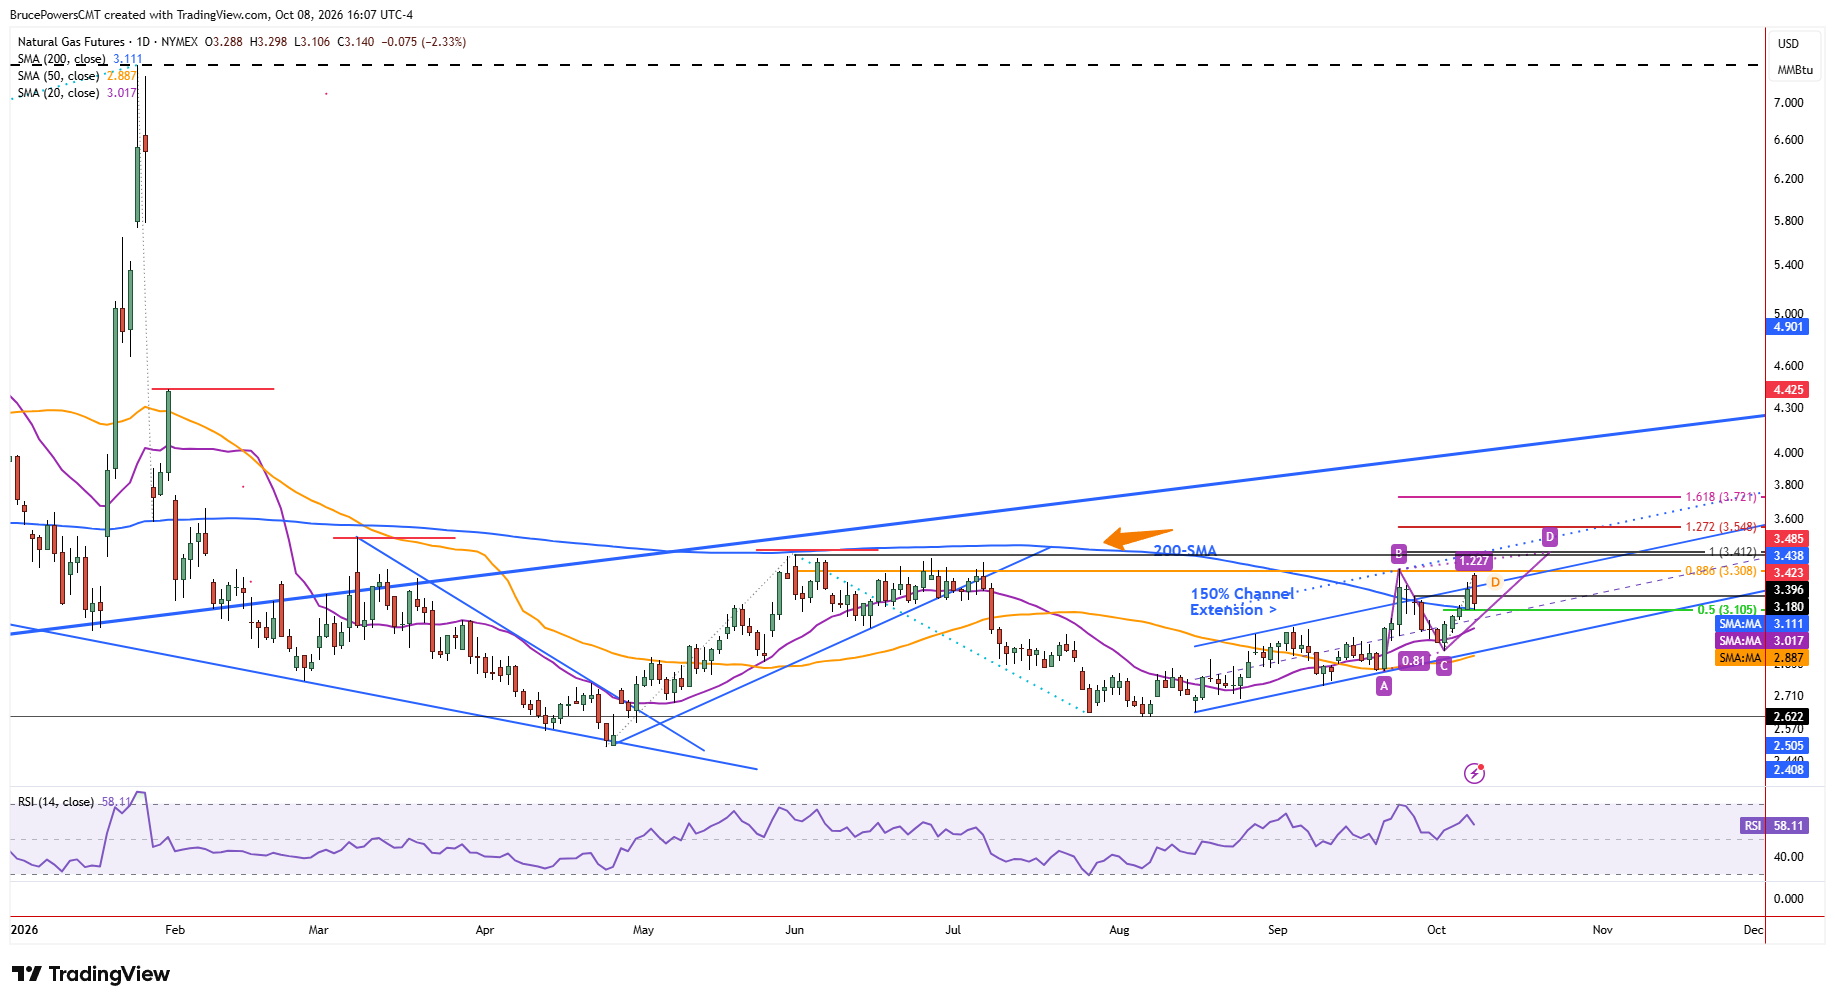
Resistance was seen at the $3.317 peak in September, which also closely aligned with an 88.6% Fibonacci retracement level of the prior decline at $3.308. The rejection of price near those levels suggests that this resistance area may continue to halt further upside, at least in the short-term. A sustained move above it would instead signal renewed strength and weaken the significance of Thursday’s intraday reversal.
Failed Breakout Shifts Near-Term Risk
The intraday bearish reversal returned natural gas to the rising channel structure, indicating a failed breakout. Once a reversal occurs from one boundary of the channel, the other side becomes a potential target. This suggests further selling pressure if natural gas breaks below the 200-day moving average or fails to quickly recover above the top boundary of the channel. That makes the $3.11 support confluence an important near-term test for the bullish structure.
Broader Breakout Structure Still Supports Bulls
A second breakout of the rising channel within a few weeks of the first, which in each case followed a rise above long-term dynamic resistance represented by the 200-day moving average, is bullish behavior. It shows the potential for further upside if a pullback or consolidation holds key support levels, including the 20-day moving average, currently near $3.02.
Natural Gas Price Forecast
Every new Natural Gas analysis as it publishes, today's technical signal and key levels, live price — on one page.
See all Natural Gas forecastsHolding above the 200-day moving average during corrective behavior would show greater underlying strength than a deeper pullback. Therefore, Thursday’s reversal does not negate the bullish structure, while support near $3.11 remains critical to whether the advance resumes in the near-term.
If you’d like to know more about how to trade natural gas, please visit our educational area.



