Falling Wedge Breakout Signals a Possible Trend Resumption
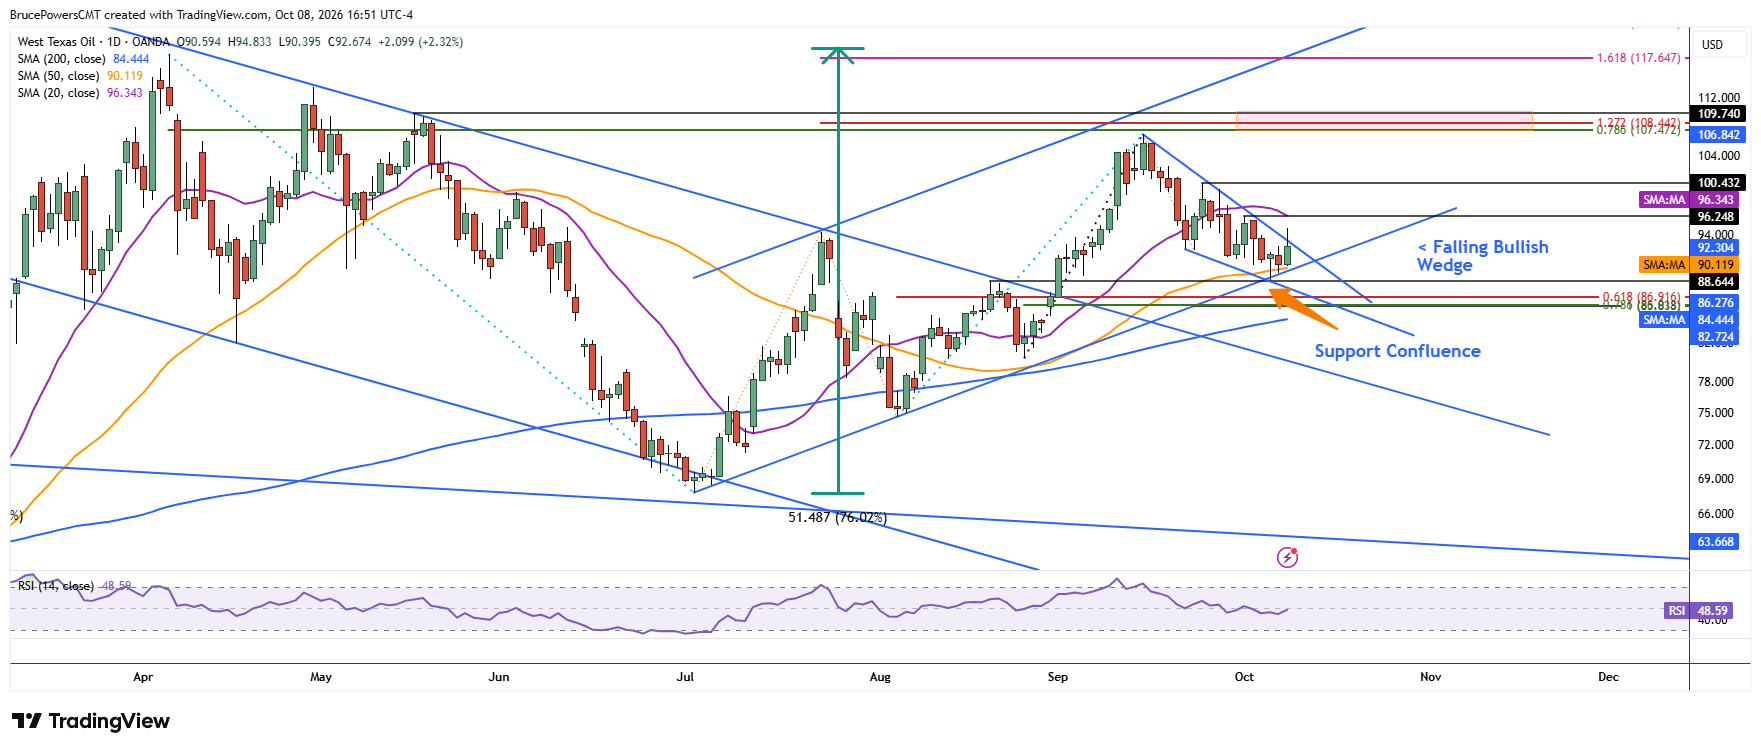
WTI crude oil triggered an upside breakout of a falling bullish wedge pattern on Thursday, signaling the possible continuation of the bullish trend and completion of the bearish correction. However, the breakout has not yet been confirmed with a daily close above Monday’s high of $93.97, which can be used as a proxy for the falling trendline marking the upper boundary of the wedge.

$88.66 Support Anchors the Bullish Structure
A higher swing low at $88.66 was established this week at the confluence of several indicators showing support, including the 50-day moving average. The 50-day average defines dynamic support for the intermediate uptrend, which corresponds with the lower boundary for a rising trend channel, reinforcing support. If strength continues to follow, crude oil will begin a third leg up in its advance that began from the July corrective low of $67.73.
$96.25 Becomes First Test on the Way Higher
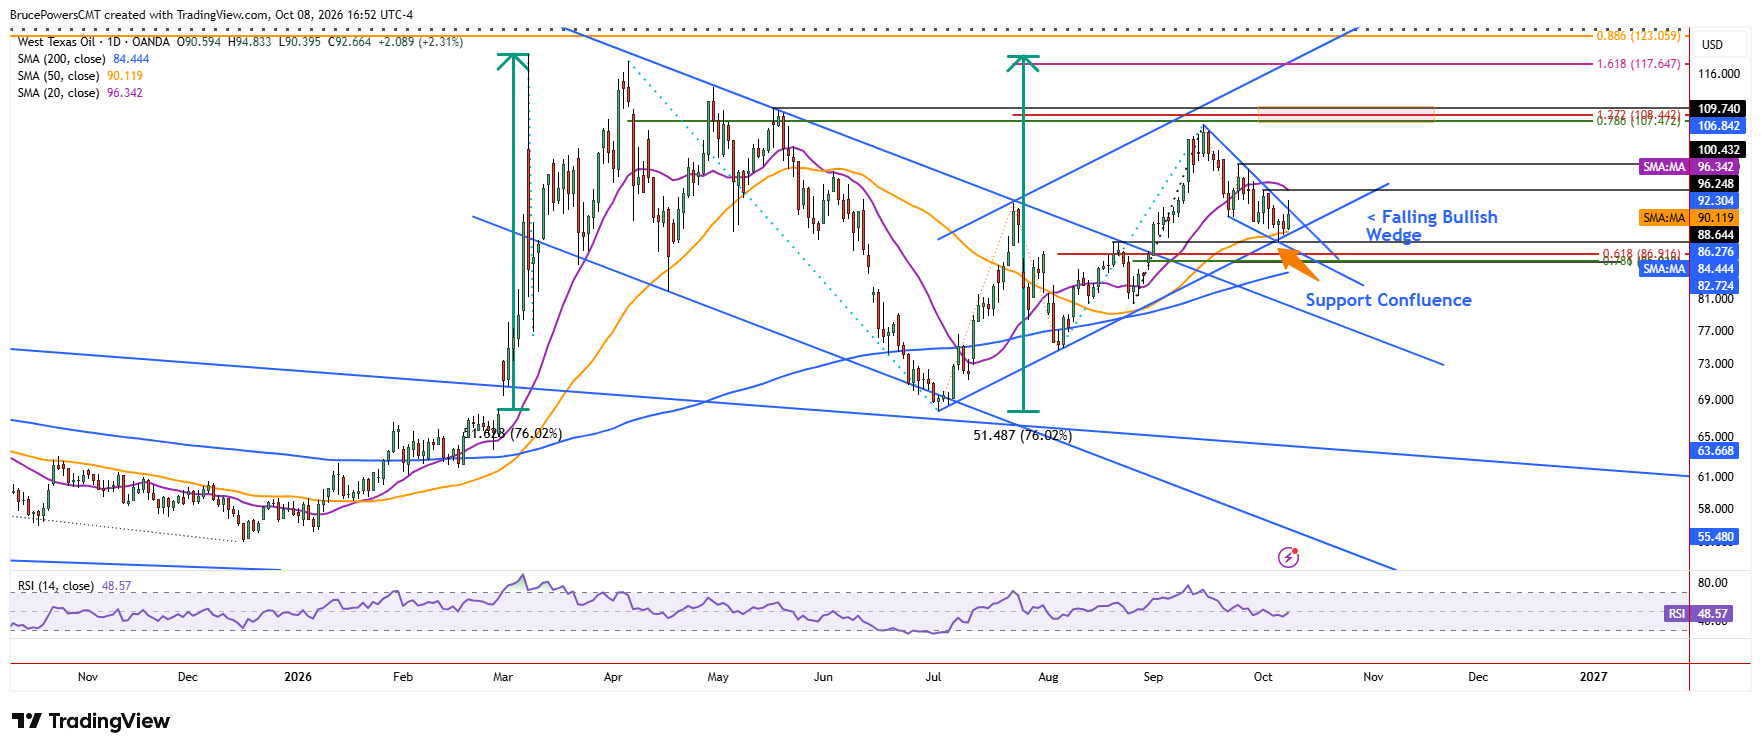
If buyers can retain control, the first key target zone begins with the recent high of $106.84 and rises to the lower swing high of $109.74. But beforehand, strength needs to be seen, first with a recovery above an interim lower swing high at $96.25, followed by the lower swing high of $100.43. In addition, the falling 20-day moving average is at $96.34 and will soon dip below $96.25. This means that a recovery of $96.25 will also put crude oil back above the 20-day moving average, which would signal strengthening short-term bullish momentum.
Weekly Hammer Adds to Breakout Potential
Finally, if the week ended today crude oil would show a bullish hammer candlestick pattern on the weekly chart. That pattern would trigger after this week’s closing and would add to the potential for strong momentum following a successful wedge breakout.
Weekly Hammer Adds to Breakout Potential
Alternatively, a drop below this week’s low could see a test of support near the 61.8% Fibonacci retracement level at $86.92. Notably, this could occur while retaining the wedge structure.
WTI Crude Oil Price Forecast
Every new WTI Crude Oil analysis as it publishes, today's technical signal and key levels, live price — on one page.
See all WTI Crude Oil forecastsIf you’d like to know more about technical analysis and how traders use it, please visit our educational area.