Bullish Reversal Puts Buyers Back in Control
DoorDash, Inc. (DASH) triggered a bullish weekly reversal signal this week, suggesting that its bearish correction may have bottomed and that buyers are regaining control. The signal triggered on a rally above $178.04. This suggests that the bearish correction may have reached a bottom and that the stock is starting to attract buyers again.
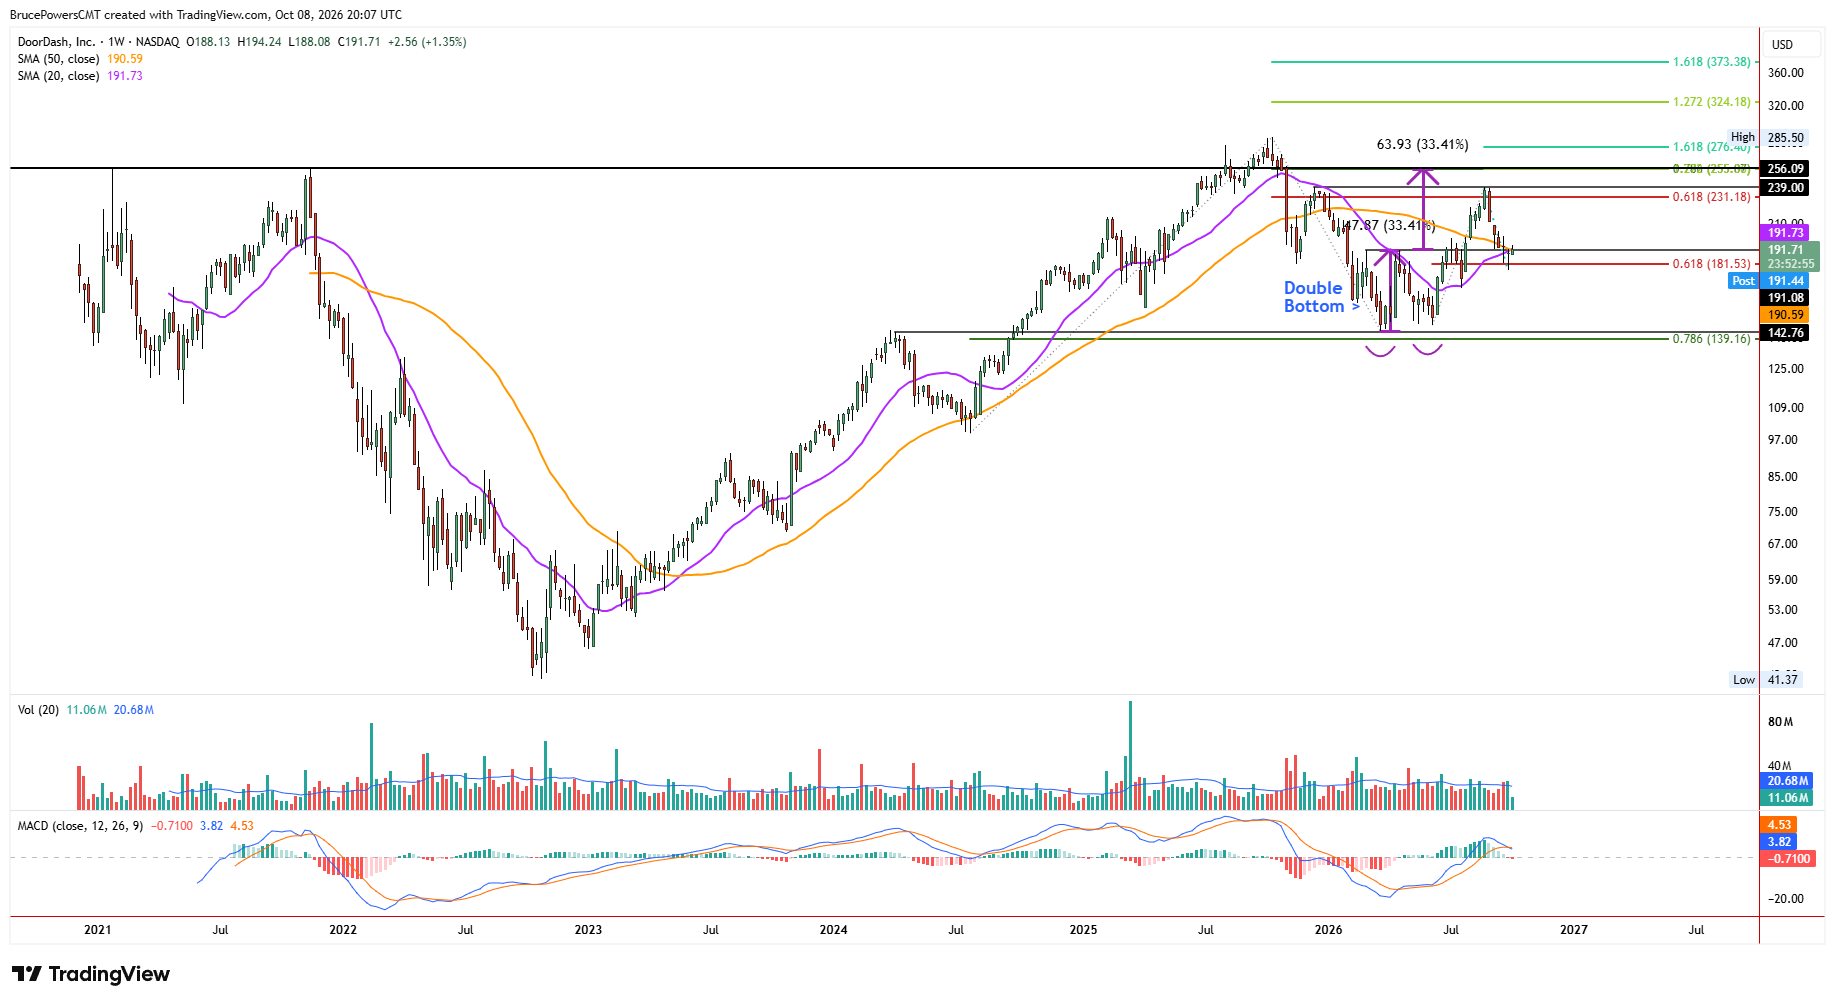
Last week’s low of $174.04 established support for the correction and completed a 61.8% Fibonacci retracement of the prior full advance. It is now a higher swing low and indicates a likely continuation of the bullish trend structure. The advance triggered a breakout above a weekly bullish hammer candlestick pattern, adding to the technical bullish evidence. Confirmation of the weekly breakout will occur with a weekly closing price above last week’s high of $191.40.

Multiple Signals Reinforce Breakout
The weekly breakout has additional technical significance for several reasons. It indicates the likely completion of the first pullback after a major breakout from a double bottom pattern that triggered in late July. Resistance at the neckline of the pattern is $191.17, which was recovered this week after a brief drop below that level. Moreover, resistance near last week’s high is also indicated by the confluence of the 20-week moving average and the 50-week moving average, adding to the significance of the breakout signal. In addition, the 20-week moving average is rising and will soon cross above the 50-week average, providing an indication of improving bullish momentum.
$255 Emerges as a Major Target
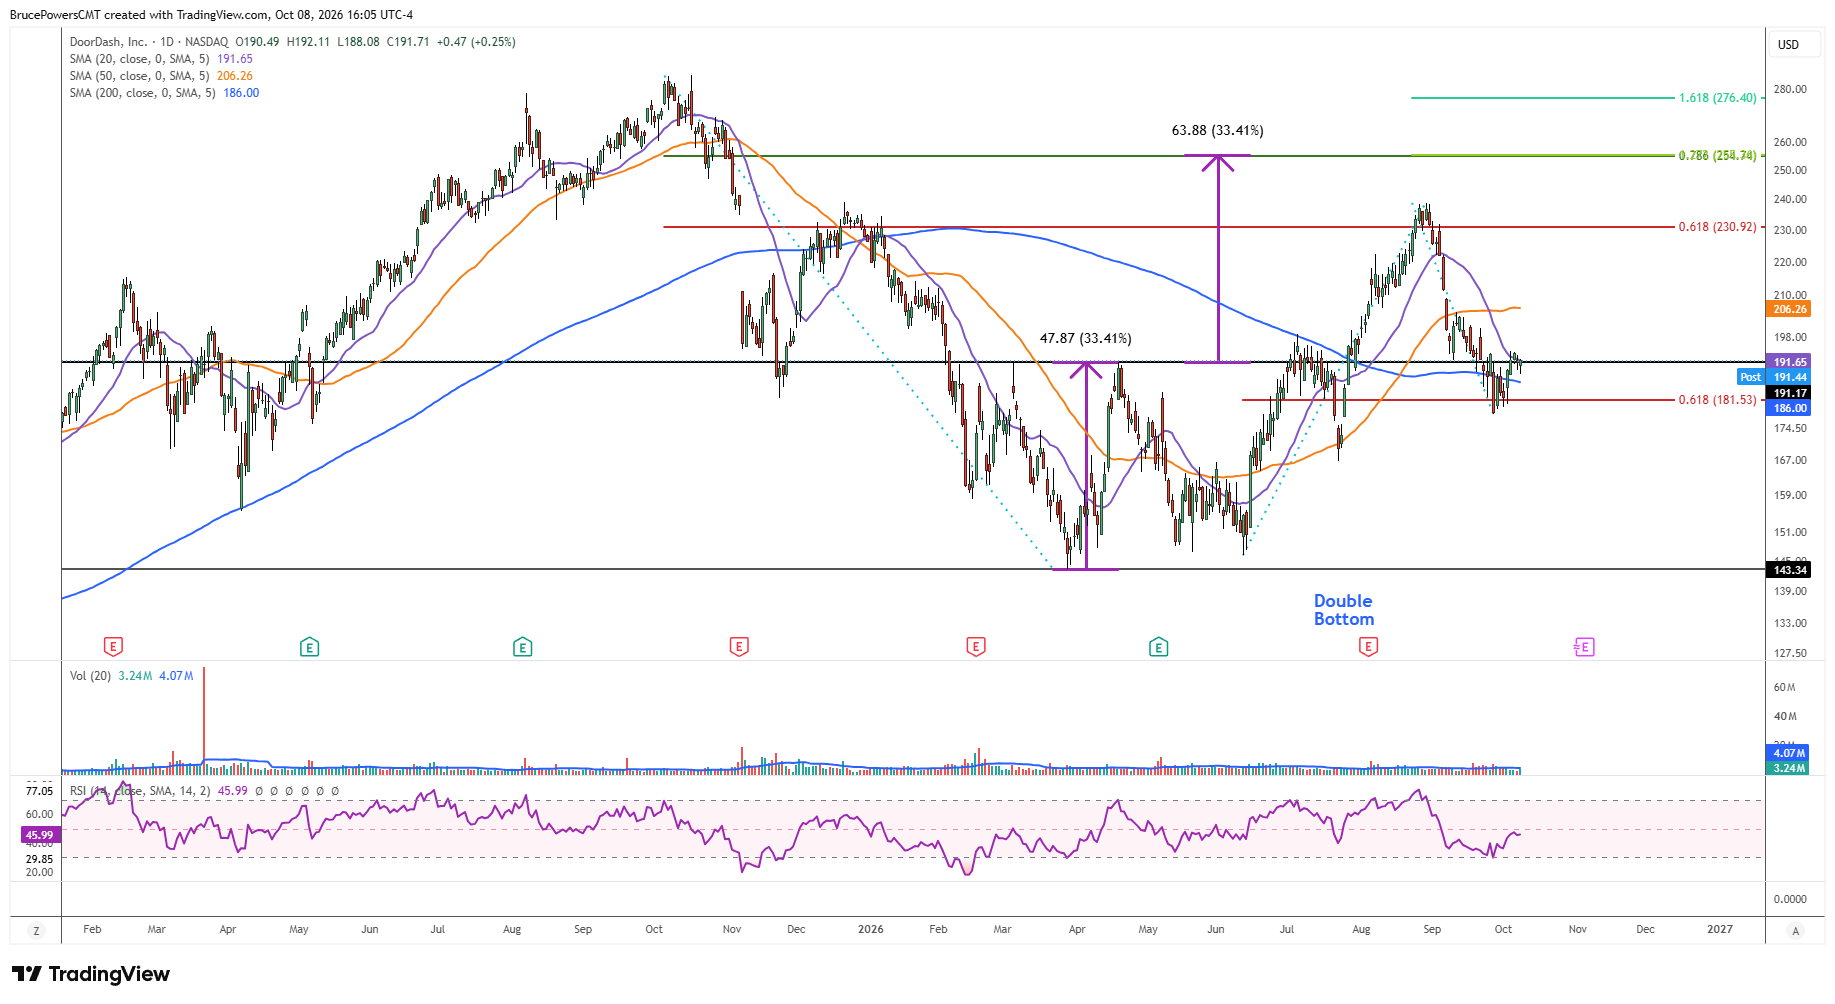
Resistance near $255 is defined by the confluence of several indicators and therefore represents a potential upside target area. That price area is defined by the measured move target from the double bottom pattern, the 78.6% Fibonacci retracement of the prior decline, and a 127.2% Fibonacci extension of the recent pullback. In addition, long-term resistance from 2021 is near $256.09. This confluence strengthens the significance of the $255 area as a potential target if bullish momentum continues.
$188.08 Sets Near-Term Line in the Sand
This week’s higher weekly low of $188.08 is key short-term support, and if it breaks, then a deeper pullback into last week’s range becomes possible before upside follow-through. However, holding above this week’s low would provide a stronger indication of growing demand and help confirm that the correction has ended. This would reinforce the bullish reversal signal that opened the week’s advance and keep DASH positioned for further upside.