
Rising Yields and Oil Put Buyers on Defense
The S&P 500 Index and Nasdaq Composite Index are lower Thursday, with rising Treasury yields and another jump in oil taking the bid out of the record-setting growth trade. This is still a correction, not a trend change. Nobody’s walking away from the earnings story. They just don’t want to pay up for it with the 10-year this high.
Fed Governor Christopher Waller gave the rates trade another push when he said additional hikes may be needed to bring inflation back to target. Crude jumped again on top of that. A tape that was chasing records doesn’t have much appetite for either one.
Shortly after 14:00 GMT, the S&P 500 Index is trading at 7,784.32, down 17.45 or -0.22%. The Nasdaq Composite Index is at 27,393.65, down 145.04 or -0.53%.

The Bond Market Has Not Let Up
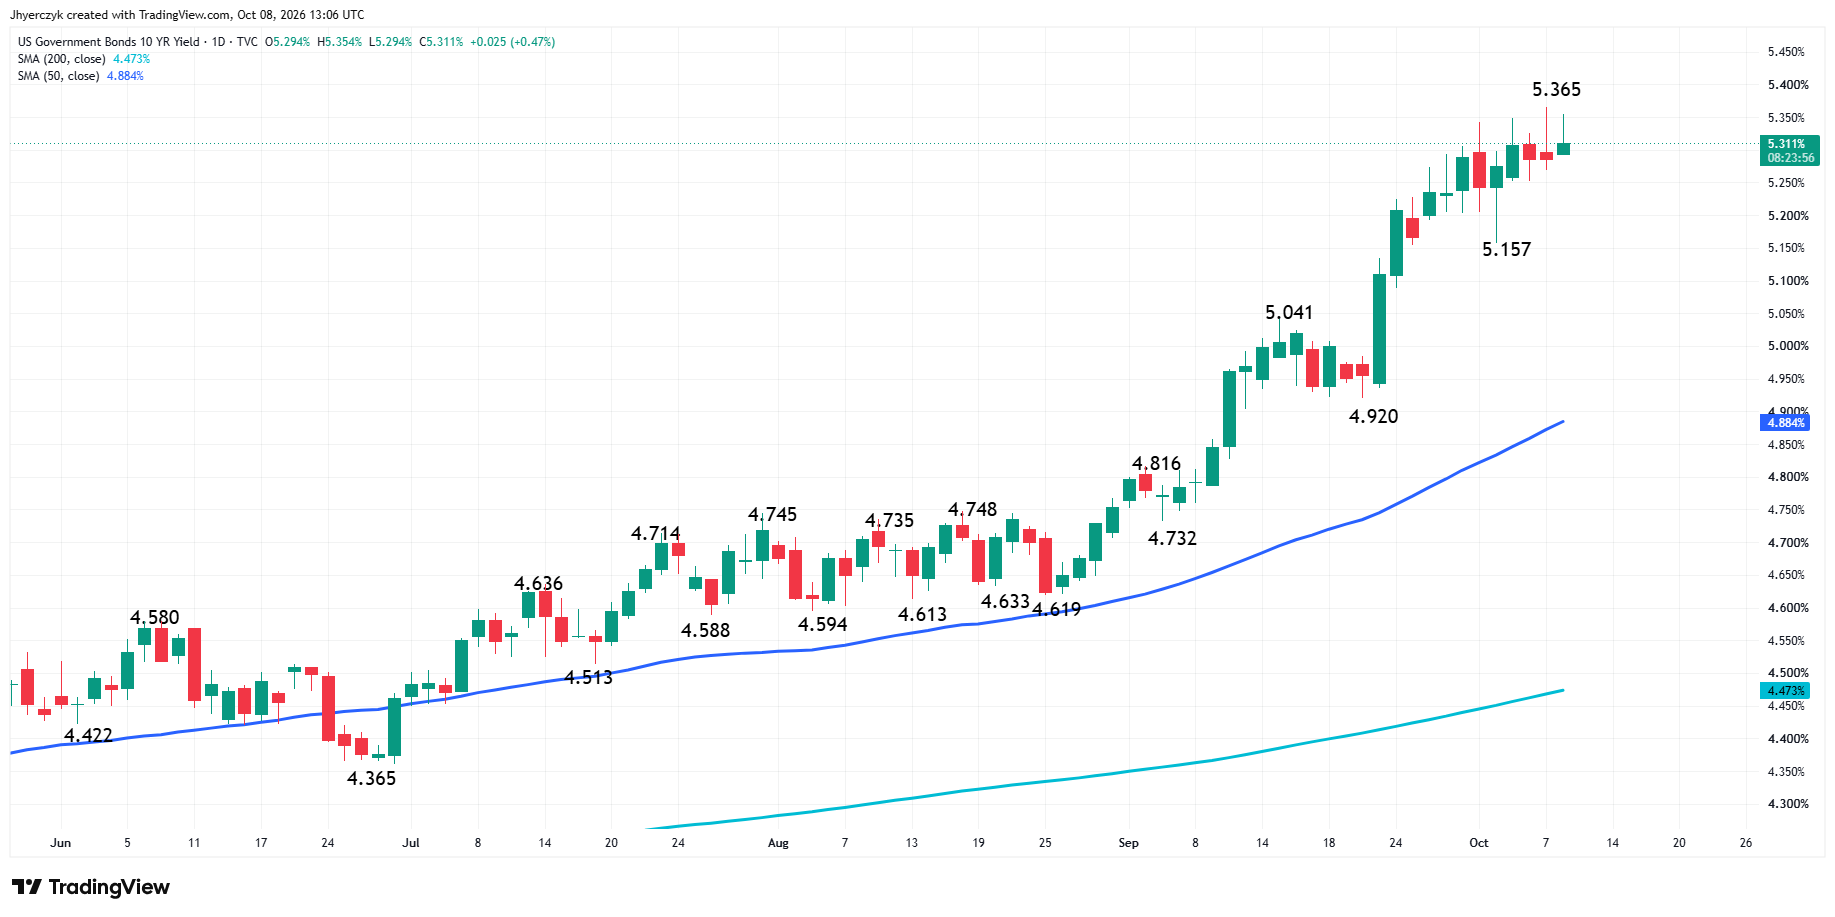
The 10-year Treasury yield was near 5.31% Thursday after trading as high as 5.354%. The 30-year yield reached 5.733% before easing back toward 5.66%. Both are still near levels last seen in 2002. I don’t see stock buyers stepping in front of that.
Waller said the central bank likely needs additional increases, even if they don’t come at consecutive meetings. The market has already pushed October toward a hold. It still has a December hike firmly in the price.
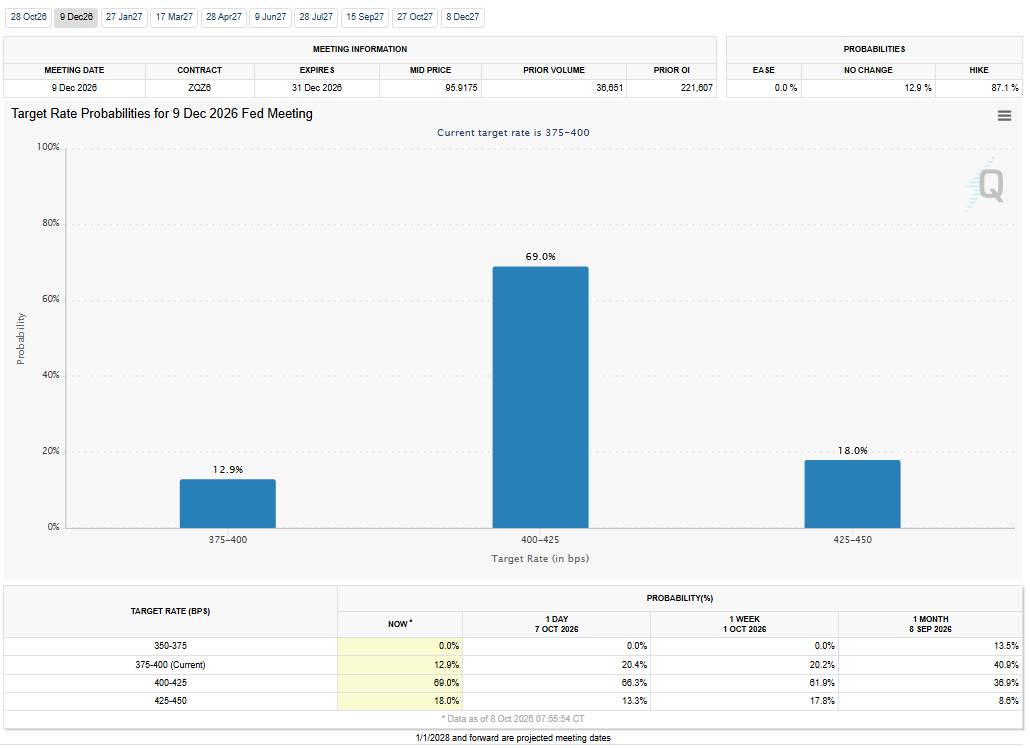
FedWatch shows a 78.4% chance the Fed leaves rates unchanged at the October 28 meeting, with a 21.6% chance of another quarter-point move. By the December 9 meeting, the market is putting 87.1% odds on at least one hike.
S&P 500 Price Forecast
Every new S&P 500 analysis as it publishes, today's technical signal and key levels, live price — on one page.
See all S&P 500 forecastsOil Is Putting Inflation Back in the Trade
Oil gave stocks another reason to pull back. Brent jumped about 4% to around $104 a barrel and WTI climbed about 4% to near $92 after President Trump said he did not want a deal with Iran to end the war. Reports also pointed to the possibility of larger U.S. military action in the Middle East.
With yields already at new highs, a 4% pop in crude is the last thing the bond market wanted to see.
Rate-sensitive groups are catching it first. Banks and technology shares were weaker again Thursday. Intel and Marvell were both down more than 2%, while Bank of America and Citigroup lost about 1%.
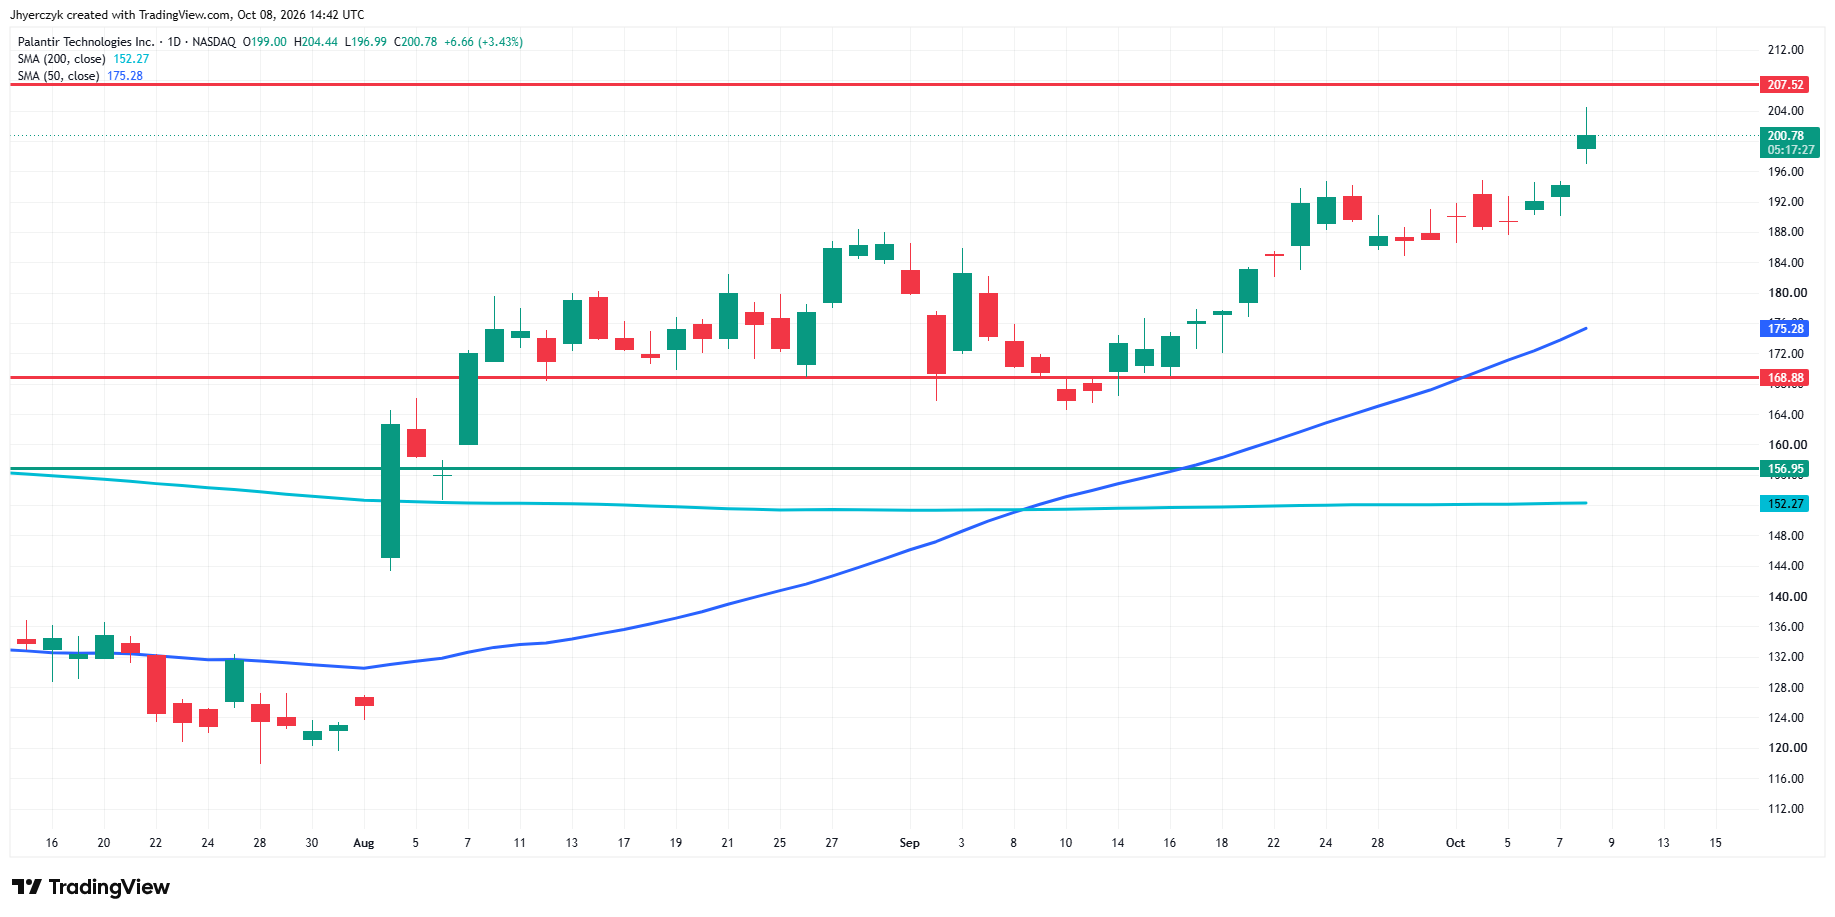
The market isn’t selling everything. Palantir was higher after a Goldman Sachs upgrade, and a few stock-specific trades are still working. Those are one-off trades. The indexes need the bond market to back off.
Earnings Still Have the Job of Carrying the Rally
The earnings story has not disappeared. Third-quarter S&P 500 earnings are expected to post blended growth near 30%, which would make three straight quarters of growth above 25%, according to FactSet.
That’s the bulls’ best card. It doesn’t get played until next week.
Technology did the heavy lifting on the way to the latest records. Traders paid up for AI chips, data-center spending, software and the companies tied to the buildout. Weak guidance is going to be hard to forgive with yields this high.
Thursday’s jobless claims report did not give the Fed a reason to soften its tone. Initial claims fell to 197,000 for the week ended October 3, below the 200,000 estimate. Nobody at the Fed is reading that as a labor market in trouble.
Daily Nasdaq Composite Index Technical Analysis
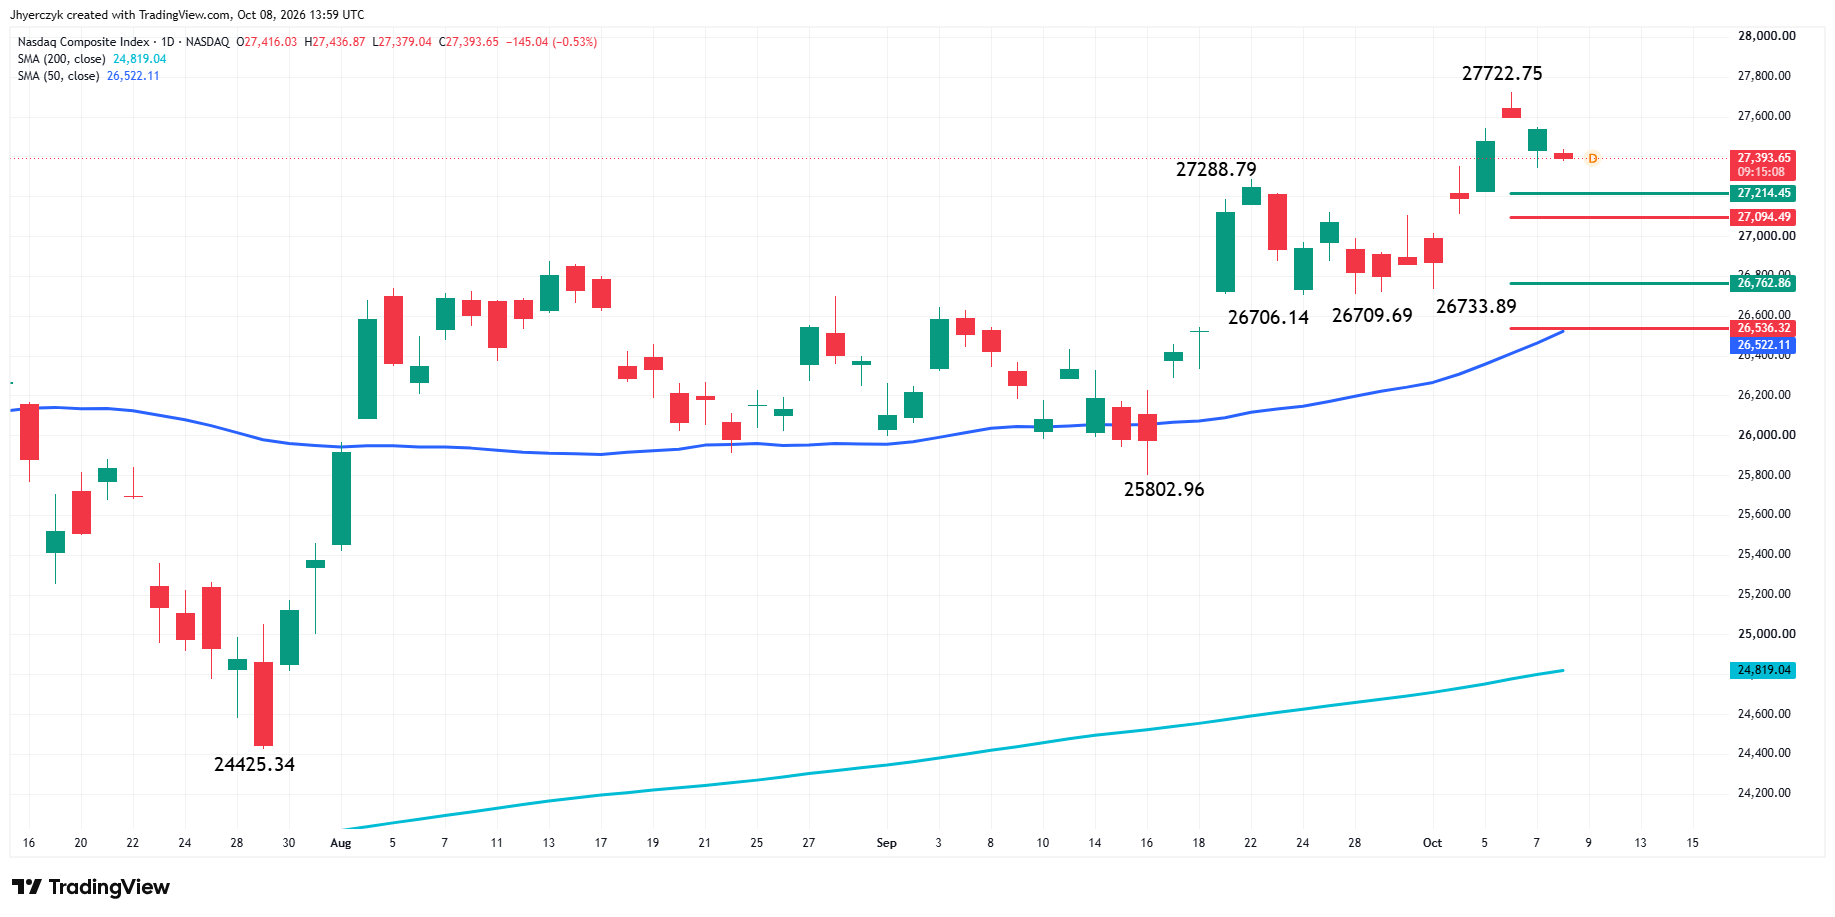
The Nasdaq Composite Index is trading lower Thursday after pulling back from the record high at 27,722.75. The main trend is up according to the daily swing chart. A trade through 27,722.75 will reaffirm the uptrend. The main trend will change to down on a move through the main bottom at 26,706.14.
The Nasdaq could fall into its first retracement zone at 27,214.49 to 27,094.49. This is the 50% to 61.8% retracement of the rally from 26,706.14 to 27,722.75.
If sellers take out 27,094.49, the next area is 26,762.86 to 26,536.32. The 50-day moving average at 26,522.11 sits right underneath, making that a bigger support area.
Daily S&P 500 Index Technical Analysis
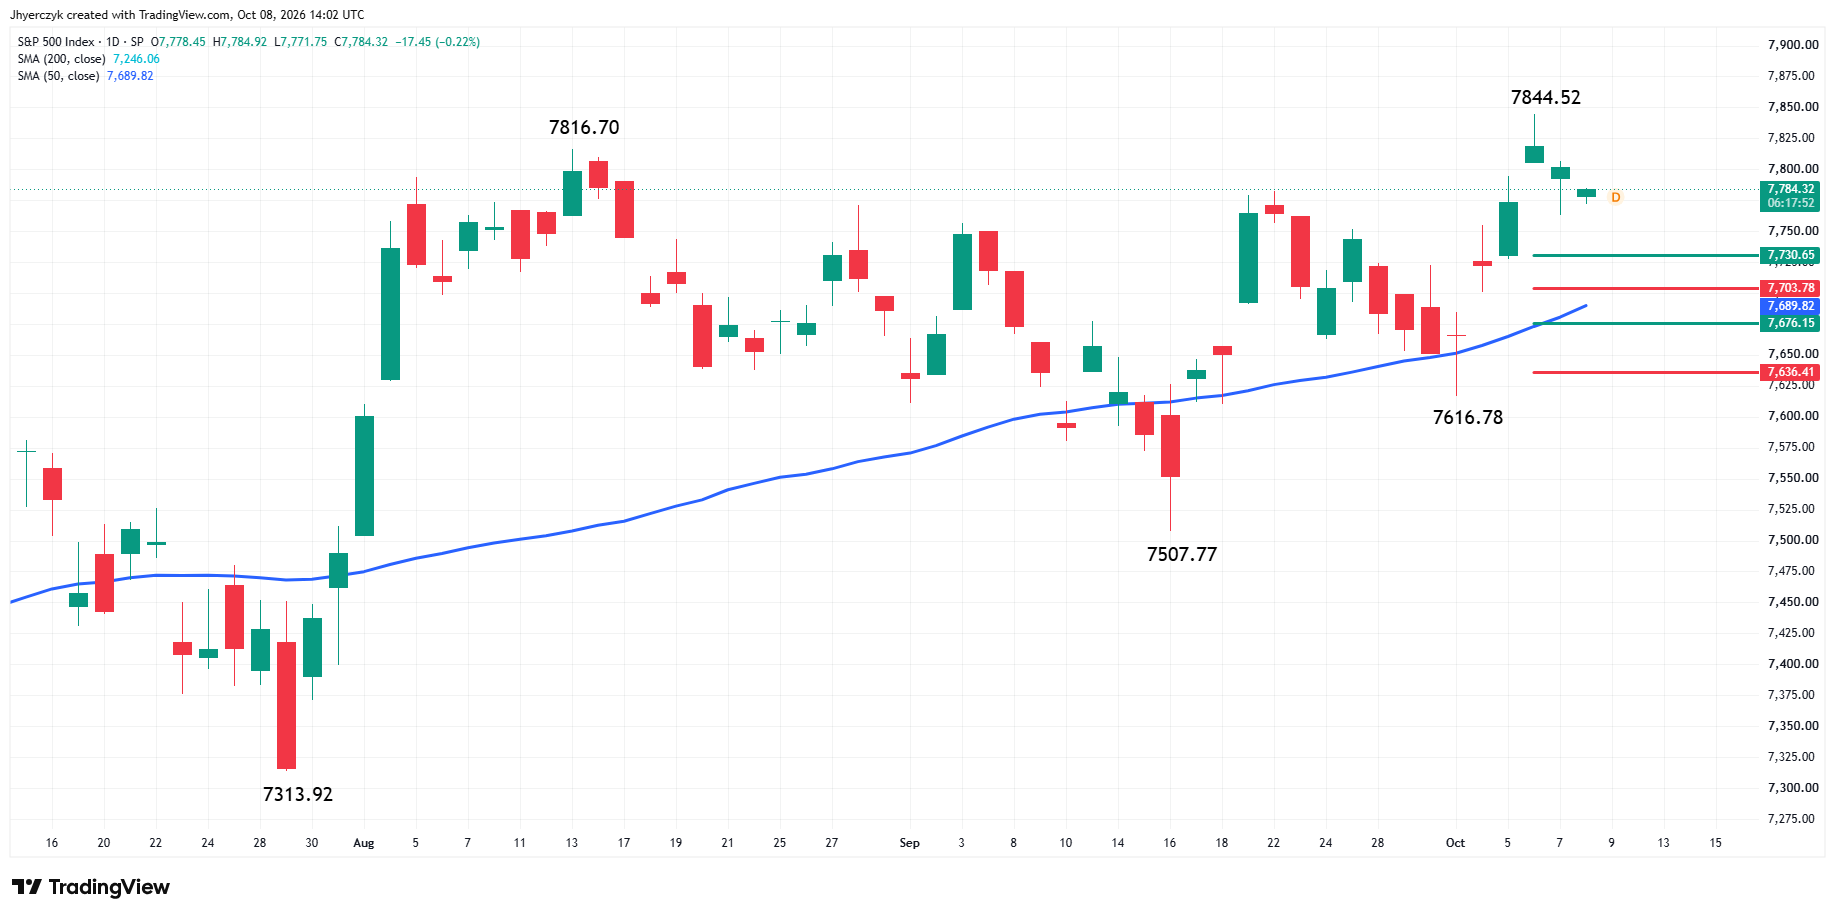
The S&P 500 Index is trading lower Thursday after pulling back from the record high at 7,844.52. The main trend is up according to the daily swing chart. A trade through 7,844.52 will signal a resumption of the uptrend. The main trend will change to down on a break through the main bottom at 7,616.78.
The S&P 500 could fall into its first retracement zone at 7,730.65 to 7,703.78. This is the 50% to 61.8% retracement of the rally from 7,616.78 to 7,844.52.
If sellers take out 7,703.78, the next support is the rising 50-day moving average at 7,689.82, followed by the deeper retracement zone at 7,676.15 to 7,636.41.
What to Watch
Earnings don’t show up until next week, so yields and oil are running the tape until then. The long end hasn’t settled down and crude is moving the wrong way for inflation. Buyers have earnings as their next argument. They just have to get there first.
Both indexes were still holding above their first retracement zones shortly after the New York open. The bias remains bullish while the Nasdaq holds above the short-term retracement zone, and the current weakness is a correction inside the main uptrend unless 26,706.14 fails. The S&P 500 stays bullish above its first retracement zone. Sellers need to take out 7,616.78 to change the main trend.
More Information in our Economic Calendar.