WTI Crude Oil Rallies on Thursday
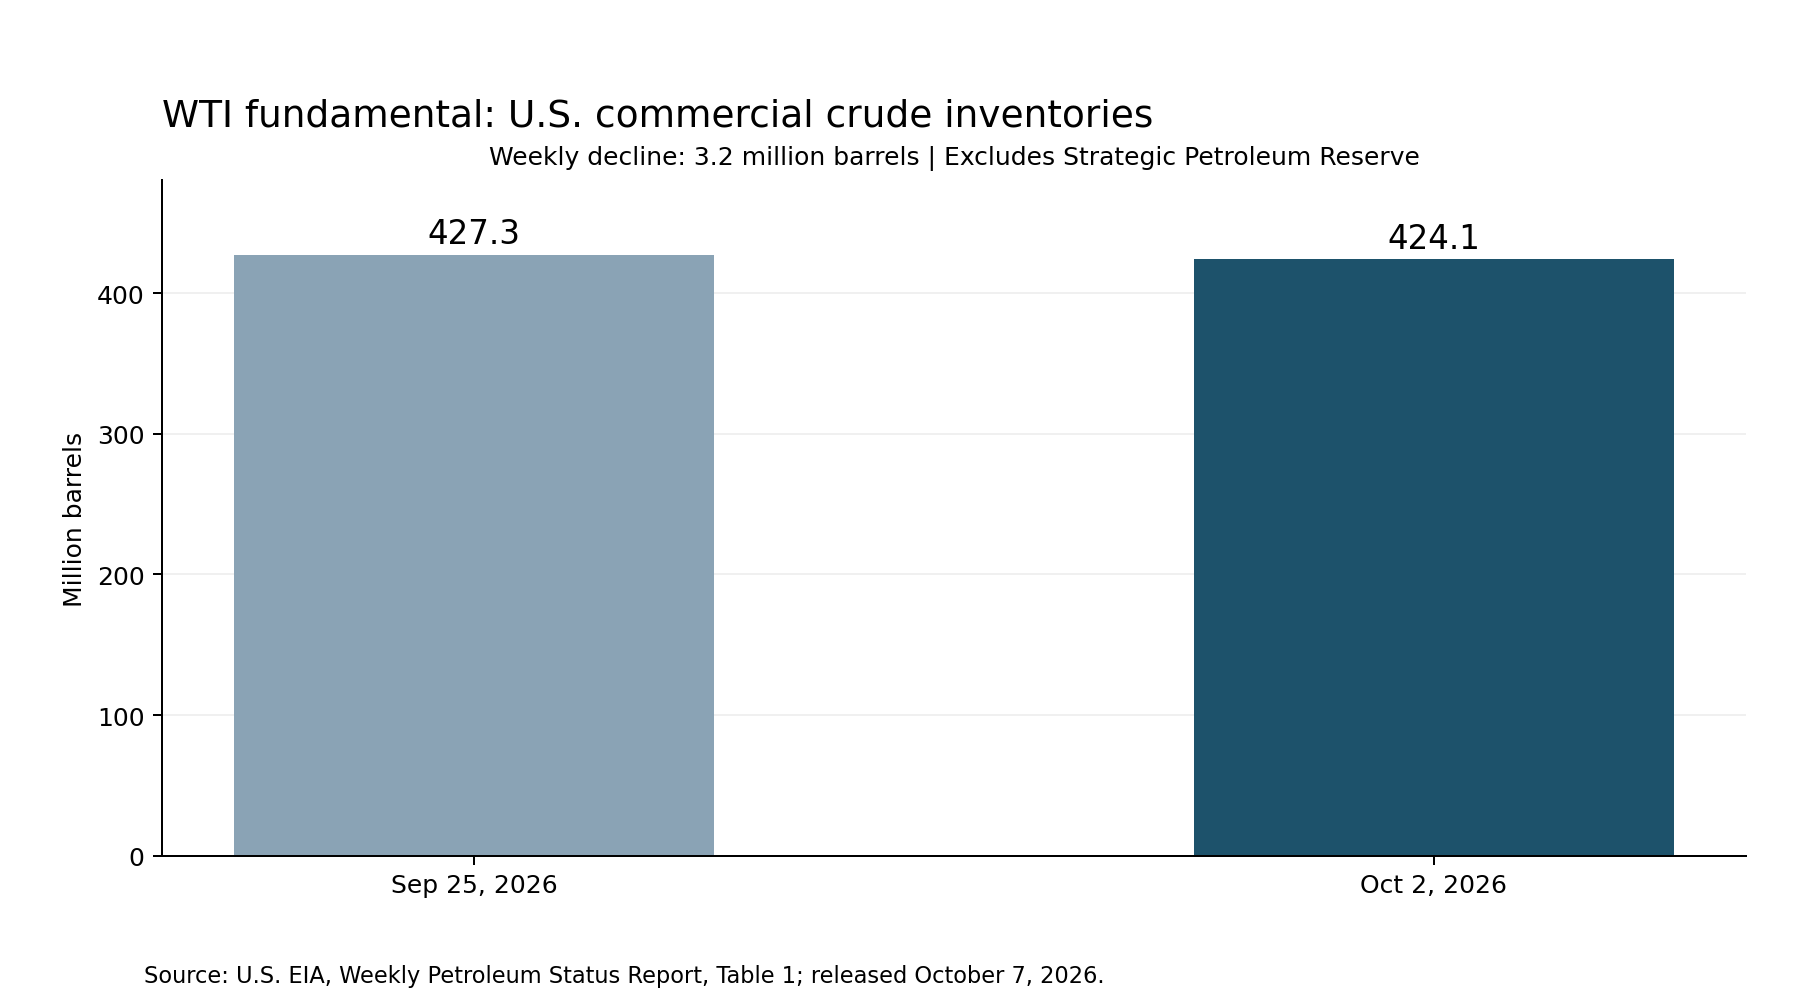
WTI crude has rallied pretty quickly on Thursday, with the latest official figures showing a draw in American crude inventories, strong export flows, and continued pressure on fuel supplies in general. The freshest weekly evidence comes from the EIA report yesterday, which showed that commercial crude inventories declined by 3.2 million barrels to 424.1 million barrels during the previous week. However, stocks still remain approximately 1% above their 5-year average.
So, there is somewhat limited damage in the United States. The weekly draw supports a tighter near-term balance, but the broader inventory comparison does not establish a shortage of crude, at least in the U.S. Total commercial petroleum inventories have fallen by 6.9 million barrels, indicating that the draw has extended beyond crude alone. That does make a certain amount of sense. Some of the distillates, et cetera, are a little behind in their refining.

Availability vs Scarcity According to the EIA
The EIA outlook reinforces the distinction between crude availability and fuel scarcity.
Trade and refining figures help explain the balance. Crude oil exports climbed to almost 5 million barrels per day from 3.57 million during the previous week. Imports also increased sharply, reaching 6.8 million barrels per day. Meanwhile, refinery crude inputs rose by 223,000 barrels. They are trying to catch up.
So, the stronger refinery intake and overseas buying provided support for U.S. oil and should continue to do so unless something changes in the short term. East Coast distillate inventories were 32% below their seasonal 5-year average in September, and the EIA expects regional stocks to remain 20% to 30% below average through the coming winter. It is not a crude problem, per se. It is a final-product problem.
Hurricane Coming
There is a hurricane coming toward the Gulf of Mexico, but this is considered to be an issue that lasts a couple of days, not a massive change in supply over the longer term. Some rigs are being shut down, but this is temporary, and there are more structural problems to worry about.
Brent Oil Price Forecast
Every new Brent Oil analysis as it publishes, today's technical signal and key levels, live price — on one page.
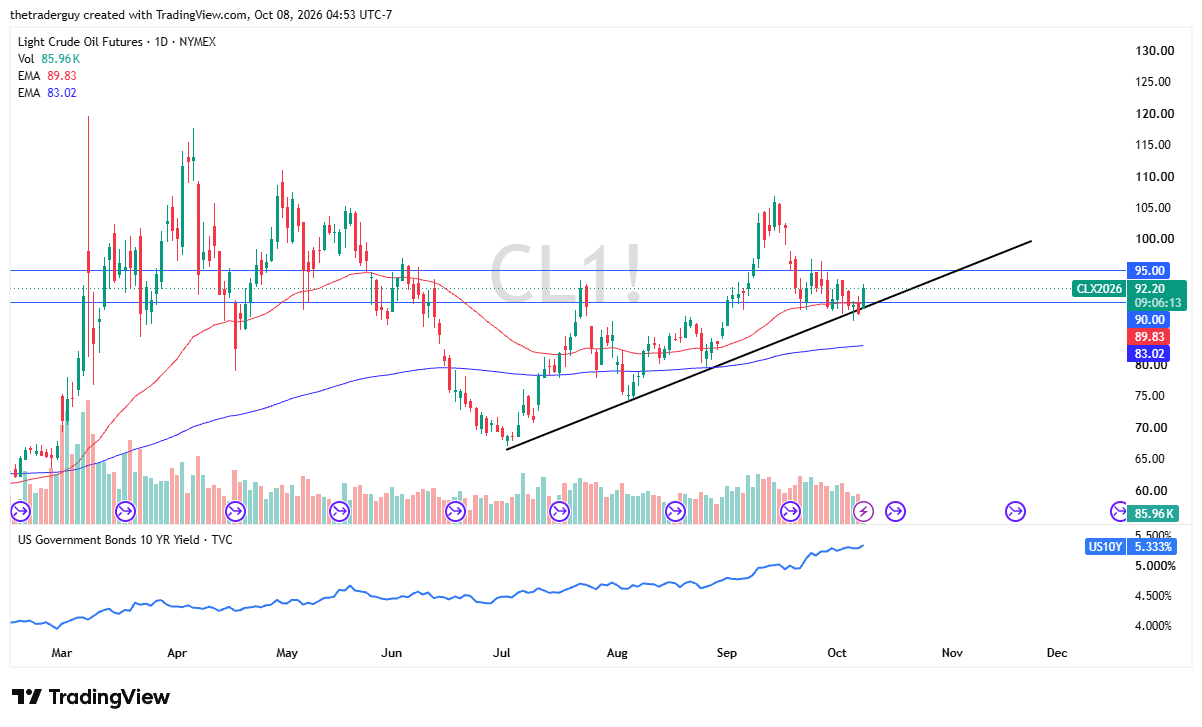
See all Brent Oil forecastsThe fundamental question is whether export demand and refinery consumption continue drawing from inventories as expensive fuel restrains consumption. From a technical analysis standpoint, we can see that the WTI crude oil market is bouncing from a trend line and is well above the $90 level. We also have the 50-day EMA here. In this environment, it certainly looks as if there is some demand. Whether or not it is explosive demand, like we have seen multiple times in the past, is a completely different question. As refiners try to catch up, it does suggest that they will be buying more.
Brent Has Even More Issues
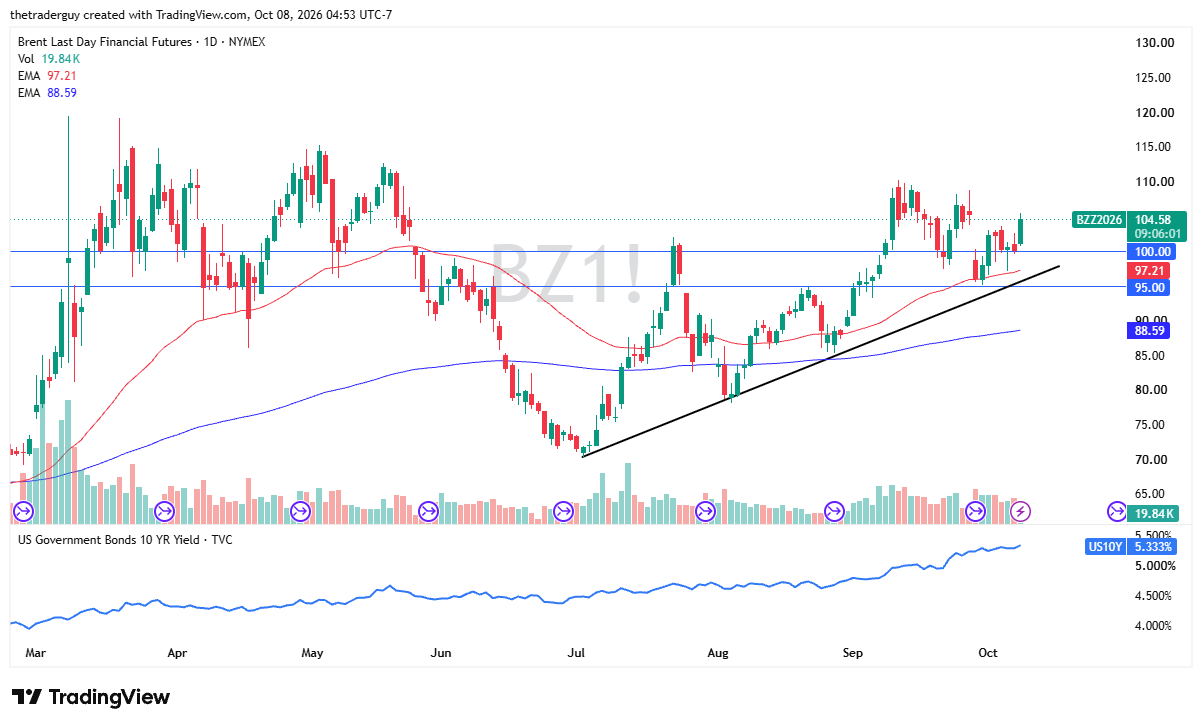
The Brent market is very similar. It is dominated by disrupted international supply routes and the cost of moving crude to refiners. In the United States, it is a matter of shipping it through some pipes for the most part. Around the world, it is a whole different scenario. For example, a place like South Korea has to get that oil imported. Other places, like China, import and export. So, it is a completely different and more complicated picture.
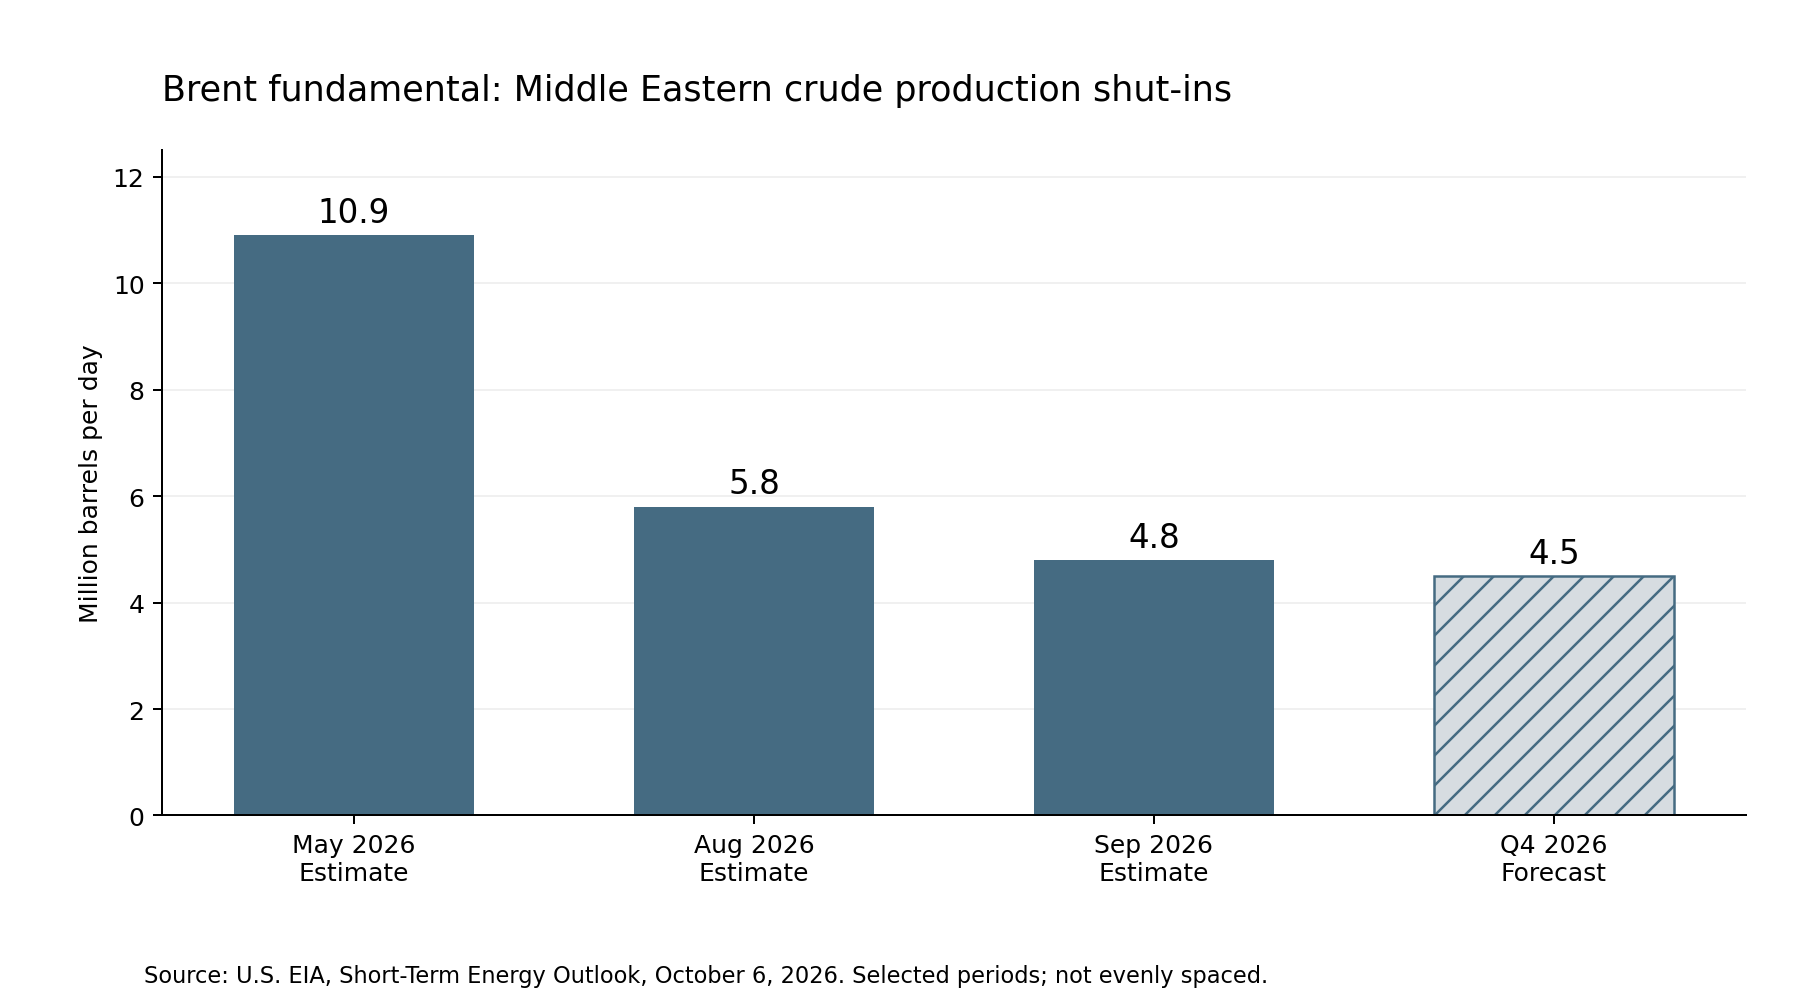
The EIA estimates that Middle Eastern crude production shut-ins fell to 4.8 million barrels per day in September, compared to 5.8 million in August, and at one point were as much as 10.9 million. This improvement represents a recovery in available supply, although volumes remain unavailable at times and the numbers are a bit of a moving target.
The price effects of disruption have been significant. In its October 5 review, the EIA reported that Brent front-month futures peaked at $109 per barrel on September 15, but it also described increasing Chinese crude imports relative to May and June, as well as a slowdown in U.S. Strategic Petroleum Reserve releases during September. Those developments have reduced some of the buffers that had previously softened the impact of interrupted Middle Eastern supply.
EIA October Outlook
The EIA October outlook projects average Brent spot prices of right around $105 per barrel during the fourth quarter, which is an upward revision of $14 from its previous forecast. The agency also estimates that global inventories declined by about 1.9 million barrels per day in the third quarter and forecasts another 700,000-barrel-per-day decline in the fourth.
It is an improvement. Improved production availability can limit the upside, while continued inventory depletion leaves the market sensitive to fresh interruptions. Export reliability matters alongside production, so oil must reach buyers consistently. Think Strait of Hormuz. The immediate focus is therefore on sustained deliveries, inventory rebuilding, and the durability of demand at elevated prices.
It is a bit of a balance here. Further interruptions could cause a major issue, and we have recently seen the Iranians attack the East-West pipeline in Saudi Arabia. More of that could cause plenty of problems in this market.
Technical Analysis
From a technical analysis standpoint, we have simply bounced from the 50-day EMA and are looking to fill the gap from the Monday into Tuesday session. Ultimately, there does seem to be an underlying bid for crude in general, and as a result, it is likely that there will be buyers on dips going forward until something fundamentally changes. I still believe that the buyers have the upper hand, although it is not as explosively bullish as it once was.
If you’d like to know more about how to trade natural gas, please visit our educational area.