
Natural Gas Tests Resistance At $3.20 – $3.25
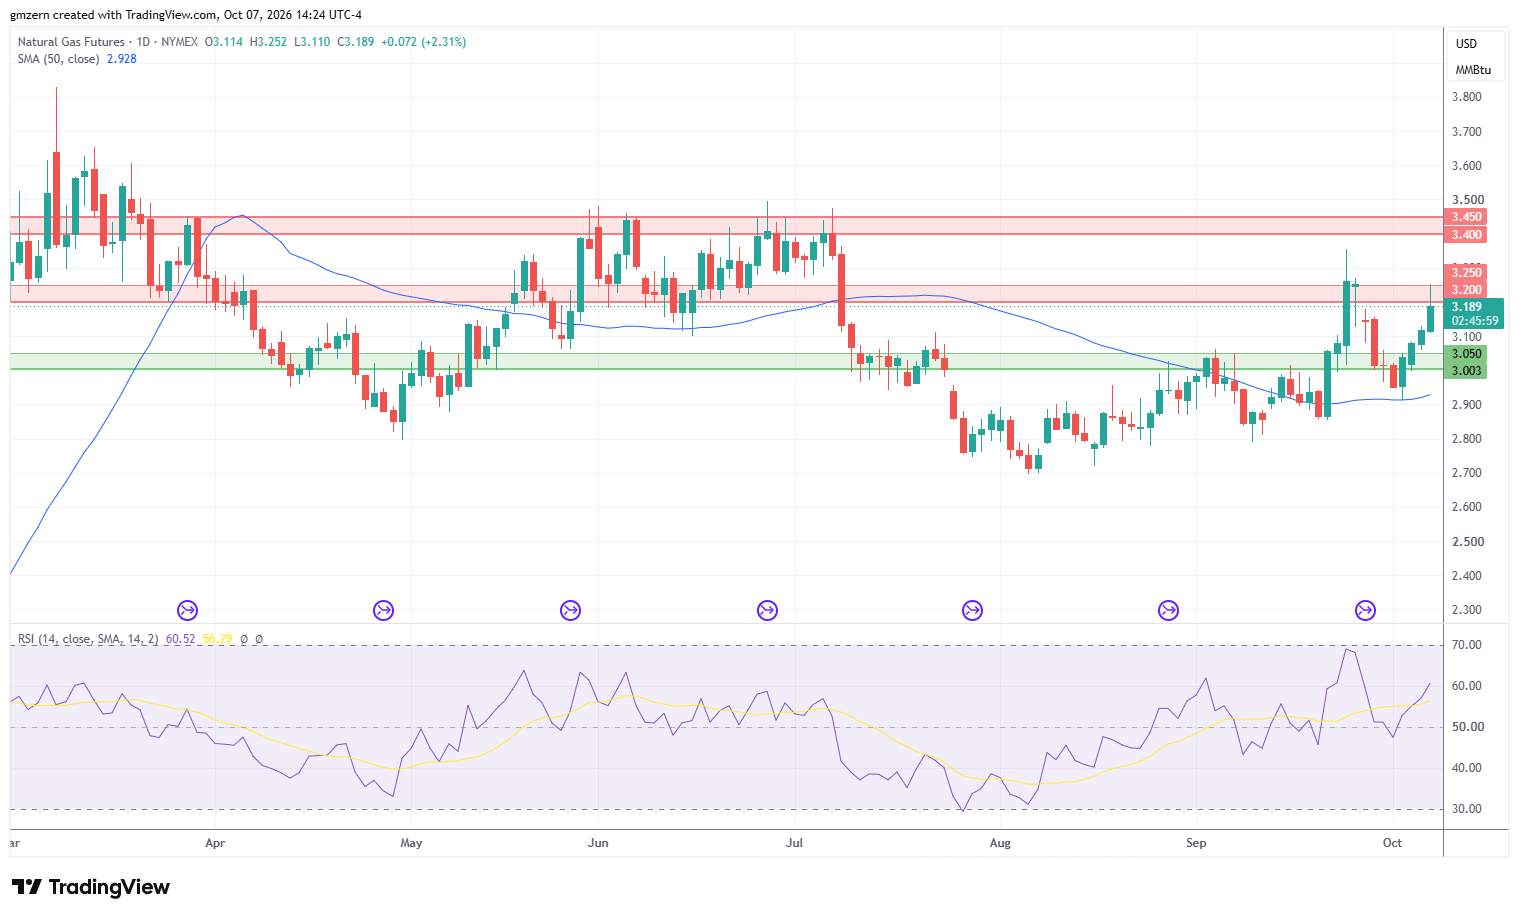
Natural gas gains ground as traders worry that a storm could disrupt supply. Traders also prepare for tomorrow’s EIA report, which is expected to show that working gas in storage increased by +79 Bcf from the previous week.
Currently, natural gas is trying to settle above the resistance level at $3.20 – $3.25. In case this attempt is successful, natural gas will move towards the next resistance level, which is located in the $3.40 – $3.45 range. It looks that short-covering serves as an additional bullish catalyst for natural gas.
On the support side, a move below the $3.15 level will push natural gas back towards the support at $3.00 – $3.05. If natural gas pulls back below the $3.00 level, it will head towards the 50 MA at $2.93.

WTI Oil Retreats As Gasoline Inventories Exceed Estimates
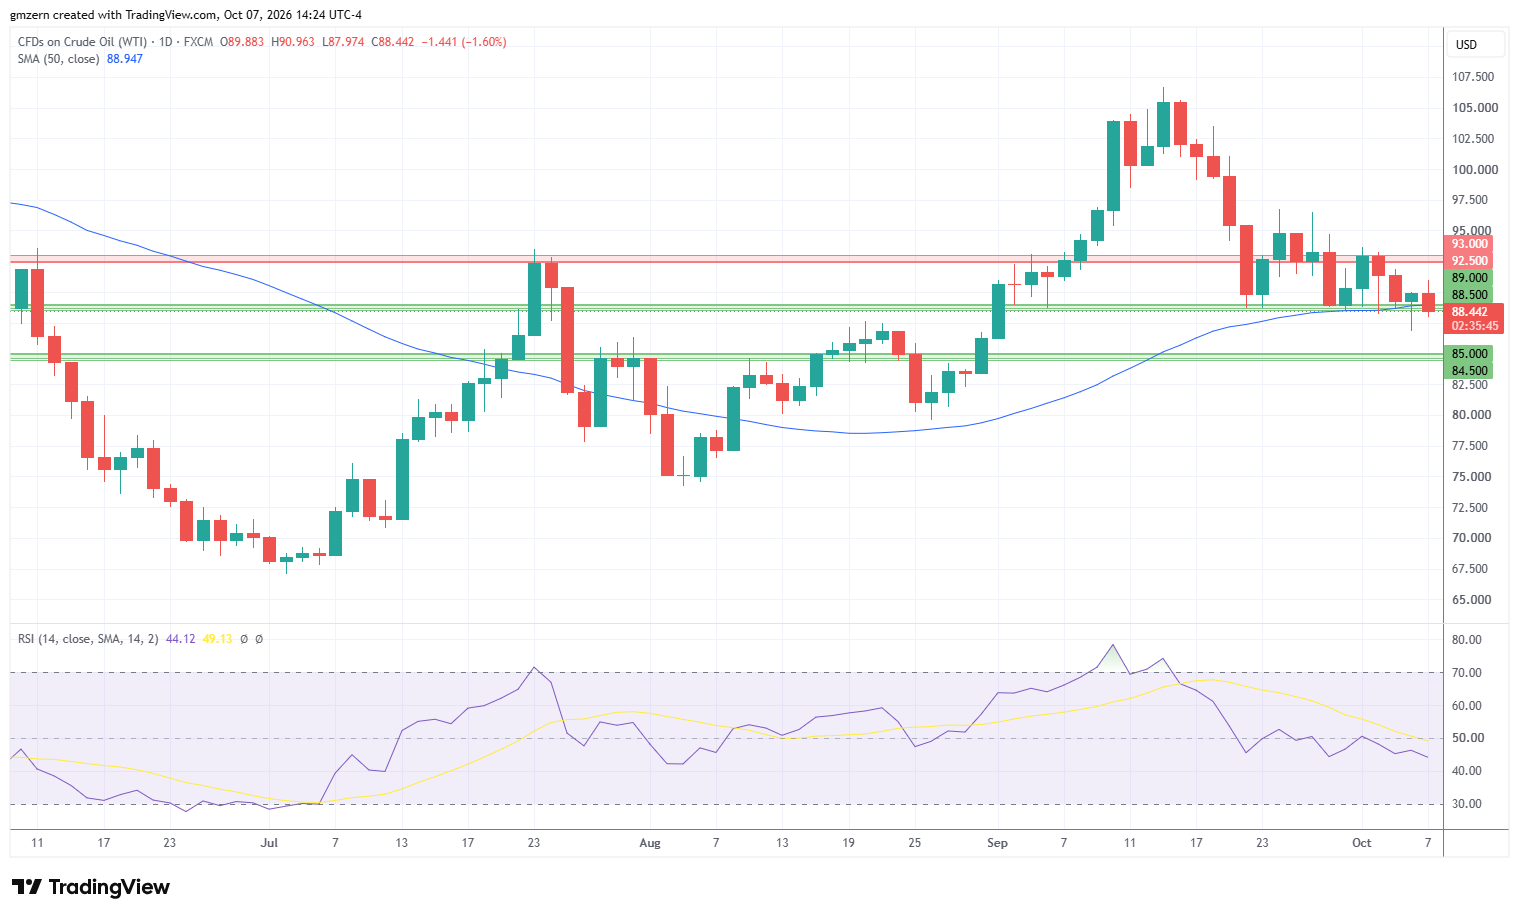
WTI oil is losing ground as traders react to the EIA Weekly Petroleum Status Report. The report indicated that crude inventories declined by -3.2 million barrels from the previous week, compared to analyst forecast of +1.7 million barrels. Gasoline inventories increased by +0.4 million barrels, while analysts expected that they would decline by -1.7 million barrels.
Strategic Petroleum Reserve declined from 283.8 million barrels to 283.0 million barrels as U.S. continued to sell oil from strategic reserves. Domestic oil production increased from 13.955 million bpd to 13.979 millon bpd, supported by high oil prices.
There are no signs indicating that U.S. and Iran are moving towards serious negotiations, but traders are ready to bet that the flow of oil through the Strait of Hormuz would increase despite Iran’s efforts to attack tankers.
Currently, WTI oil is trying to settle below the support level at $88.50 – $89.00. If WTI oil manages to settle below the $88.50 level, it will head towards the next support, which is located in the $84.50 – $85.00 range. RSI is in the moderate territory, so there is plenty of room to gain additional downside momentum in case the right catalysts emerge.
On the upside, a move above the $90.00 level will push WTI oil towards the nearest resistance, which is located in the $92.50 – $93.00 range. If WTI oil climbs above the $93.00 level, it will head towards the $96.00 level.
Natural Gas Price Forecast
Every new Natural Gas analysis as it publishes, today's technical signal and key levels, live price — on one page.
See all Natural Gas forecastsBrent Oil Tests The $100 Level
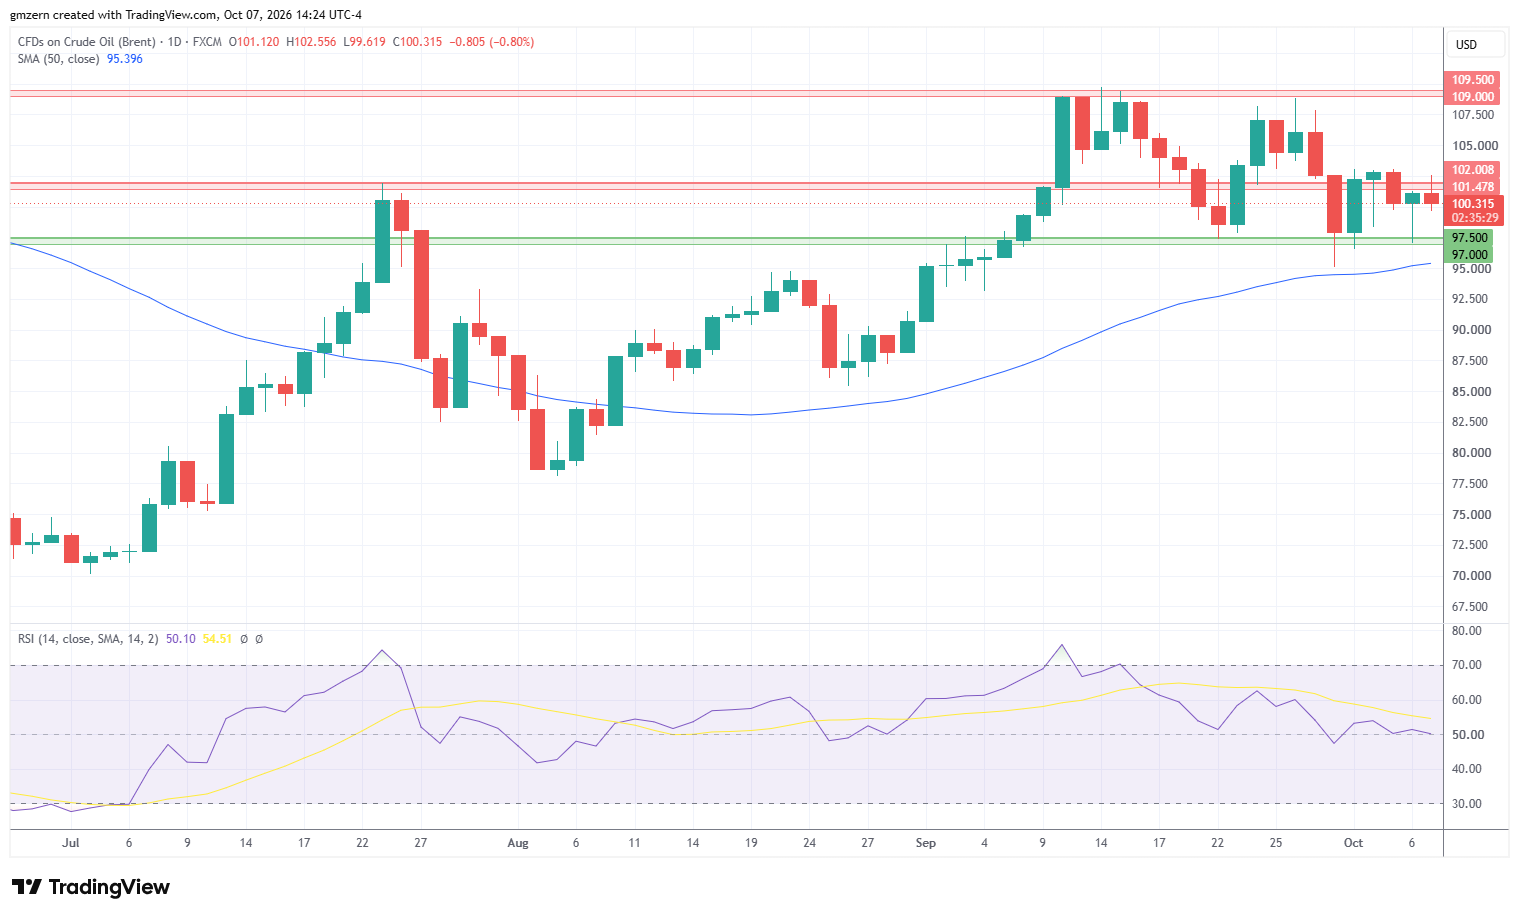
Brent oil is losing ground amid broad pullback in the oil markets. I’d note that Brent oil was moving back and forth in recent trading sessions as traders reacted to headlines and waited for stronger catalysts.
From the technical point of view, Brent oil has recently made an attempt to settle above the resistance level at $101.50 – $102.00 but lost momentum and pulled back. If Brent oil manages to settle back below the $100.00 level, it will head towards the support level, which is located in the $97.00 – $97.50 range.
On the upside, a move above the $102.00 level will open the way to the test of the resistance level at $109.00 – $109.50.
If you’d like to know more about how commodity markets work, please visit our educational area.