Bullish Momentum Targets $3.317
Natural gas continued to show strength on Wednesday, rising above several potential resistance levels to reach a nine-day high of $3.252. It triggered a weekly breakout above last week’s high of $3.18, further confirming strength. Moreover, the current low for the week of $2.997 is a higher weekly low and support was found at the 20-week moving average. That is the first time in 14 weeks that natural gas traded above the 20-week average for the full week. This identifies the indicator as dynamic support after it has represented resistance for a while. That switch is bullish and shows the firming of demand as strength is confirmed on moves above key levels.

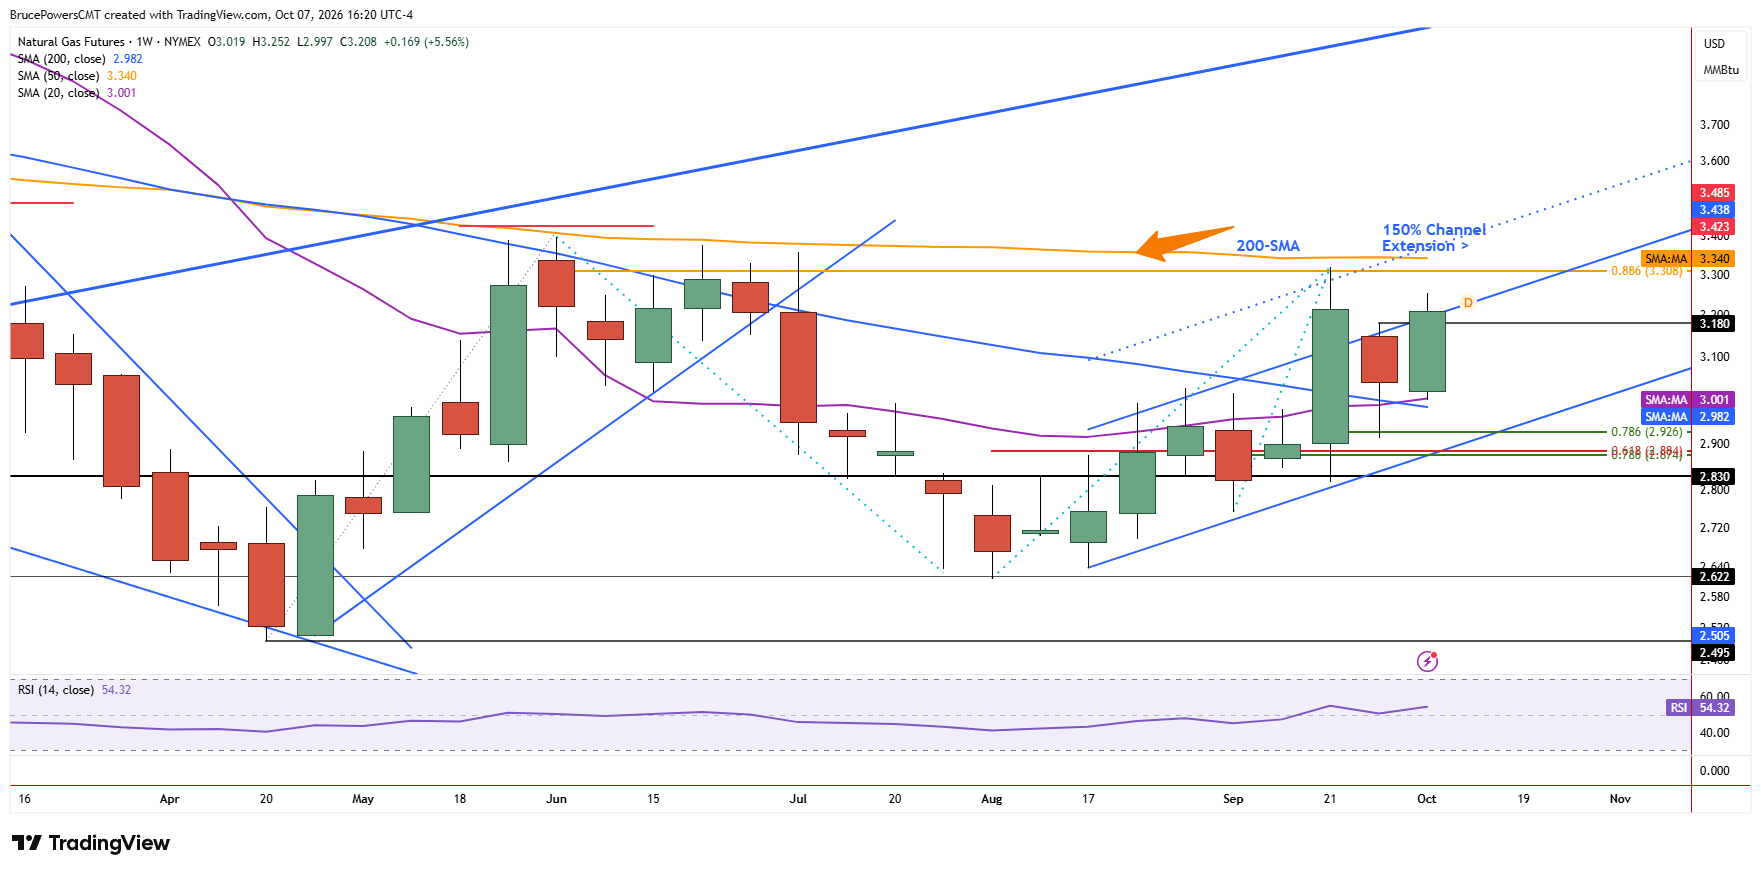
Higher Timeframes Reinforce Momentum
This was the third consecutive day up from last Friday’s higher swing low that found support near a key Fibonacci retracement level and the 20-day moving average, suggesting that the pullback is over and the dominant bullish trend retains its influence. Both daily and weekly timeframes are bullish and confirm improving momentum.
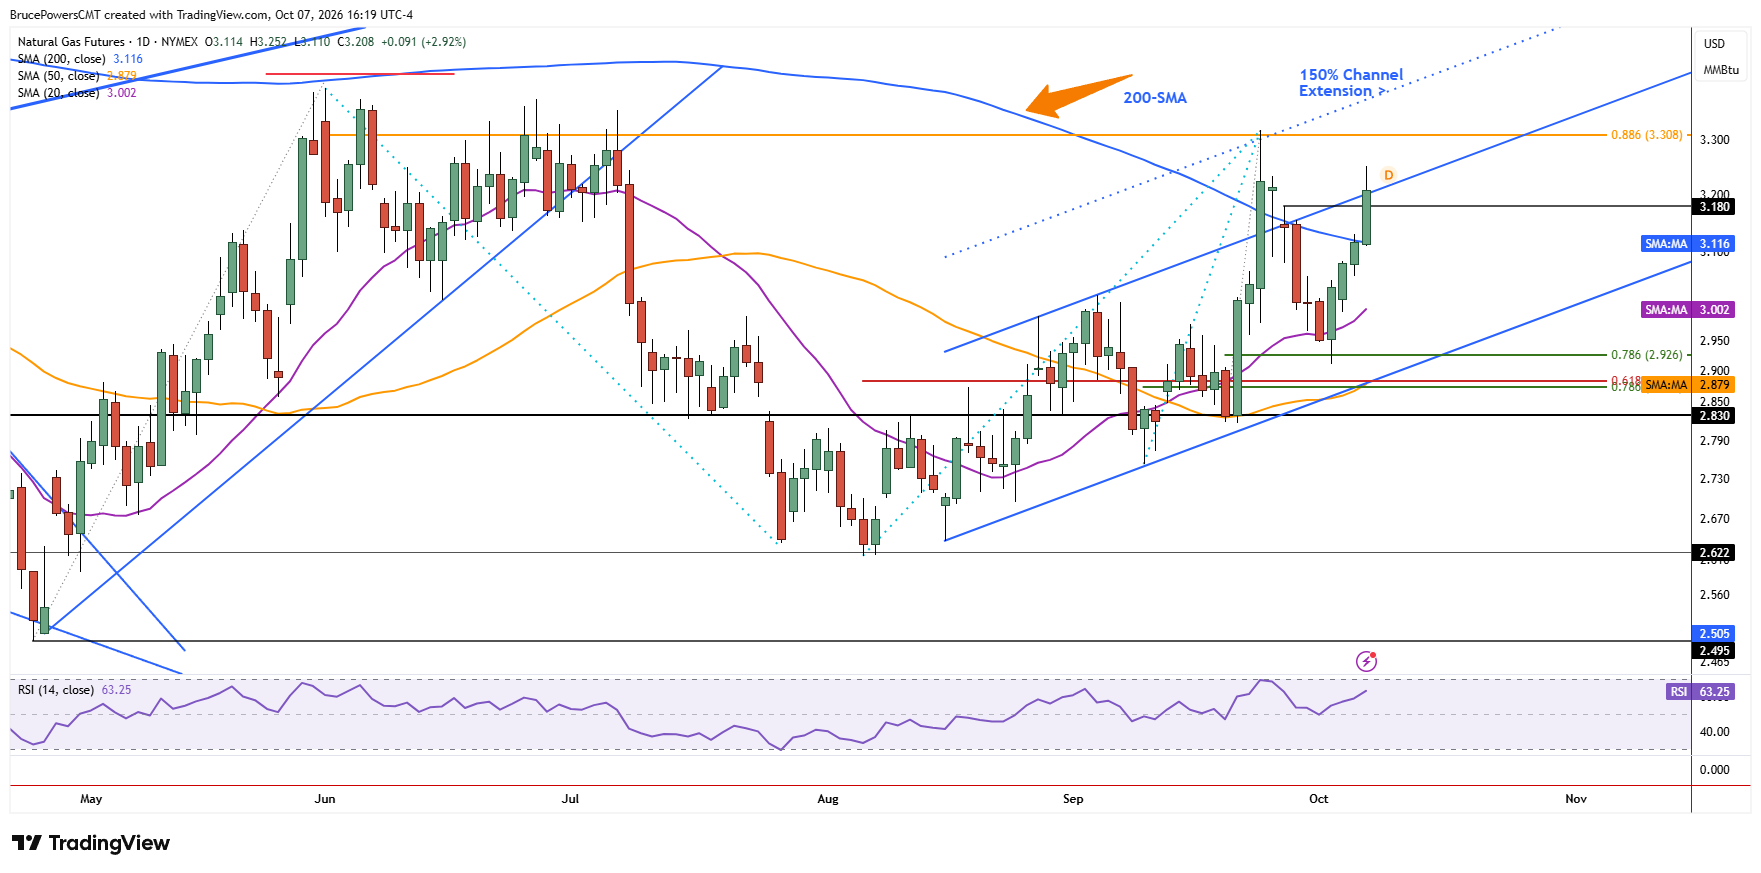
200-Day Average Turns Into Support
Key potential resistance levels on the daily chart that were exceeded began with the 200-day moving average near $3.12, which was tested with Tuesday’s high. Also, that indicator was recognized as support with Wednesday’s higher daily low of $3.11, showing buyers in control and the retention of momentum. That momentum was subsequently seen in a relatively wide range day that shows buyers in control during the session and into the close, indicated by the large green body.
Trend Channel Breakout Opens Path Higher
Following the reclaim of the 200-day moving average, last week’s high was exceeded as noted above, and that was followed by a rise above the upper boundary of a rising trend channel. That upper boundary area may see resistance and stall the ascent but if support is confirmed near the 200-day moving average and followed by strength, a continuation higher to challenge last month’s peak of $3.317 could occur.
If you’d like to know more about how to trade natural gas, please visit our educational area.