


Bearish Pressure Tests Summer Support
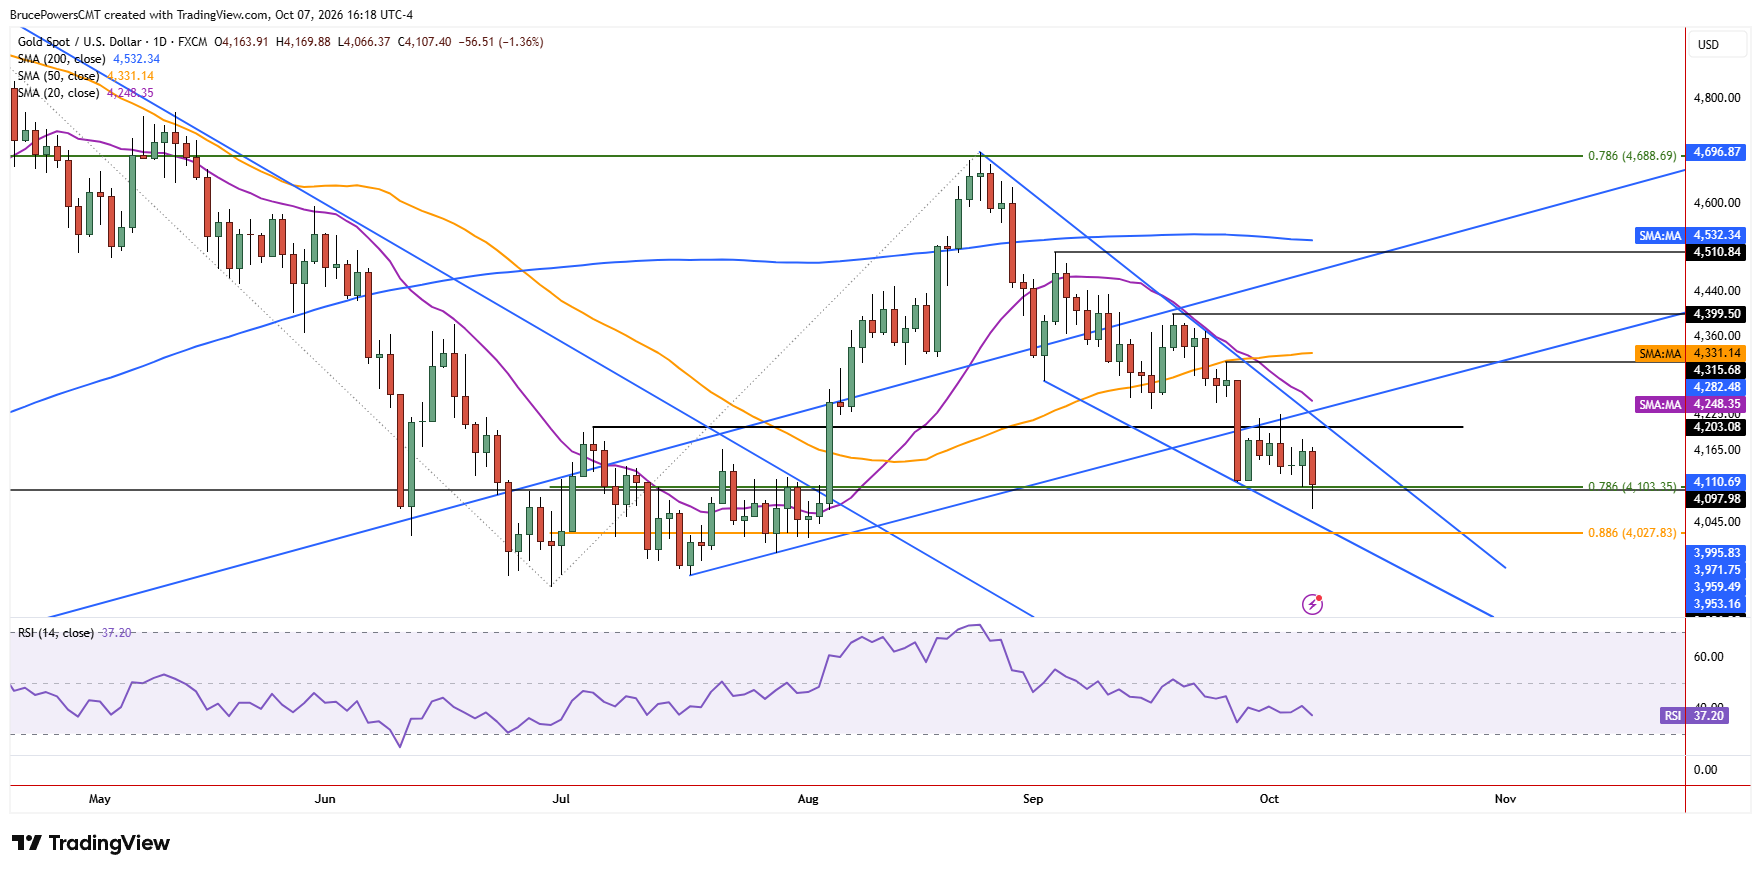
Gold continued to weaken on Wednesday, reaching a new retracement low of $4,066 as sellers retained control. This showed the progression of the short-term bearish trend after an upside pullback to $4,226 found resistance near the uptrend line last Friday, which had recently marked dynamic support. The day’s low tested support inside a consolidation zone near the lows of the summer.
Weakness was shown by a break below the 78.6% Fibonacci retracement level at $4,103 but given where gold is trading at the time of writing, it may yet close at or above that level. If that occurs, that bearish signal will not have confirmed. Instead, the area continues to see some signs of support.

Long-Term Trend Faces Critical Support
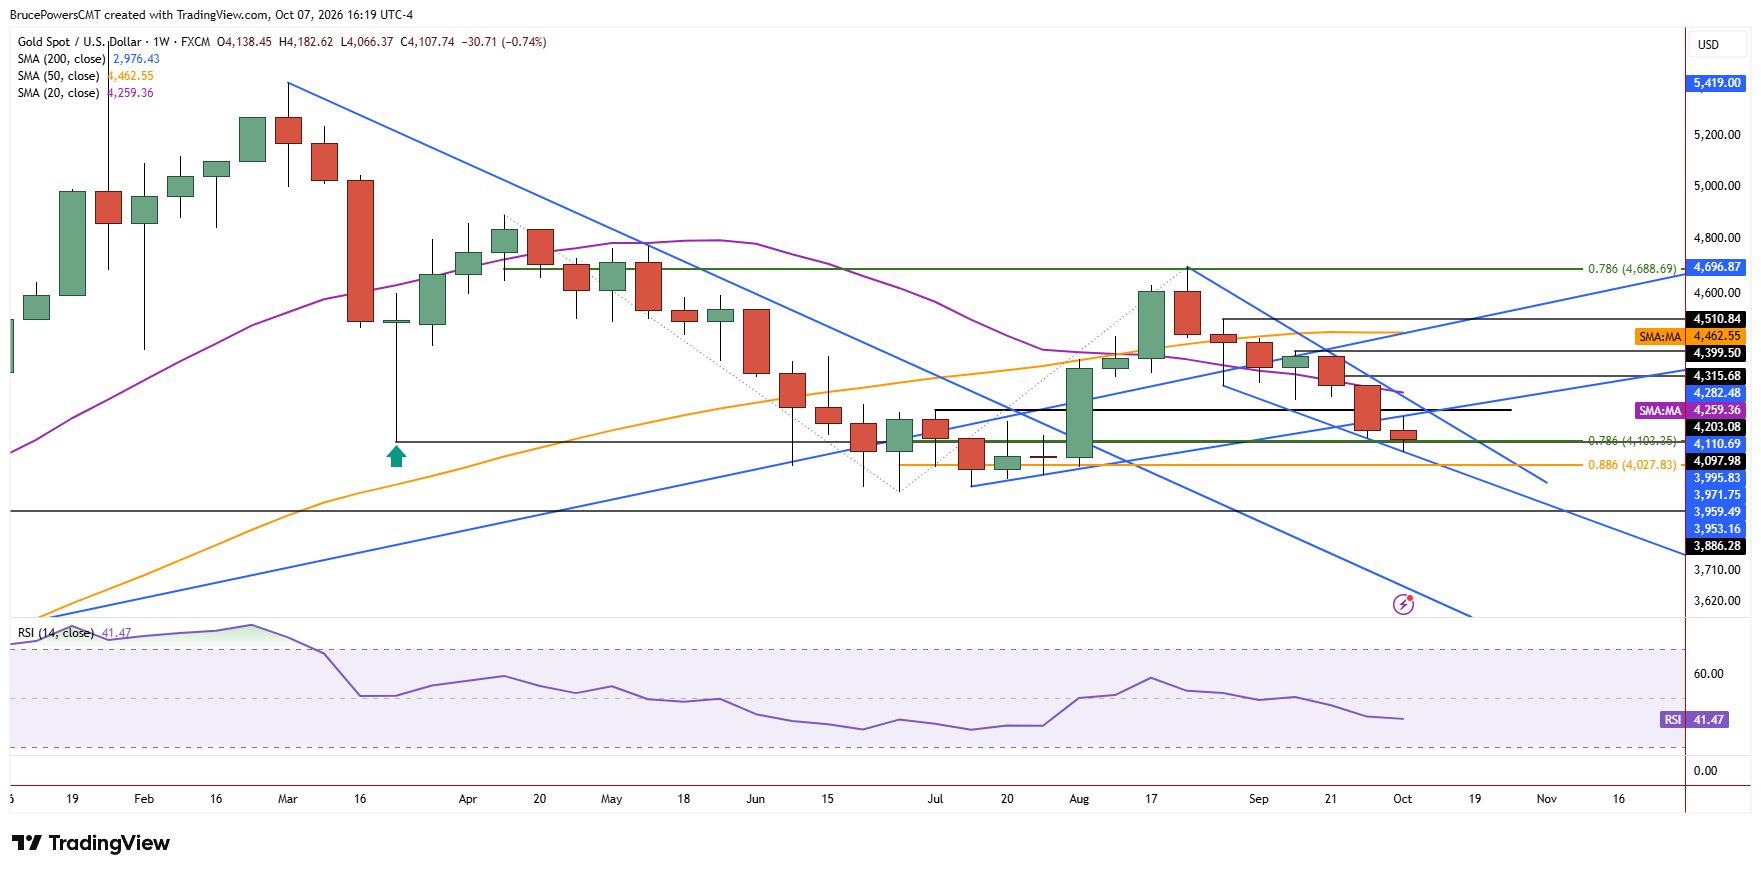
A continuation of the long-term bearish trend structure would signal on a drop below the June low of $3,942. That level is quickly followed by a potential support zone defined by the higher swing low of $3,886 from October. Further structural damage to the long-term bullish trend would occur on a drop below that level.
Falling Wedge Keeps Reversal Scenario Alive
Alternatively, gold continues to test support, but it holds above the June low. There is a potential falling bullish wedge that has formed in gold that suggests the potential for an upside breakout of the pattern. Currently, that would signal on a move above last Friday’s lower swing high of $4,226. A breakout of the wedge would strengthen a reversal signal, as it adds to the bullish technical evidence.
Six Weeks of Deteriorating Price Structure
This is the sixth consecutive week of lower weekly highs and lower weekly lows, which define a downtrend. Although this doesn’t show exhaustion, it does indicate the decline is likely closer to the end than the beginning. Nonetheless, the reaction of price at resistance of $4,226 and support at $4,066 should provide the next clue about direction.


