



USOil: Gulf Storm Threatens Production as Fuel Supply Stays Tight
Tight crude fundamentals developed on Wednesday with the threat of a gulf storm to offshore production and refining. The storm has the potential to become the first hurricane of the season and is heading toward energy infrastructure that is responsible for 15% of U.S. crude oil and 5% of natural gas production. A number of large refineries are also situated in that infrastructure. Tight crude oil fundamentals are not helping the distillate markets which are already tight.
According to the EIA, East Coast distillate inventories were 32% below their 5-year average seasonal inventories in September. The EIA expects inventories to remain between 20% and 30% below their five-year average through the winter.

UKOil: Middle East Supply Risk Revived by Saudi-Houthi Tensions
Tensions between Saudi Arabia and the Houthis are heightening, increasing the potential for a disruption in the flow of crude oil from the Middle East. Because of the implications to global supply, the clock is ticking on how long prices will be supported.
More recently, Brent has been more impacted by infrastructure and shipping risk than by balancing short supply. Houthi attacks on Saudi targets, including claimed strikes on Saudi Aramco facilities, have raised the specter of further disruptions to global energy infrastructure. Concerns relating to U.S. and Iran persist. Saudi Arabia has been using its East-West pipeline to bypass the Strait of Hormuz, to ship about 4 million bpd to the Red Sea. The rest of the Gulf’s crude and condensate exports have been on the mend, reaching about 91% of pre-war levels in September, but rebalancing of refined products has lagged, leaving markets very tight, especially for diesel.
Global stocks are also very low. This week, energy industry executives said more than 1 billion barrels had been withdrawn from commercial stocks since the Middle East crisis began, while governments have also tapped emergency reserves, and that this reduced the ability to absorb further shocks.
Natural Gas: High Storage, Rising Demand for LNG
Compared to oil, fundamentals for natural gas remain well supplied. Per the EIA, U.S. natural gas storage as of the end of September was about 3,523 Bcf, and is forecast to reach about 3,850 Bcf by the end of October, or about 2% above the five-year average.
Natural Gas Price Forecast
Every new Natural Gas analysis as it publishes, today's technical signal and key levels, live price — on one page.
See all Natural Gas forecastsNatural Gas Technical Analysis: NG Holds Above $3.00 as $3.10 Becomes the First Upside Test
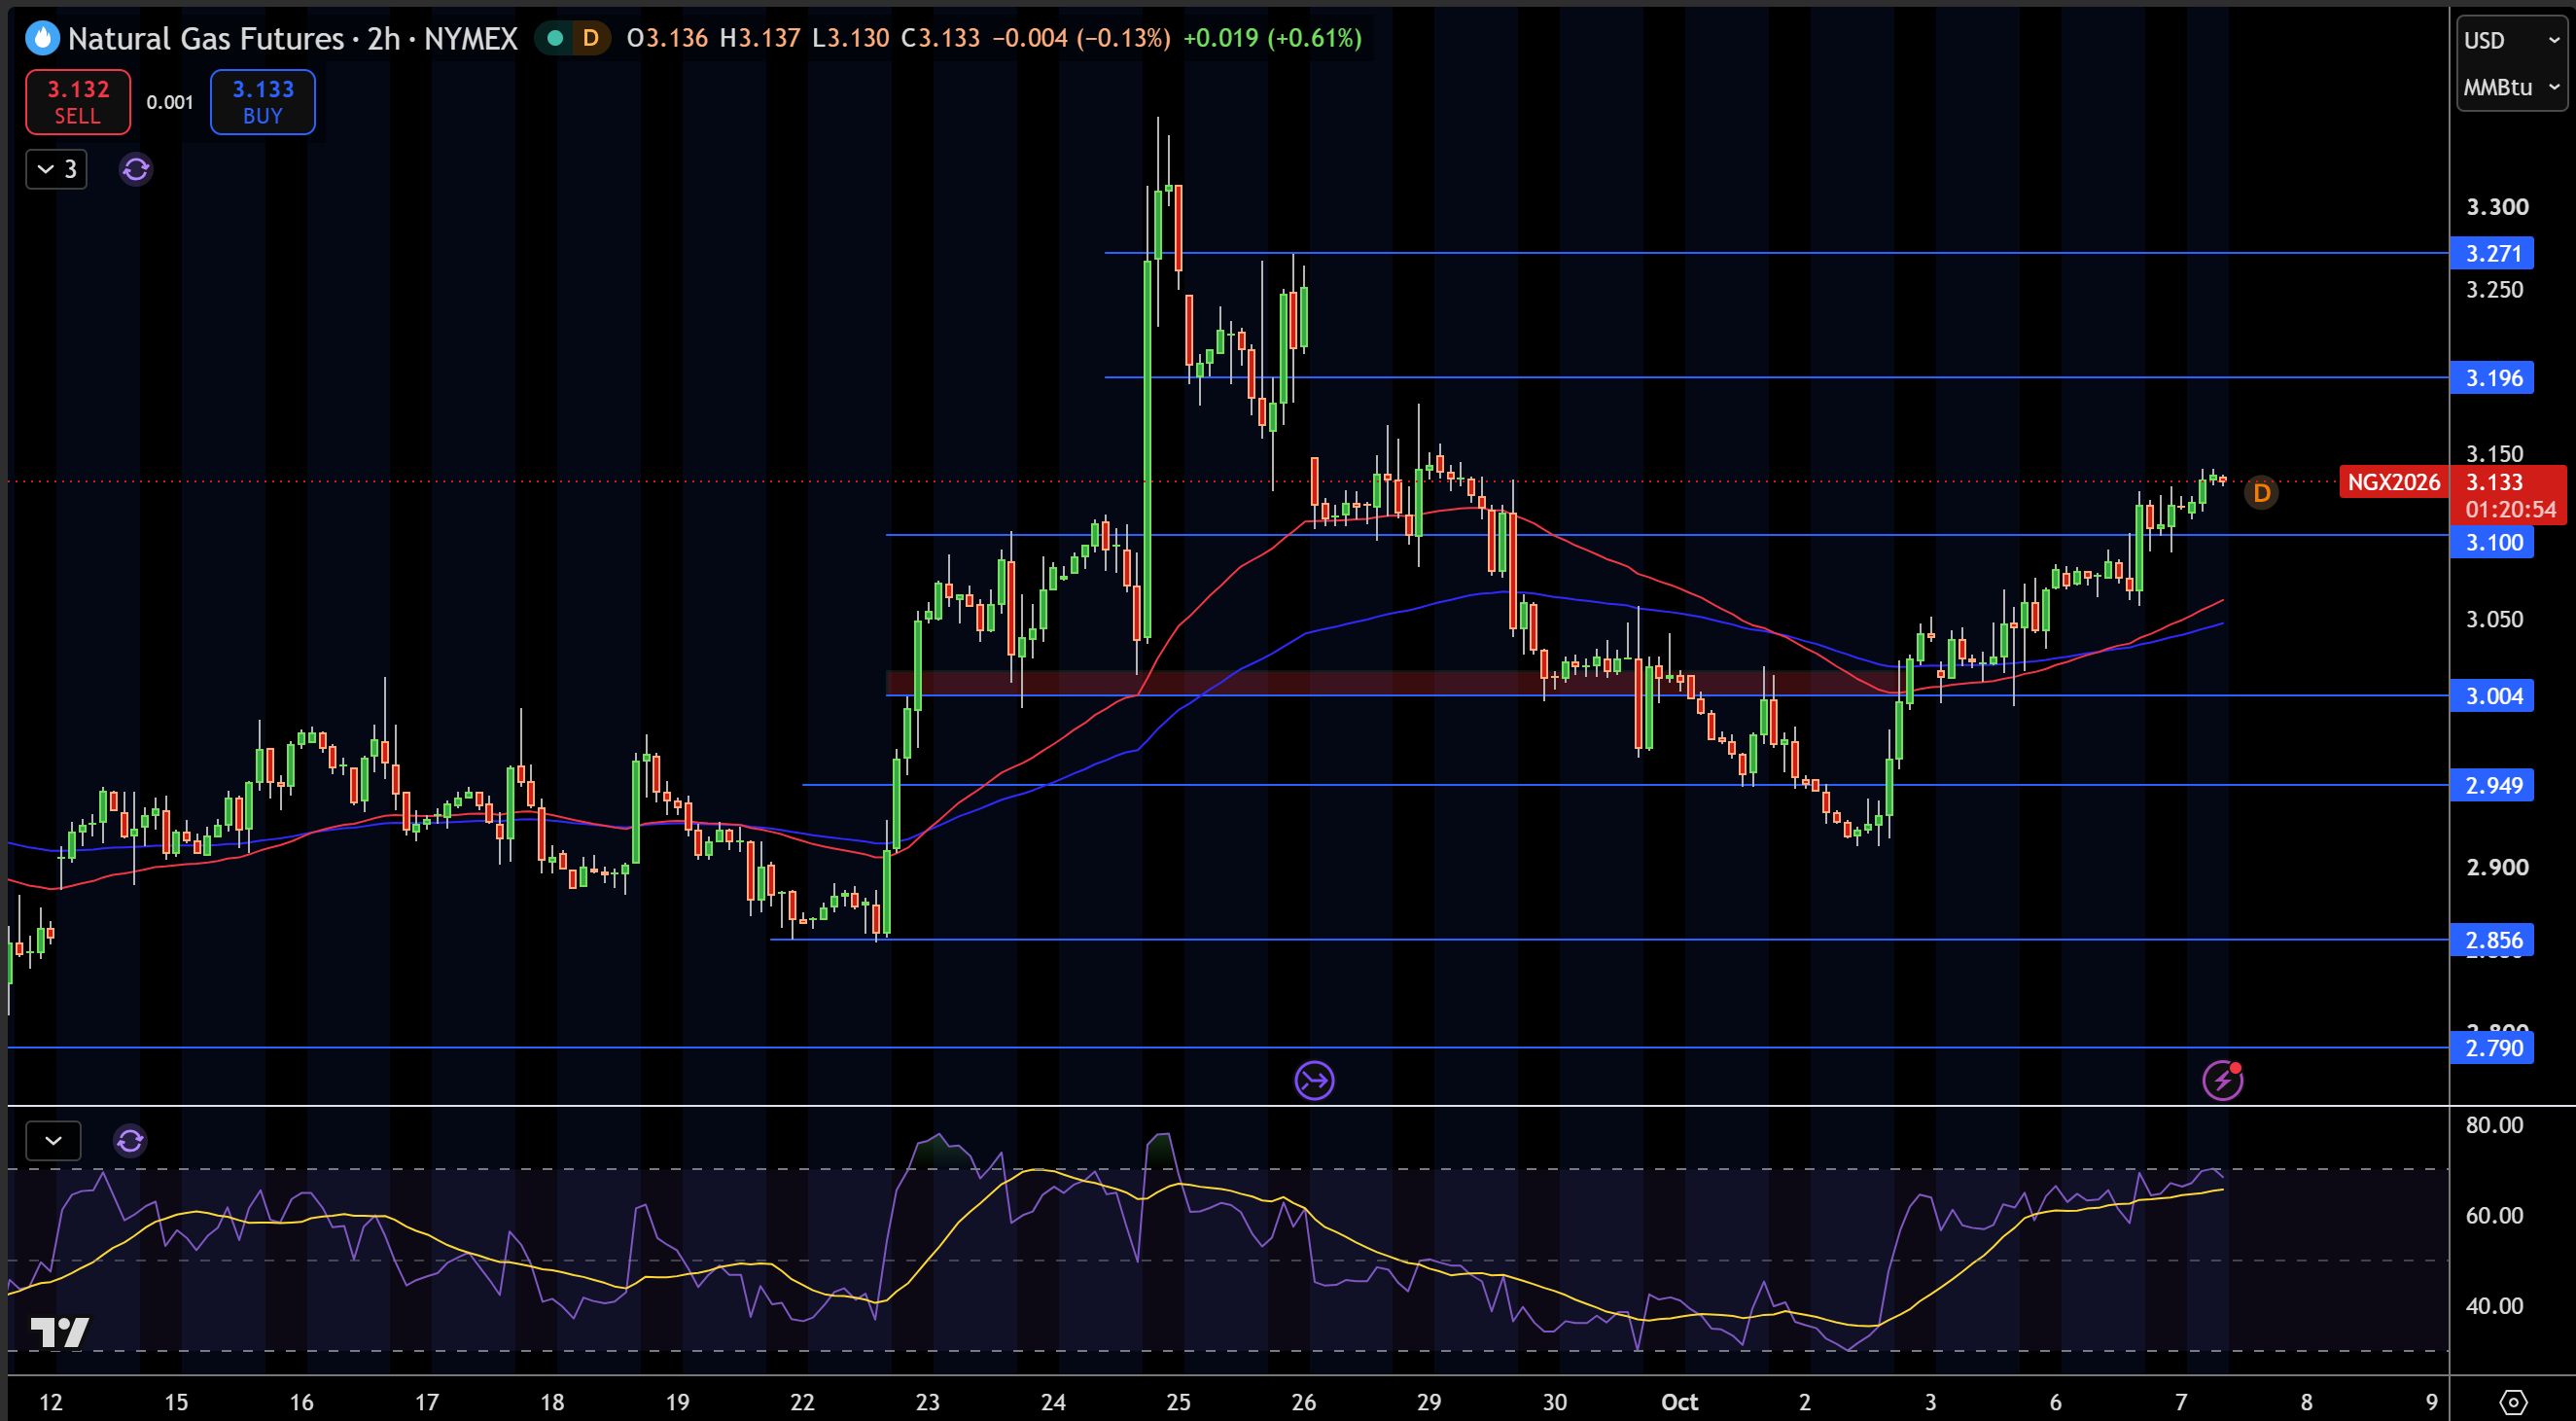
Natural gas is hovering around $3.08 on the 2-hour chart, recovering from the $2.95 area and moving above both moving averages. The thing that stands out to me is that price has reclaimed the $3.00 area, and the RSI has also improved to the upper half of its range.
The first area of resistance I’m watching is at $3.10. Above that, I’m looking at $3.20, and then $3.27. If we move below the $3.00 area, the next support is $2.95, and then $2.86 and $2.79.
Looking at RSI, it’s also improved to the upper half of its range. Short-term, that leaves the bulls in control. I’m looking for price to recover and hold above $3.00, and if that’s the case, I think $3.10 and then $3.20 and $3.27 are next. I’m looking for a move below $2.95 to give a better view of that rally.
WTI Crude Oil Technical Analysis: USOIL Rebounds From $86.89 as $90.64 Becomes the First Recovery Test
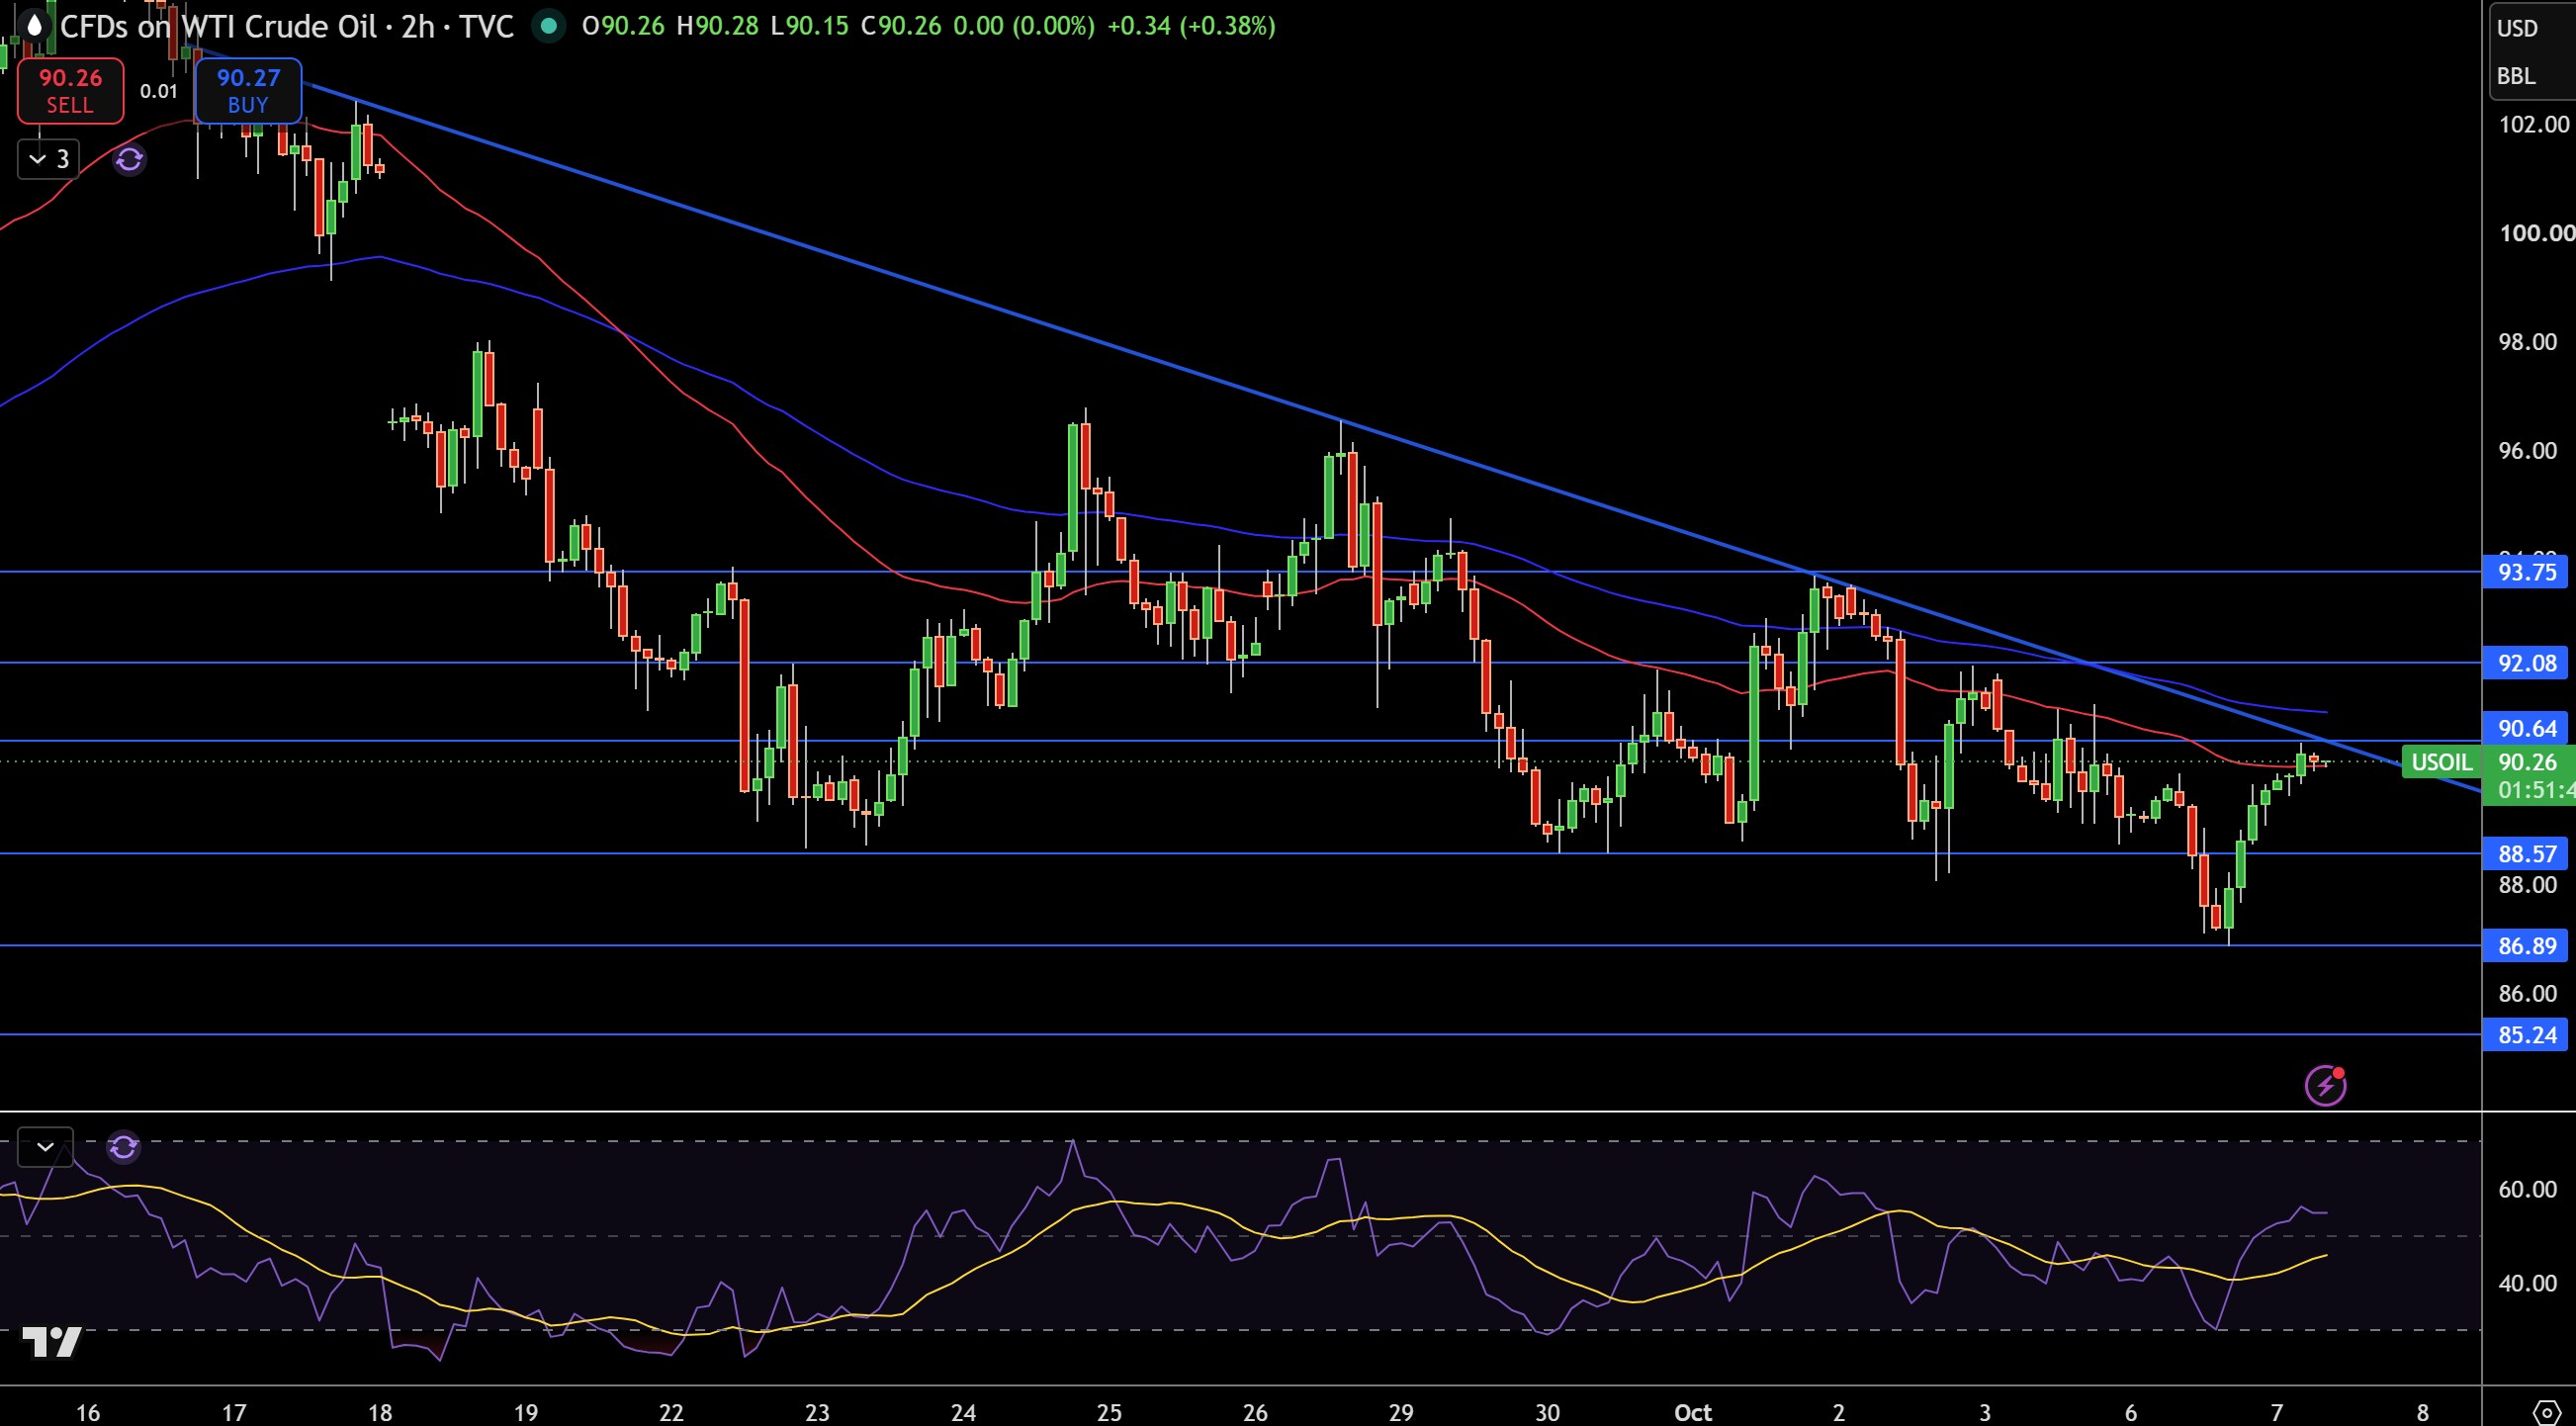
WTI crude oil is currently at $90.26 on the 2-hour chart after a strong bounce from $86.89. Currently price is in the range between the descending trendline and the short term moving averages, but the bigger picture shows lower highs, which makes the rebound constructive in the very short term, but not in a clear uptrend.
$90.64 is the first resistance. If price moves above $90.64, then the next targets would be $92.08 and $93.75. If price breaks support at $88.57 and $86.89, then $85.24 would be in play. RSI has also recovered toward the midline, showing that downside momentum has lessened.
If WTI trades at $88.57 and higher, I would be bullish. I would become bearish if price trades below $88.57. A trade above $92.08 would be bullish and a trade below $86.89 would be bearish.
Brent Crude Oil Technical Analysis: UKOIL Holds $98.71 as $103.89 Remains the Key Breakout Level
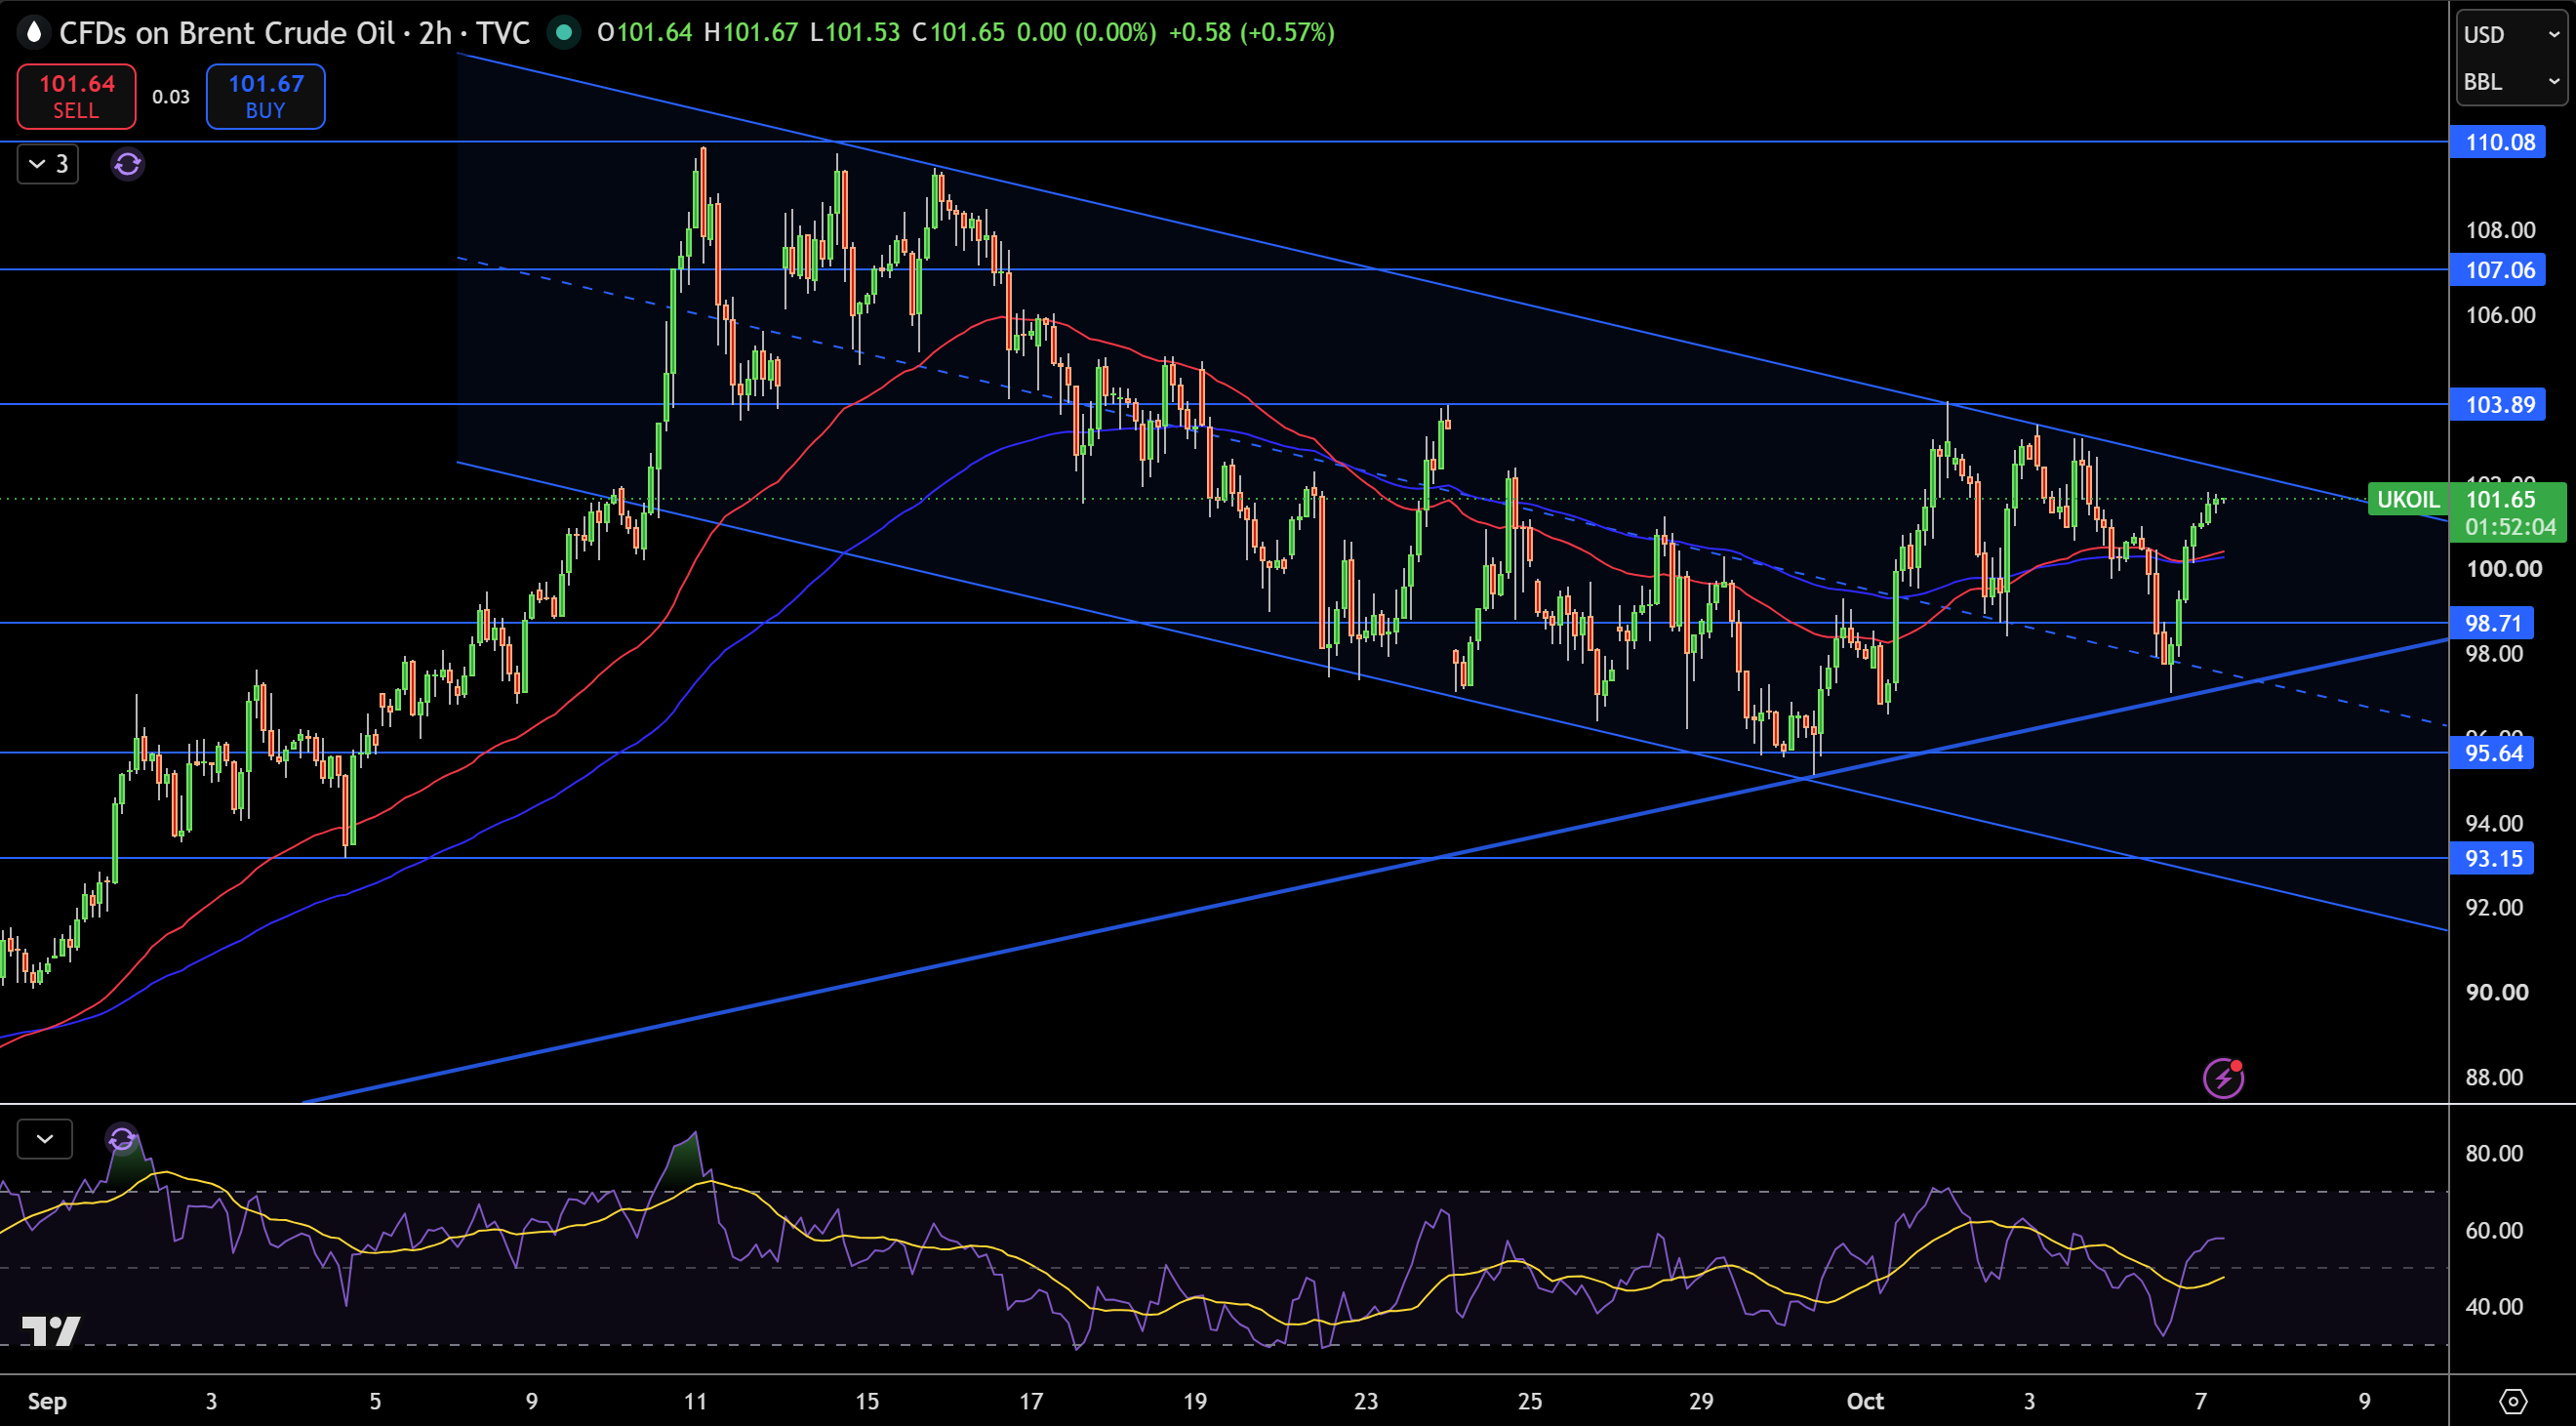
Brent is trading around $101.65 on the 2 hour chart, having bounced from $98.71. What is interesting here is that price is currently sitting above both moving averages and testing the top end of the broader descending channel. Brent is also showing stronger signs of a move up compared to WTI, however the trendline is still the key area to watch.
The key first resistance is at $103.89, a break above that shows us the next resistance at $107.06, with the final resistance at $110.08 just above that. Looking at support, $98.71 is the key first area, with support at $95.64 and $93.15 potentially coming into play if the recovery is unsuccessful.
RSI is holding above the midline showing an improvement in the overall trend. The bullish bias is strengthened as long as Brent stays above $98.71. An even stronger bullish bias would be introduced with a clear break above $103.89 showing an improved chance for a move to $107.06. Conversely, a break below $98.71 would support the bearish bias.


