


$88.66 Support Triggers a Bullish Response
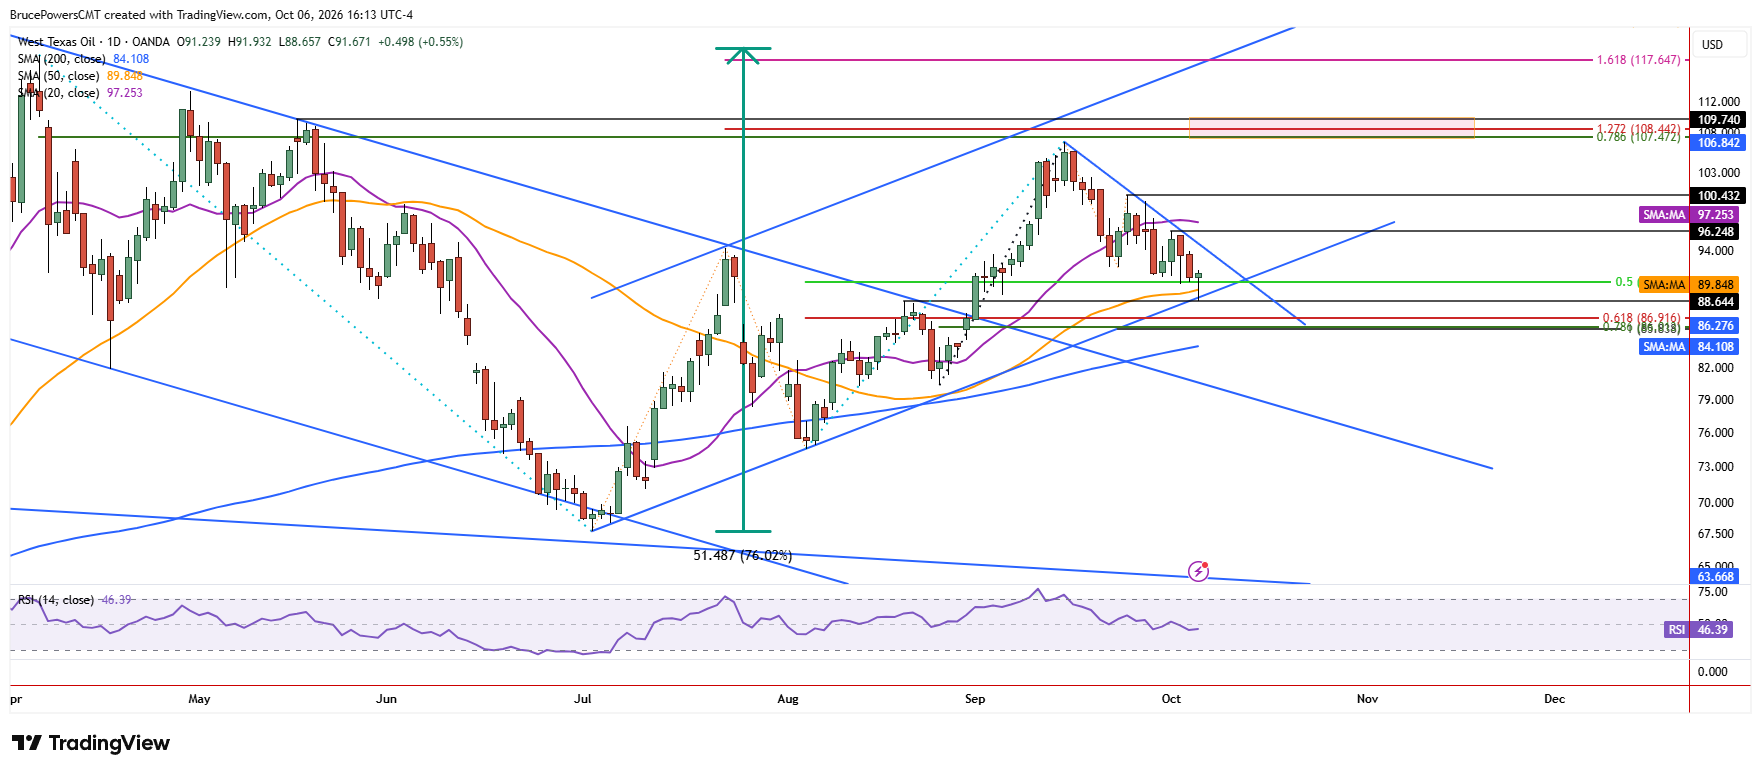
WTI crude oil showed signs that its current pullback may have ended after declining to $88.66 on Tuesday and finding support at the August swing high of $88.64. An initial break below the 50-day moving average earlier in the session failed to follow through and instead buyers took control and drove back the price back above that average and the prior low of $90.51 from Friday.
Consequently, crude oil is on track to end the session with a bullish hammer candlestick pattern, reflecting a shift from sellers controlling the session initially to buyers taking and retaining control. A move above Tuesday’s high would provide confirmation that this shift has been translated into a short-term bullish reversal.

Rising Channel Keeps Bulls in the Picture
Failed patterns can lead to sharp moves in the other direction. Support on Tuesday was reinforced by a rising trendline that converged near the same price area. A decisive advance above Tuesday’s high would signal a one-day bullish reversal following the hammer pattern and establish a higher swing low. The confluence of support near the lower boundary of a rising trend channel indicates that the bullish channel structure remains in force. This keeps the broader advance intact despite the recent pullback and strengthens the case for a recovery if Tuesday’s low holds.
Higher Targets Come Into View
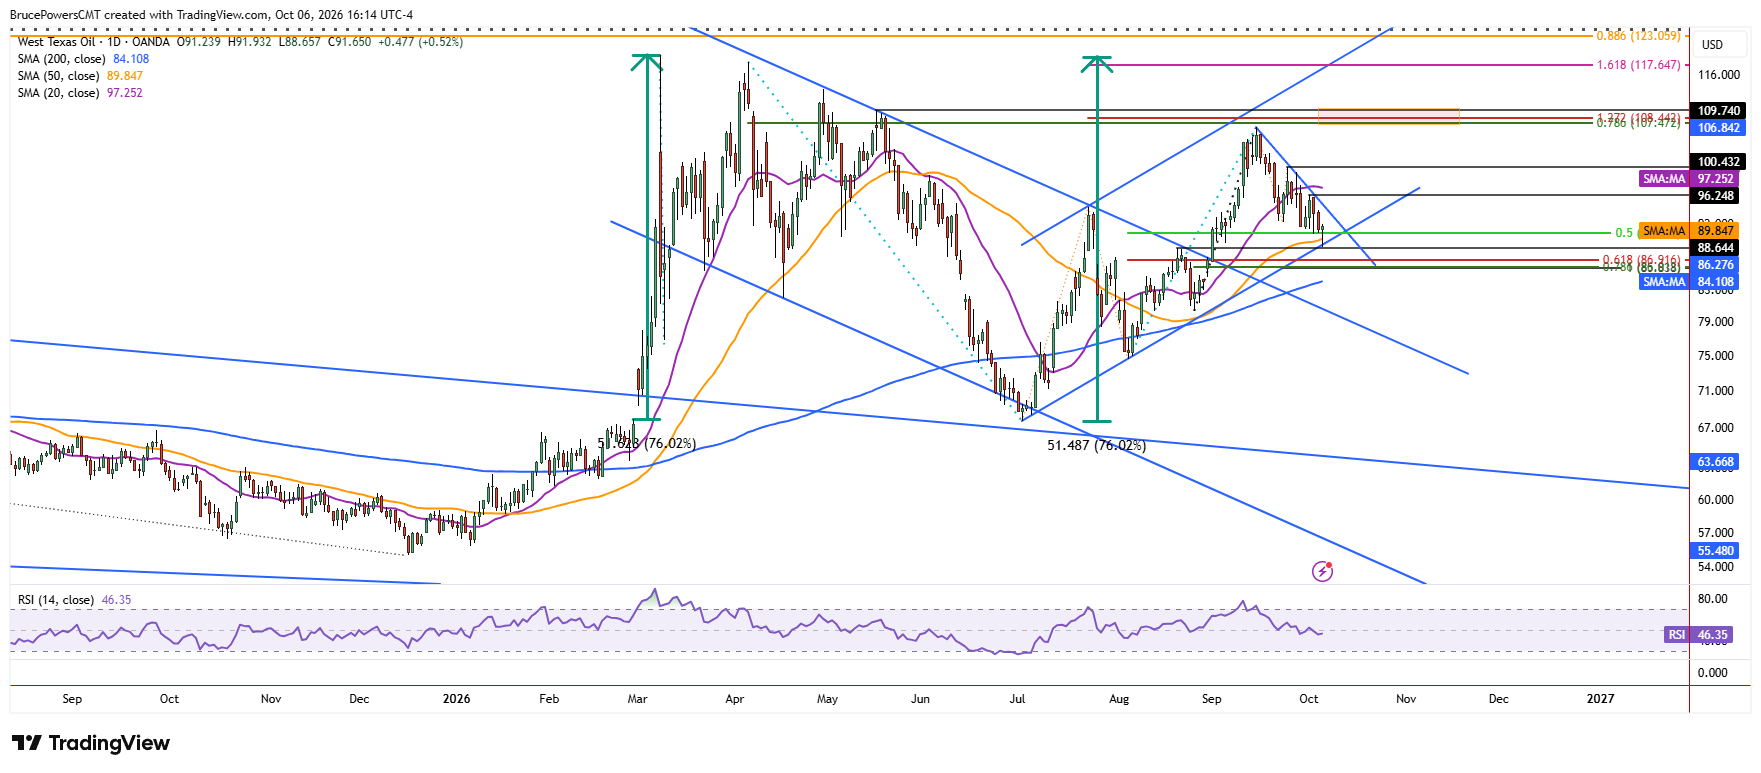
The first upside target for a breakout is the recent interim lower swing high of $96.25, followed by the lower swing high of $100.43. Nonetheless, the channel structure suggests that the top boundary of the pattern could eventually be tested. Therefore, the recent peak of $106.84, along with the confluence of several indicators between $107.47 and $109.74, defines a potential resistance range above that peak. A sustained advance through the intermediate swing highs would therefore open the way toward that broader resistance zone.
50-Day Average Becomes a Key Test
If Tuesday’s high leads to a break above resistance and confirms the formation of a higher swing low, the first notable test of support at the 50-day moving average will have been completed. After reclaiming that average in August there was one quick pullback to test it as support, but the current pullback is a wider swing and carries greater significance.
The successful defense of the 50-day moving average, combined with support at the August swing high and the rising trend channel, adds weight to the underlying strength suggested by the bullish structure. For now, Tuesday’s low at $88.66 is the key reference point, while a move above Tuesday’s high would provide the confirmation needed to turn this potential pullback low into a more meaningful bullish reversal.


