


200-Day Average Becomes Critical Resistance
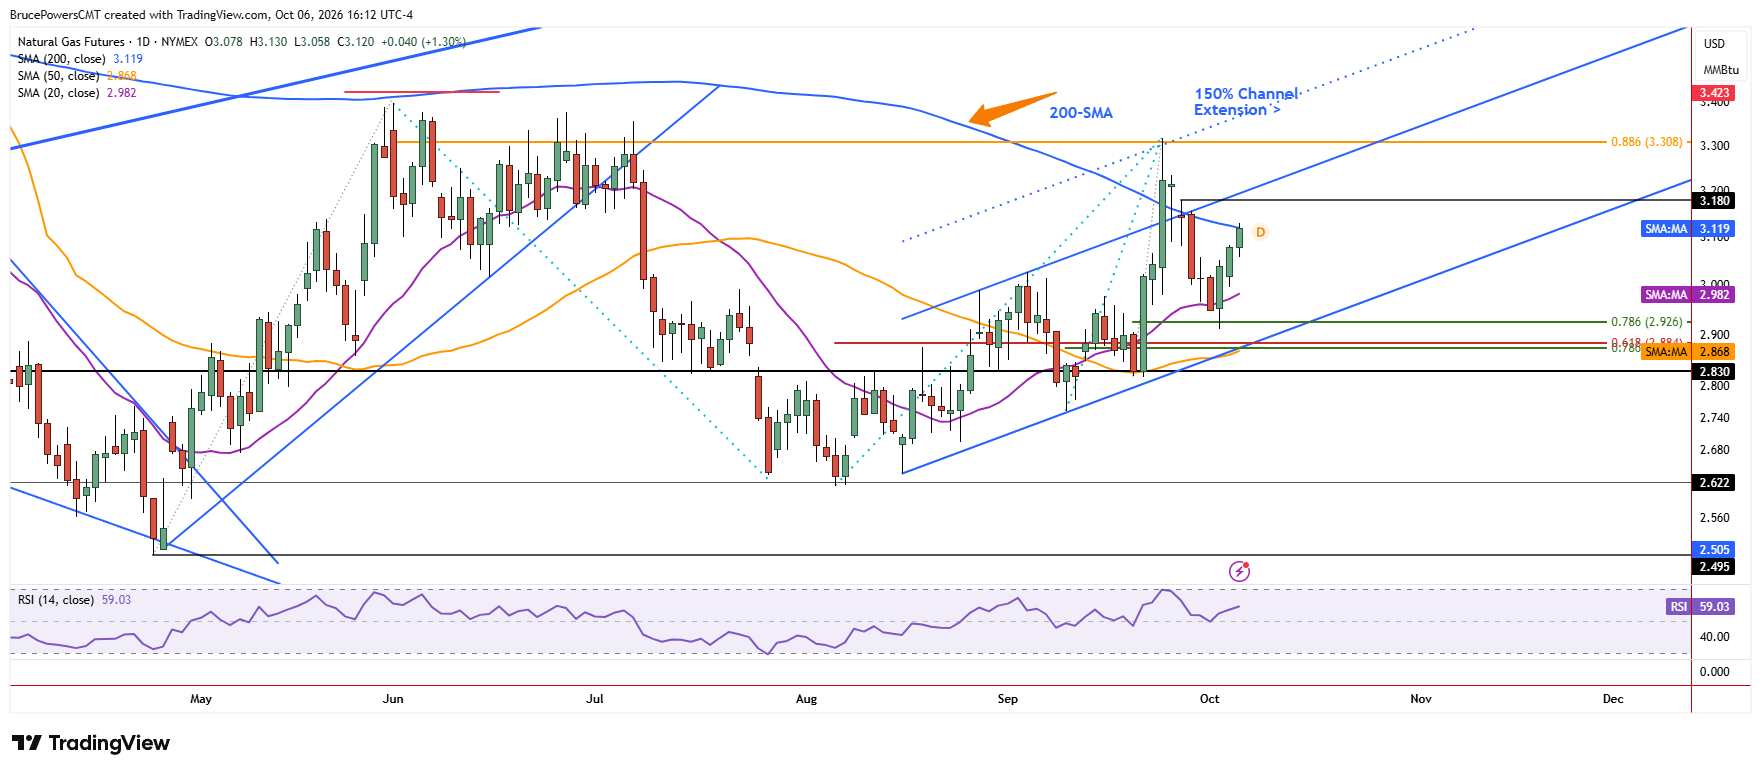
Natural gas extended its short-term advance to $3.127 on Tuesday, bringing it to a critical test of the 200-day moving average. The 200-day average near $3.12 marks key dynamic resistance for the trend and therefore represents the next important decision point. If natural gas can get above and stay above that average, it may be able to test higher potential targets. However, the current advance follows a failed attempt to reclaim that average two weeks ago, making a successful break and hold more important this time.

Weekly Support Strengthens Bullish Structure
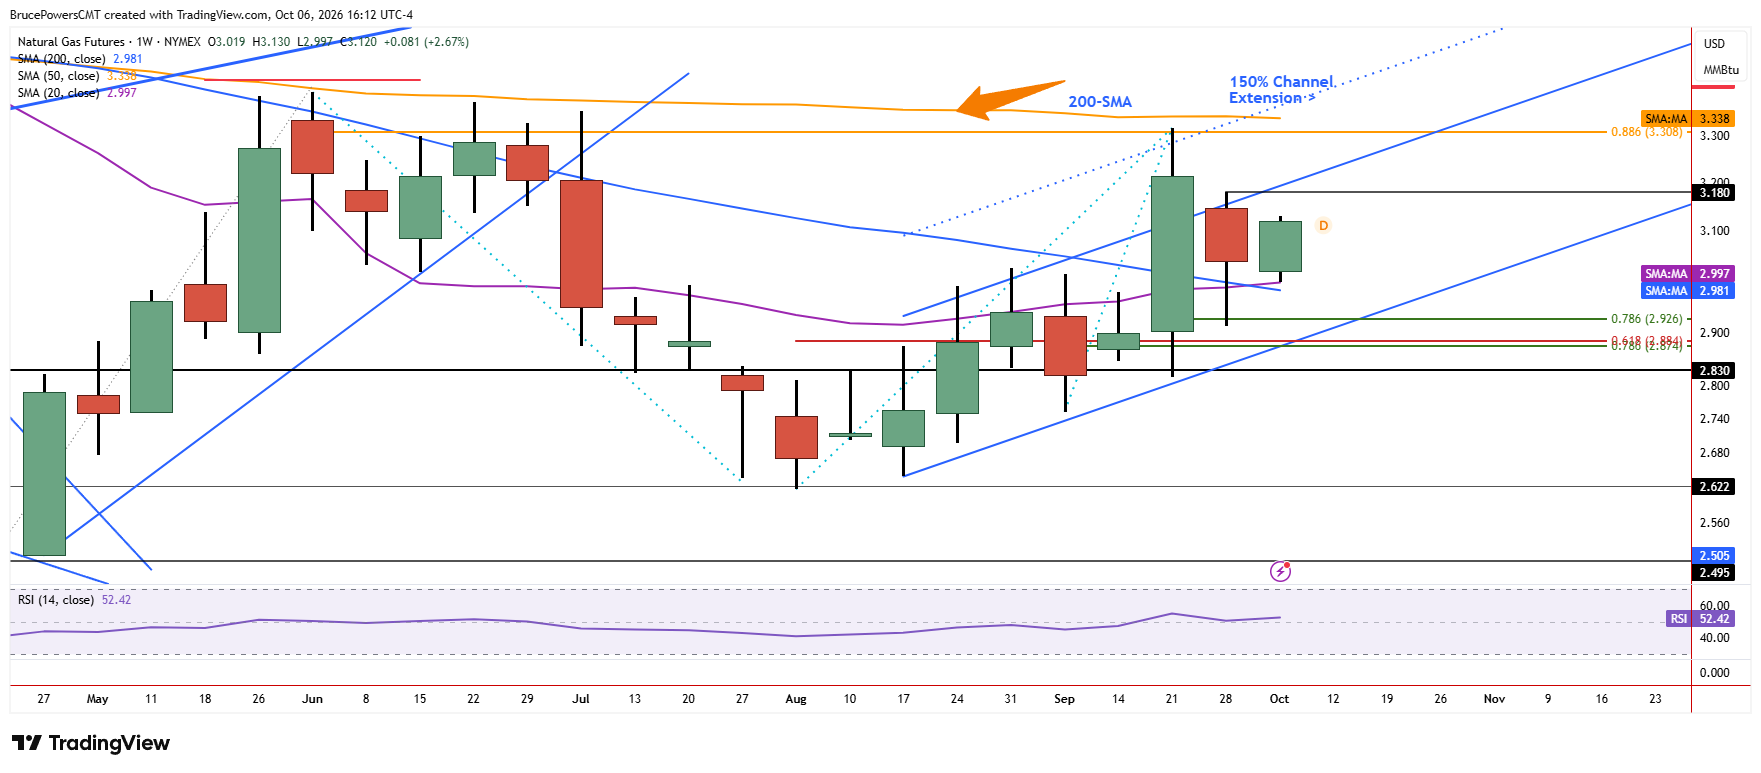
In the bigger picture, the weekly chart shows this week’s low of $2.997 followed by a rejection of lower prices at the 20-week moving average, reflecting support. Once prior resistance switches to support during an overall advance, it shows demand strengthening as the trend progresses. Consequently, unless there is a decline below the current low for the week, last week’s lower weekly high of $3.18 presents the next upside target on that timeframe. A move above $3.18 would further confirm that buyers are gaining control following the recent test of support.
Higher Low Supports Another Breakout Attempt
This setup supports the potential for another break above the 200-day moving average, and a second reclaim could have greater success than the first. But for now, the upper initial target is defined by the September peak of $3.317, with an earlier upside target near last week’s high of $3.18. Also supportive of further strength is the establishment of a higher swing low last week at $2.912, coinciding with the completion of a 78.6% Fibonacci retracement of the prior upswing. That higher low provides additional evidence that buyers are defending increasingly higher levels.
Compression Raises Stakes for Next Move
The weekly chart is also showing increasing compression of price as the range contracted last week, putting it inside the range of the prior week. Subsequently, this week’s range could extend that compression to a second inside week. Expansion follows compression, and a second consecutive inside week on the weekly timeframe could lead to a sharp move in price.
Given recent bullish indications, the more likely direction looks to be higher. That potential for expansion makes the current test of the 200-day moving average especially important, as a successful breakout would provide the clearest confirmation yet that the developing bullish structure can continue.


