



Gold: Fed Pause Hopes Collide With a Renewed Bond-Market Selloff
The big picture backdrop for gold is split. U.S. September employment data showed just 29,000 nonfarm payroll jobs created, and other months’ data was revised down. The data has significantly lowered expectations of another FOMC rate increase in October. Currently, the markets expect just a 23% chance of a rate hike in October, while November and December rate hikes remain priced in at a slightly higher level.
The relief is being offset by selling in the bond market. 10-year and 30-year Treasury yields are at 24-year highs. Along with persistent inflation, heavier government borrowing is putting upward pressure on yields. Add to that rising U.S. fiscal deficits and a stronger dollar, and you have even more inflation headwinds. The U.S. services sector, like the U.S. manufacturing sector, also shows strong demand, and elevated input costs. Long-lasting elevated costs and strong demand point to inflation remaining high and sticky for an extended period.
Despite the commodity rout, gold’s structural demand remains firm. Speakers at this week’s London Bullion Market Association conference reflected on gold’s role as a reserve diversifier due to geopolitical fragmentation and rising sovereign debt. As such, forecasts for central bank purchases remain firm at around 720 tonnes by 2026.
Silver: High Investment Demand More Than Offsets Softer Solar Consumption
Similar to gold, the USD and interest rate dynamics impact silver. The Silver Institute expects a sixth consecutive annual silver market deficit for 2026, even with a projected 1.5% increase in global silver supply. Physical investment for silver is expected to increase 20% to about 227 million ounces in 2026.
While consumption by solar manufacturers is expected to decline, there are several other industry sectors that are expected to increase silver consumption for 2026, including AI infrastructure and data centers, the automotive industry and electrical grid construction. In addition, the latest U.S. power sector data for 2022 reflect continued growth in the U.S. solar industry. In addition, data center electricity consumption is increasing as well.
Gold Technical Analysis: XAU/USD Tests $4,112 Support as $4,160 Caps the Recovery
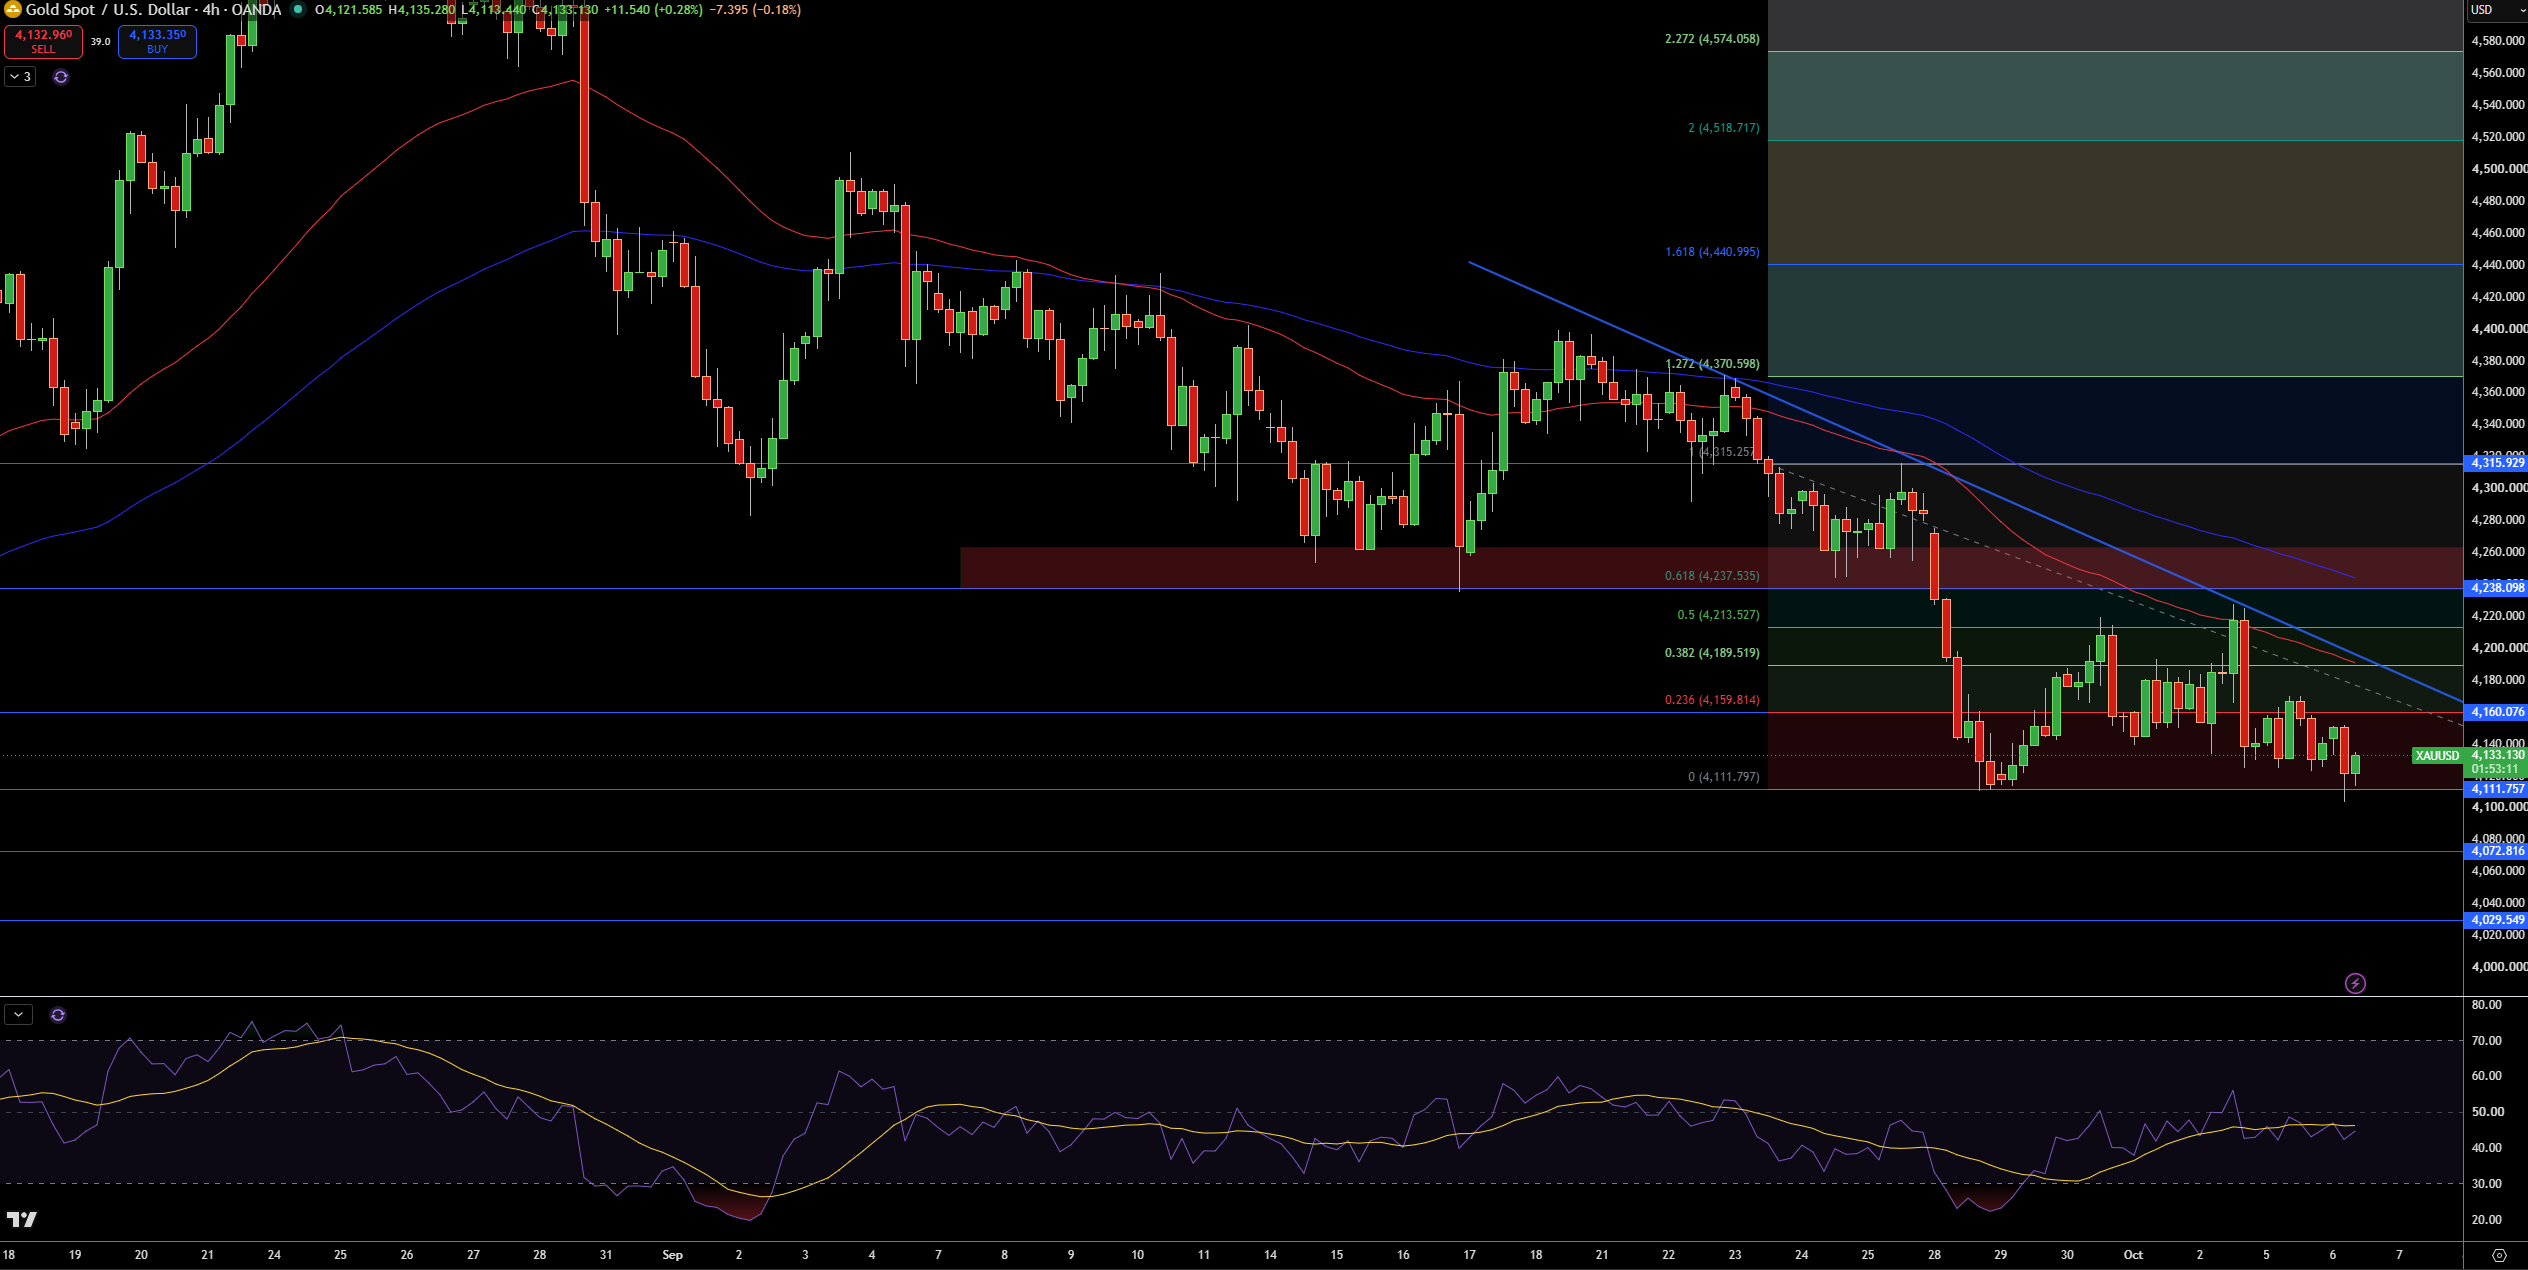
Gold is trading near $4,133 on the 4-hour chart. Currently price remains pinned close to the $4,112 support area after a failed recovery above $4,160. The broader structure is bearish as the price of gold is still under both of the moving averages and the descending trendline. The recent bounces in gold are also still producing lower highs.
The first area of support that I am watching is $4,112. A breakdown through $4,112 would bring about $4,073 and $4,030 in to play. Looking to the upside, $4,160 and $4,190 offer some resistance. Further resistance comes in at $4,214 and $4,238.
Gold Price Forecast
Every new Gold analysis as it publishes, today's technical signal and key levels, live price — on one page.
See all Gold forecastsRSI is in the lower half of its range which shows that momentum is still weak but not deeply oversold. Looking at the above, I am still inclined to look for lower prices, especially if $4,160 and $4,190 continue to provide resistance and the descending trendline continues to slop down. $4,214 would have to be taken out to give reason to change view to the upside, and a break below $4,112 would confirm lower prices toward $4,073.
Silver Technical Analysis: XAG/USD Holds $59.96 as $61.72 Remains the Key Breakout Level
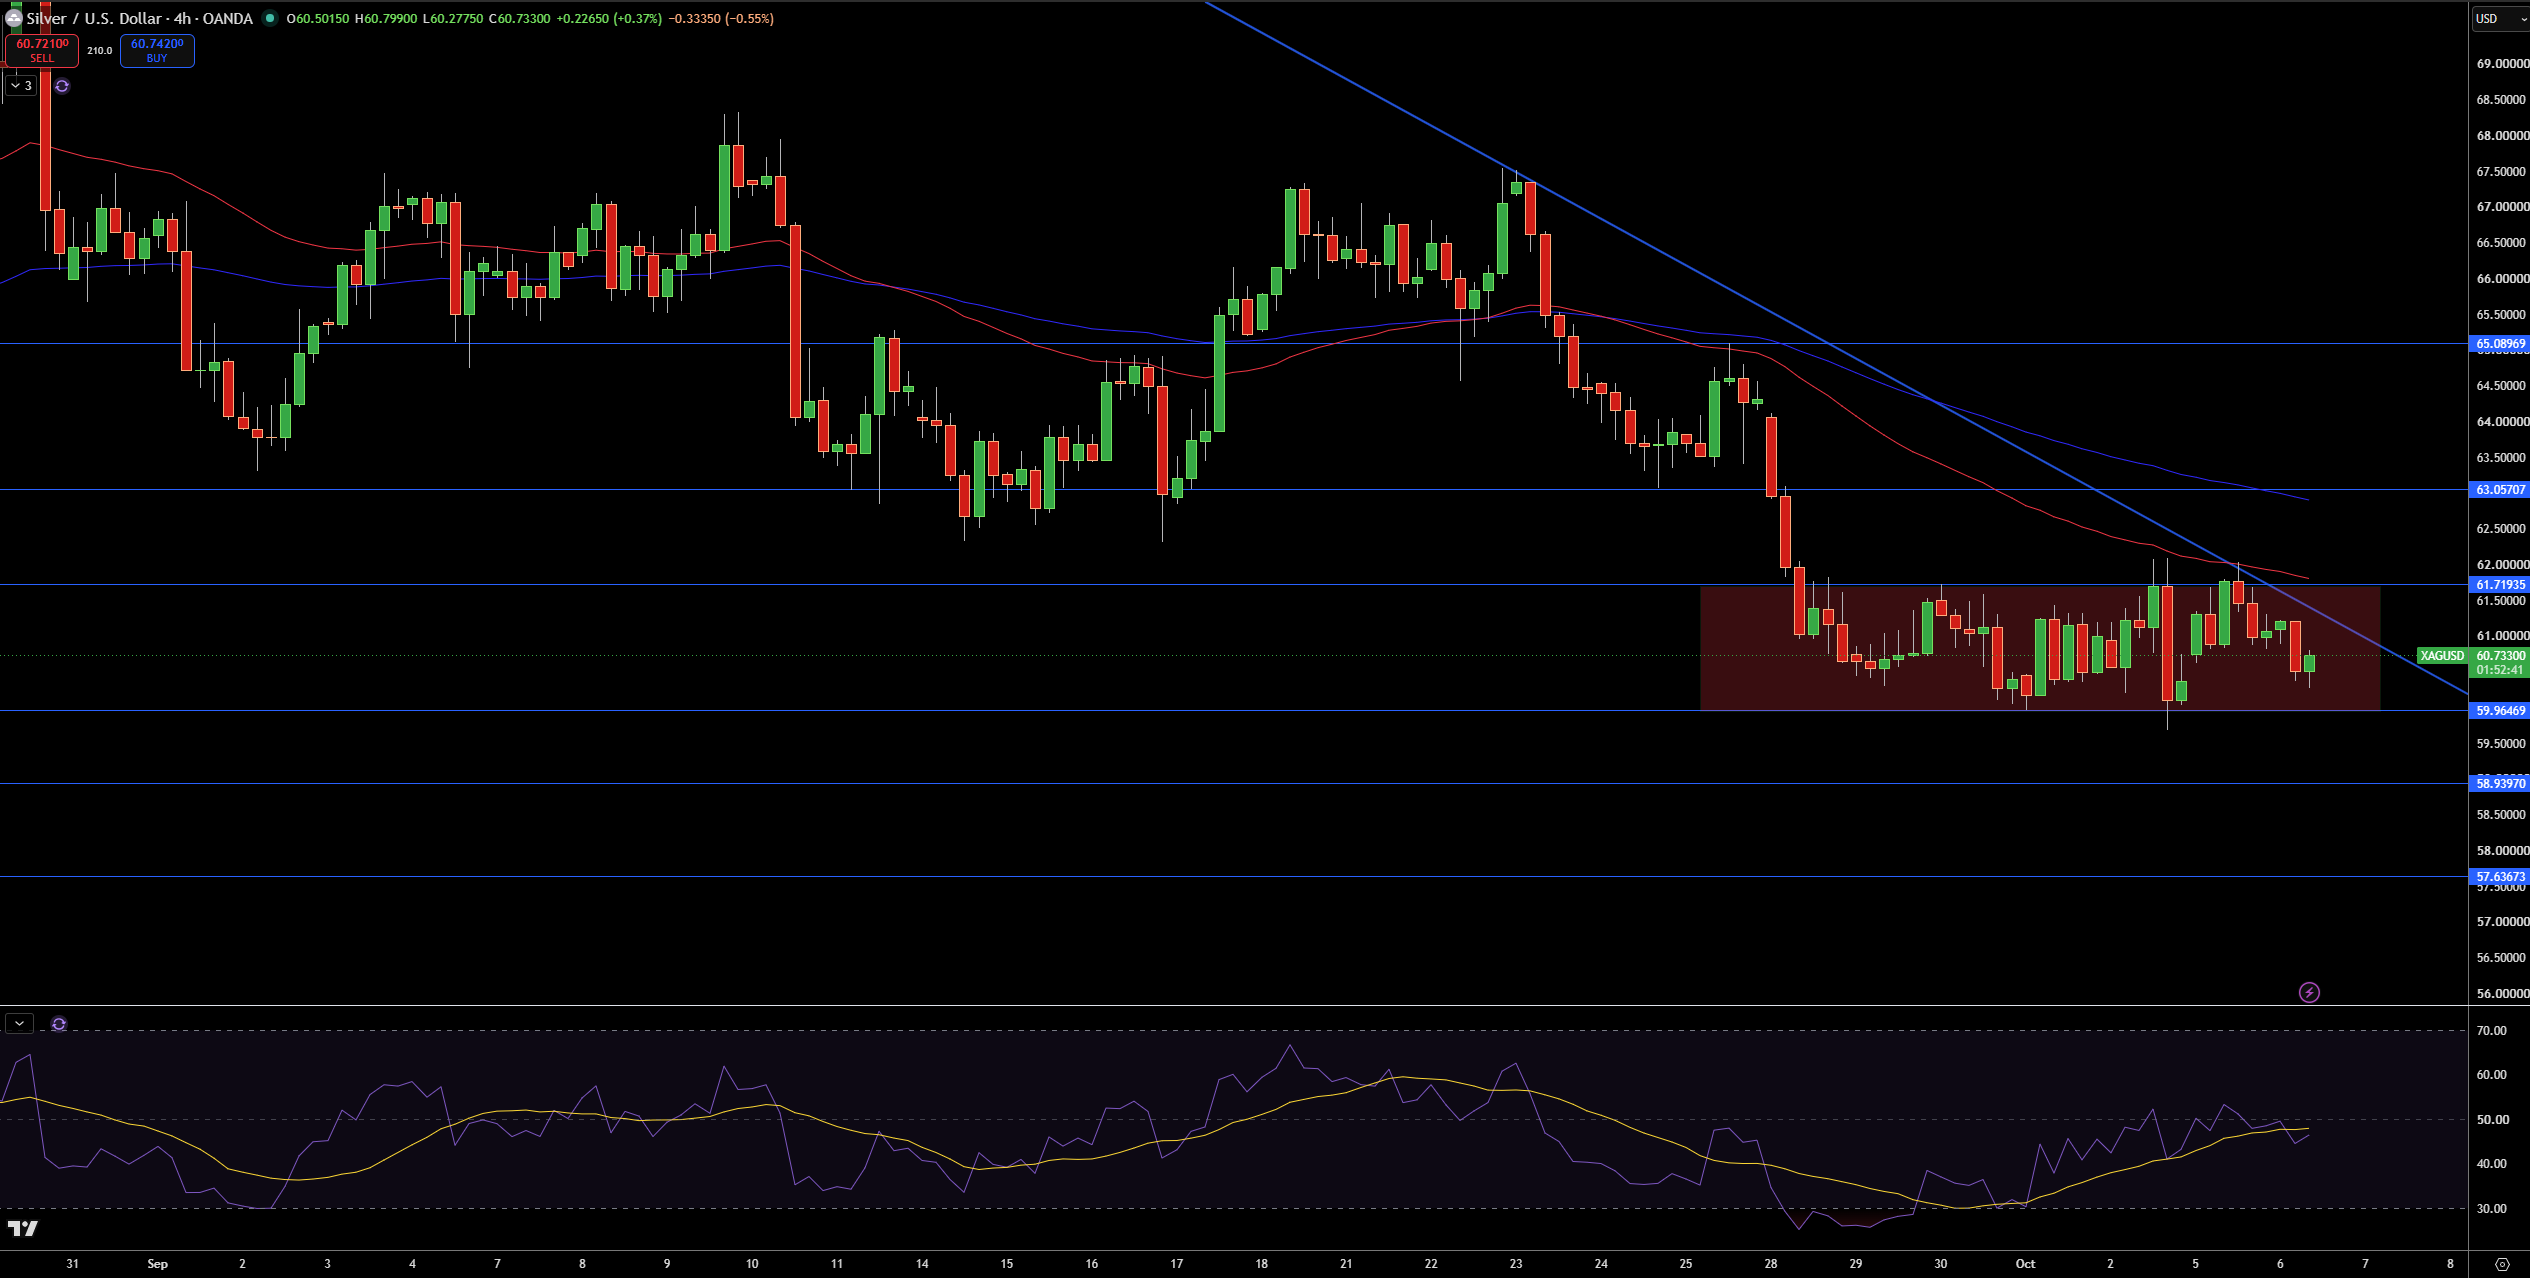
Silver (XAG/USD) is currently traded at $60.73. Last week, price tried consolidating above the $59.96 support area. Overall, the structure of the price action is still leaning towards the sellers in the 4-hour time frame, despite the recent sideways price move.
As long as Silver remains below the descending trendline and both moving averages, as well as $61.72, expect selling opportunities.
With the 4-hour time frame, the nearest resistance is at $61.72. The next supports below the 4-hour trend line is at $59.96, $58.94 and $57.64 respectively.
The RSI is at 50 indicating a neutral consolidation, neither favoring buyers nor sellers.
I will maintain my bearish bias while Silver is below the $61.72 and the trendline. A break above $63.06 will shift my focus to $65.09 and a break below $59.96 will validate a shift to the next support at $58.94.


