WTI Crude Oil Technical Analysis
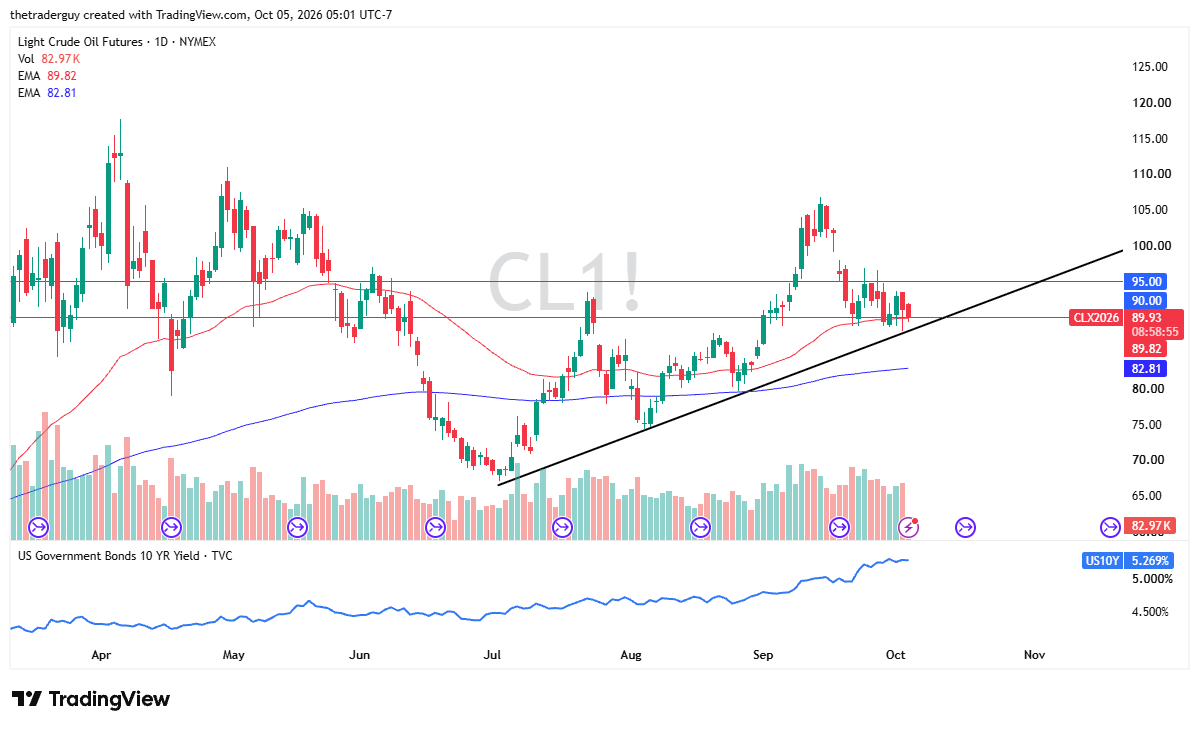
The crude oil markets find themselves on the back foot a little bit during the early part of the Monday session, with a lot of different things going on.
The light sweet crude oil market is currently right at the 50-day EMA and getting close to a trend line. The immediate bearish influence is coordinated intervention, as G7 countries agreed on Friday to release 100 million barrels of crude and diesel from emergency reserves while pledging to avoid energy export restrictions. Additional supplies can reduce some of the competition for available cargoes and ease some of the near-term shortages.
However, the market must distinguish announced volumes from actual deliveries. This is not always the same thing. The pace of distribution can change as the balance between crude and products—a refinery question—comes into the picture, and the destinations receiving supplies will determine the practical impact. A barrel of crude oil in one country is not necessarily going to be the same as in others.
Improving Middle Eastern exports reinforced that pressure. Shipping data cited by Reuters showed exports exceeding pre-war levels on 4 days during the final week of September. That was well-received news, and that is part of what sent light sweet crude down. Meanwhile, Saudi Arabia reduced its November Arab Light selling price to Asian customers by $3 a barrel. Although not shown on this chart, it does show some relief. Both developments suggest greater availability in the short-term future.
The big distinction though is going to be that there is a difference between crude availability and refined fuel.
This is going to be a story about refiners before it is all said and done. From a technical analysis standpoint, the light sweet crude market is at an area that a lot of traders will be watching for confluence. The 50-day EMA, the $90 level, and the trend line all at least offer some hope.

Brent Technical Analysis
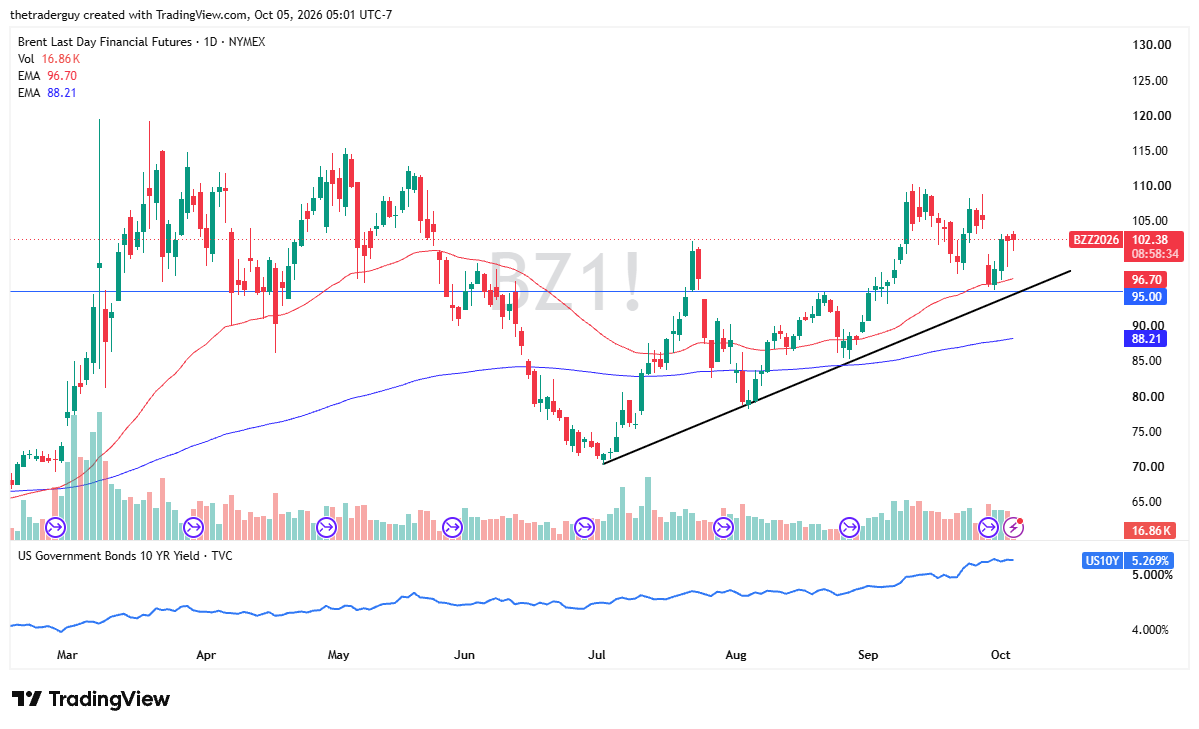
Brent markets have pulled back just a touch during the trading session as well but have bounced a little quicker. They are starting to form something akin to a hammer. We will just have to wait and see if that actually plays out for the rest of the session.
The Brent market is going to continue to be perhaps a little bit more sensitive to the Middle East than the light sweet crude market. So, that does make a certain amount of sense that there is a premium here. At this point, the psychological level that people are watching is the $100 level. In fact, that is part of what seems to be giving us a little bit of support here. We will have to wait and see if that actually matters in the end.
It is worth noting that the 50-day EMA sits right around $97 and is climbing as well, so that comes into the picture. Keep in mind that both of these benchmarks remain sensitive to the delivery conditions and geopolitical headlines, although one must admit those headlines are starting to have less effect on a day-to-day basis.
For now, WTI right around the $90 level and Brent right around the $100 level provide useful reference points, but convincing directional conclusions require sustained price action. I suspect at this point in time, choppiness makes more sense than anything else.
One example is U.S. inventories. The EIA reported commercial crude stocks increasing approximately 900,000 barrels to 427.3 million for the week of last week, putting inventories 2% above their 5-year seasonal average. Gasoline stocks, however, declined 1.7 million barrels, while distillates fell 2.3 million barrels.
In other words, we have got crude oil coming back, but it is the refining process that is now slowing down the flow of energy to cars, homes, etc. It is a process that will take some time. With that, these markets still see confusion and, of course, will be watching headlines.
Brent Oil Price Forecast
Every new Brent Oil analysis as it publishes, today's technical signal and key levels, live price — on one page.
See all Brent Oil forecastsIf you’d like to know more about how to trade natural gas, please visit our educational area.