



Copper (XCU) prices consolidate in a range after hitting the record level of $6.95 in September 2026. The broader trend for copper still remains bullish after gaining over 15% in 2026. The push by China to secure supplies and mitigate risks in Chile keeps copper availability in focus. The strong US factory orders offer support but the strong dollar and high cost of energy make buying more expensive. In my view, copper needs to stay above $6.50 and attract strong physical buying to recover. This article presents the developments in supply, market risks and technical levels that could shape the next move in copper.
Copper Fundamentals: China’s Supply Push and Mine Risks
China Seeks Copper Concentrate Supply Commitments
The effort by China to secure copper supplies puts shortages of raw materials in focus. China sought supply commitments for copper concentrates before approving the proposed $54 billion merger between Anglo American and Teck Resources.
Smelters use copper concentrate to produce refined copper. The request by China shows that it wants a steady supply of this material. If smelters cannot get enough, they may produce less copper. This could tighten supply.
Chile adds another supply concern. Codelco confirmed that it suspended activities in the crushing and material handling area at Radomiro Tomic after a fatal accident. The suspension covered that area, rather than the entire mine. Codelco did not quantify any loss in production. The impact on copper supply will depend on the duration of the pause and the effect on ore processing. A prolonged disruption could support the price.
The latest update by the Freeport shows that supply is also recovering. The company said that the Grasberg complex processed about 140,000 tonnes of ore per day during the third quarter. That was roughly 67% of its normal milling rate before the September 2025 incident.
Freeport expects to reach full capacity by the end of 2027. The total quarterly production of copper also met expectations at about 830 million pounds. The recovery should gradually add supply but full restoration remains some distance away.
Copper Price Forecast
Every new Copper analysis as it publishes, today's technical signal and key levels, live price — on one page.
See all Copper forecastsUS Manufacturing Demand and Rising Input Costs
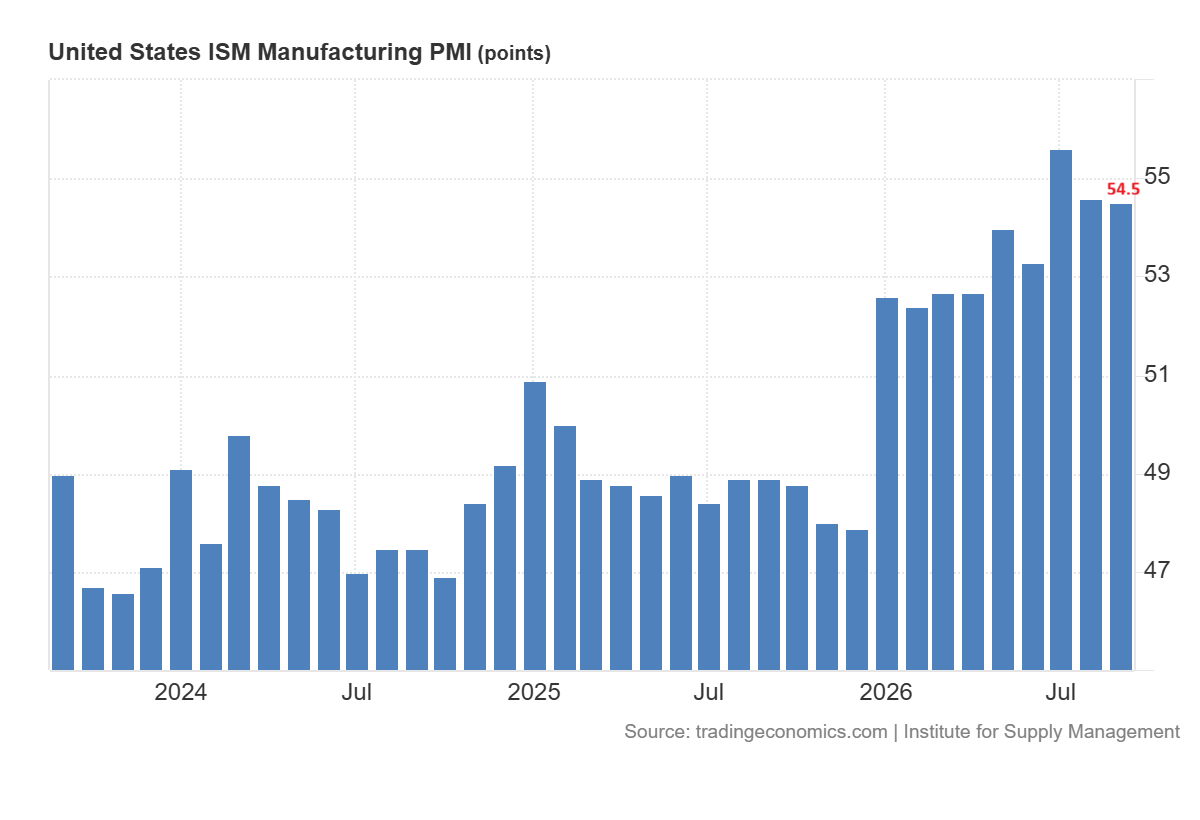
US manufacturing provides a clear demand signal. The chart below shows that the September manufacturing PMI was 54.5.
The new orders increased to 55.3 from 53.7.
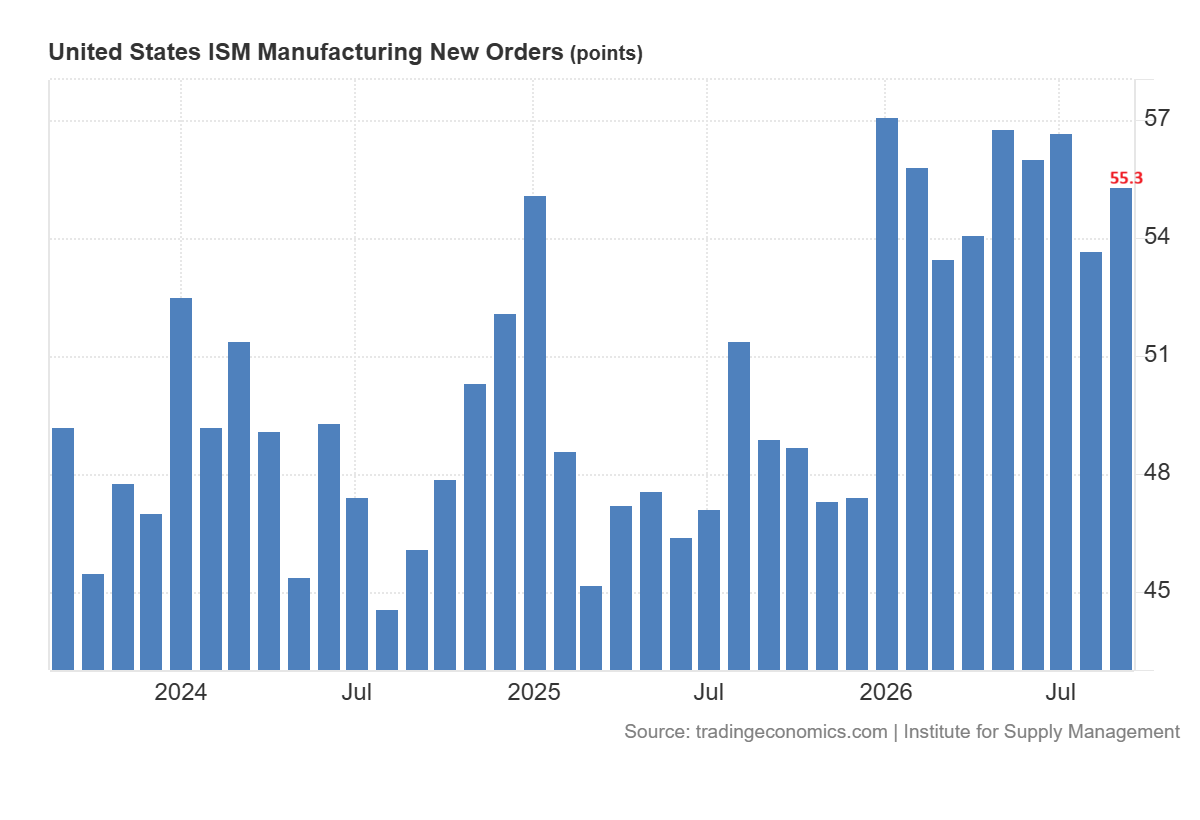
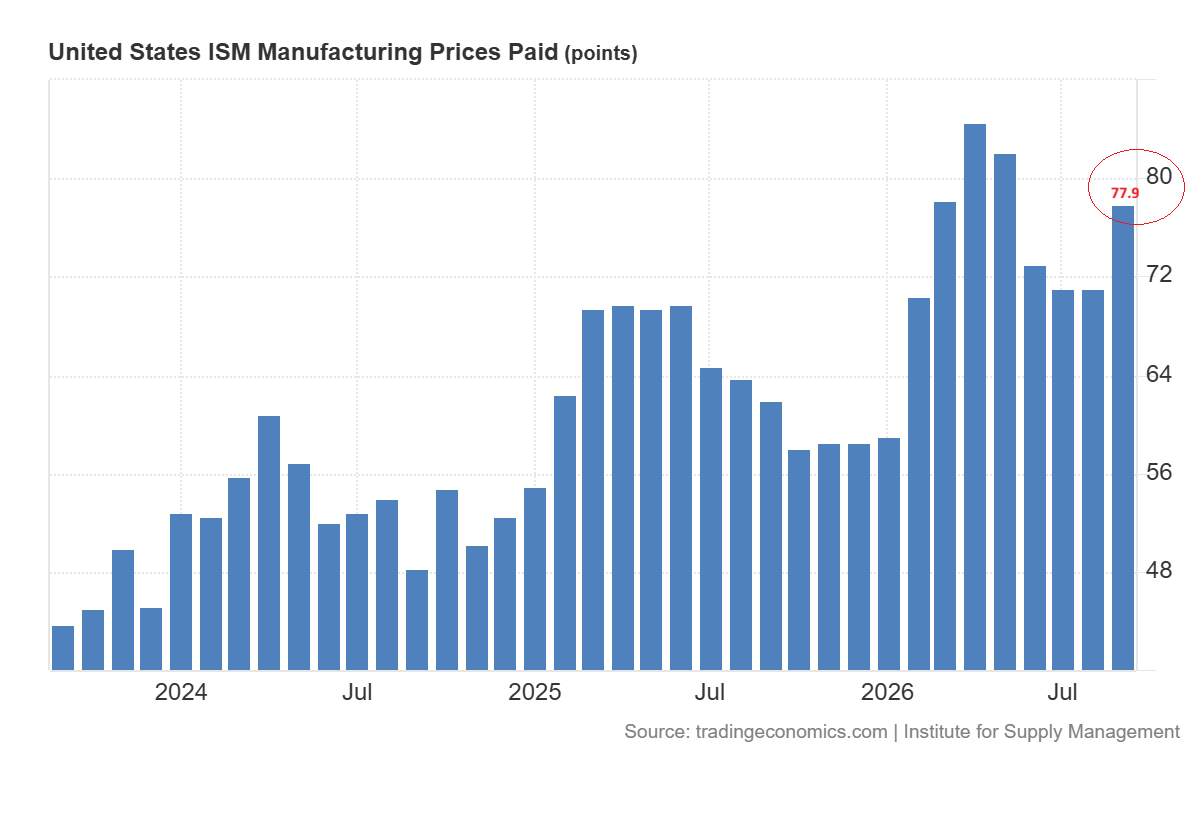
The survey respondents also listed copper in short supply for a third consecutive month. The strong orders support future factory production and the use of copper. However, the prices index climbed to 77.9 from 71.1. The increase in the cost of input could squeeze the margins for manufacturers and limit purchases.
The US dollar and the cost of energy remain immediate challenges. The dollar strengthened on Monday while Brent crude stayed above $100 a barrel despite a drop during the session. A stronger dollar limits the rally in the copper market in the short term. Moreover, the expensive fuel adds pressure across mining, transport and manufacturing.
In my view, the risk of supply and strong US orders can cushion the decline in copper. But a sustained recovery would need strong physical buying and less pressure from the dollar and energy costs.
Copper Price Forecast: Key Support and Resistance Levels
Long-Term Analysis: A Break Above $6.95 Could Bring $7.50 Into View
Copper prices maintain a healthy bullish trend despite the strong correction during the last few days. This bullish trend is observed in the long-term quarterly chart, which shows that the price broke above $6 in Q2 2026.
After the breakout, the copper price gained 6.84% in Q3 2026 and closed right at the resistance of the ascending channel pattern. If prices break above $6.95 in Q4, it will likely strengthen the rally towards $7.50.
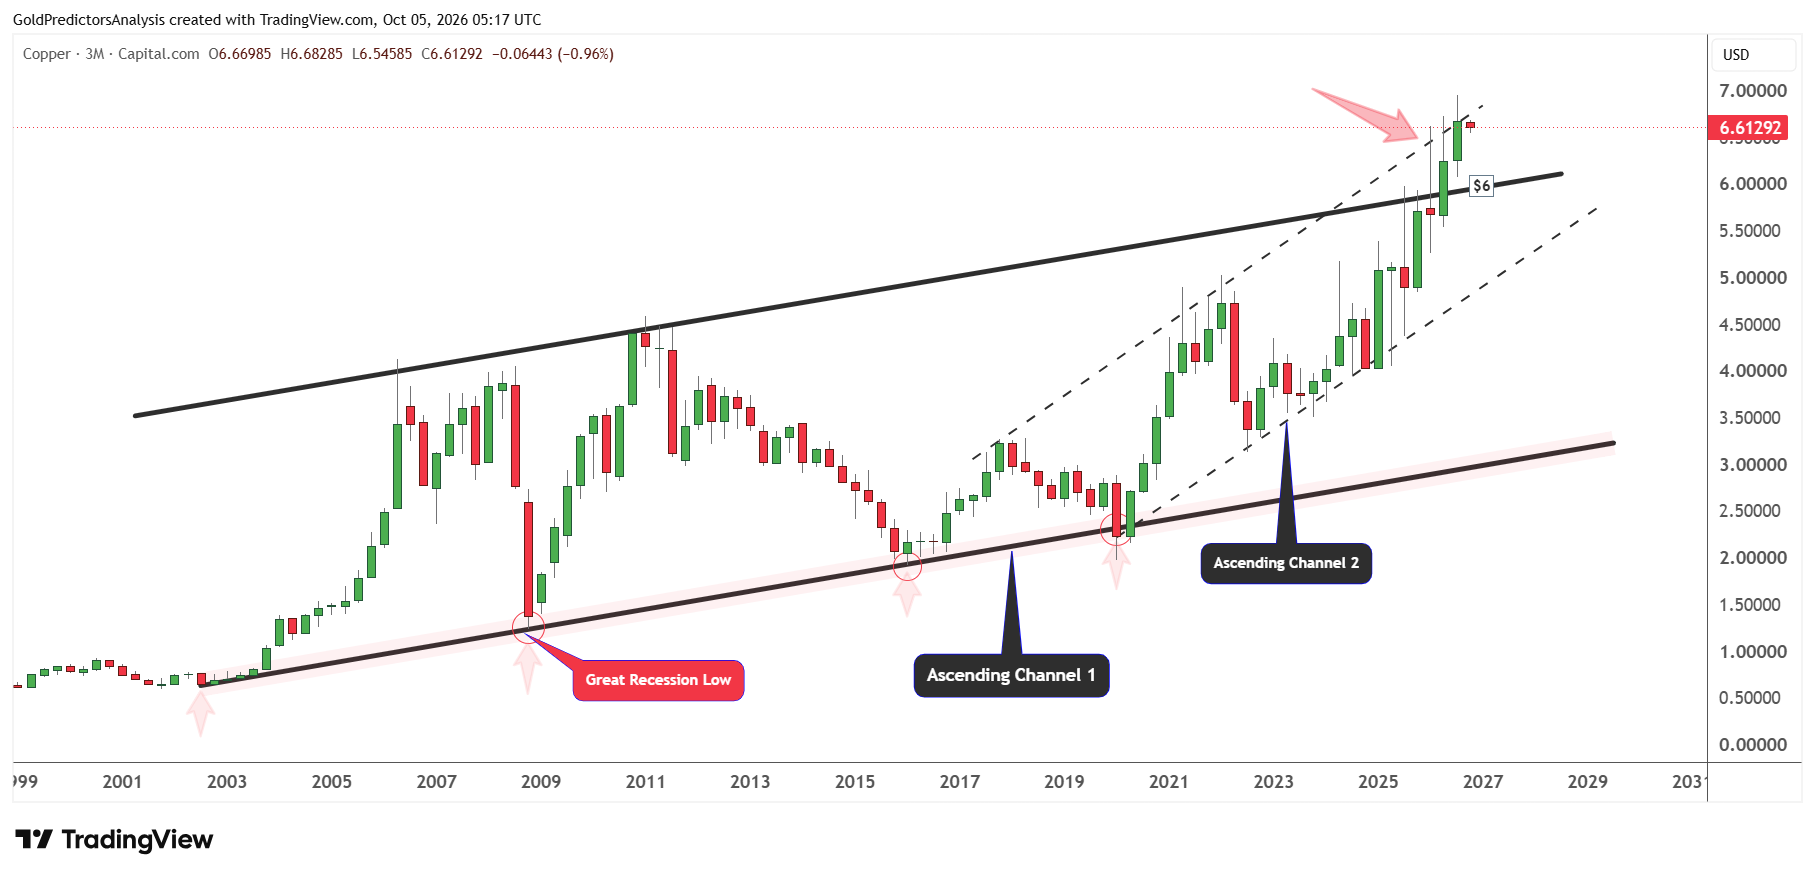
However, immediate support for copper prices remains at $6. A break below $6 will likely introduce a deeper correction towards the $5 area. Overall, copper prices remain in a healthy bullish trend due to the strong demand emerging from AI data centers. Therefore, any correction in copper prices towards the support zones will likely indicate another rally to higher levels in the next few months.
The monthly chart for copper prices also shows strong positive price action due to tariff uncertainty. The price broke above $5 in October 2025 and produced a strong surge to mark a high at $6.95 in September 2026.
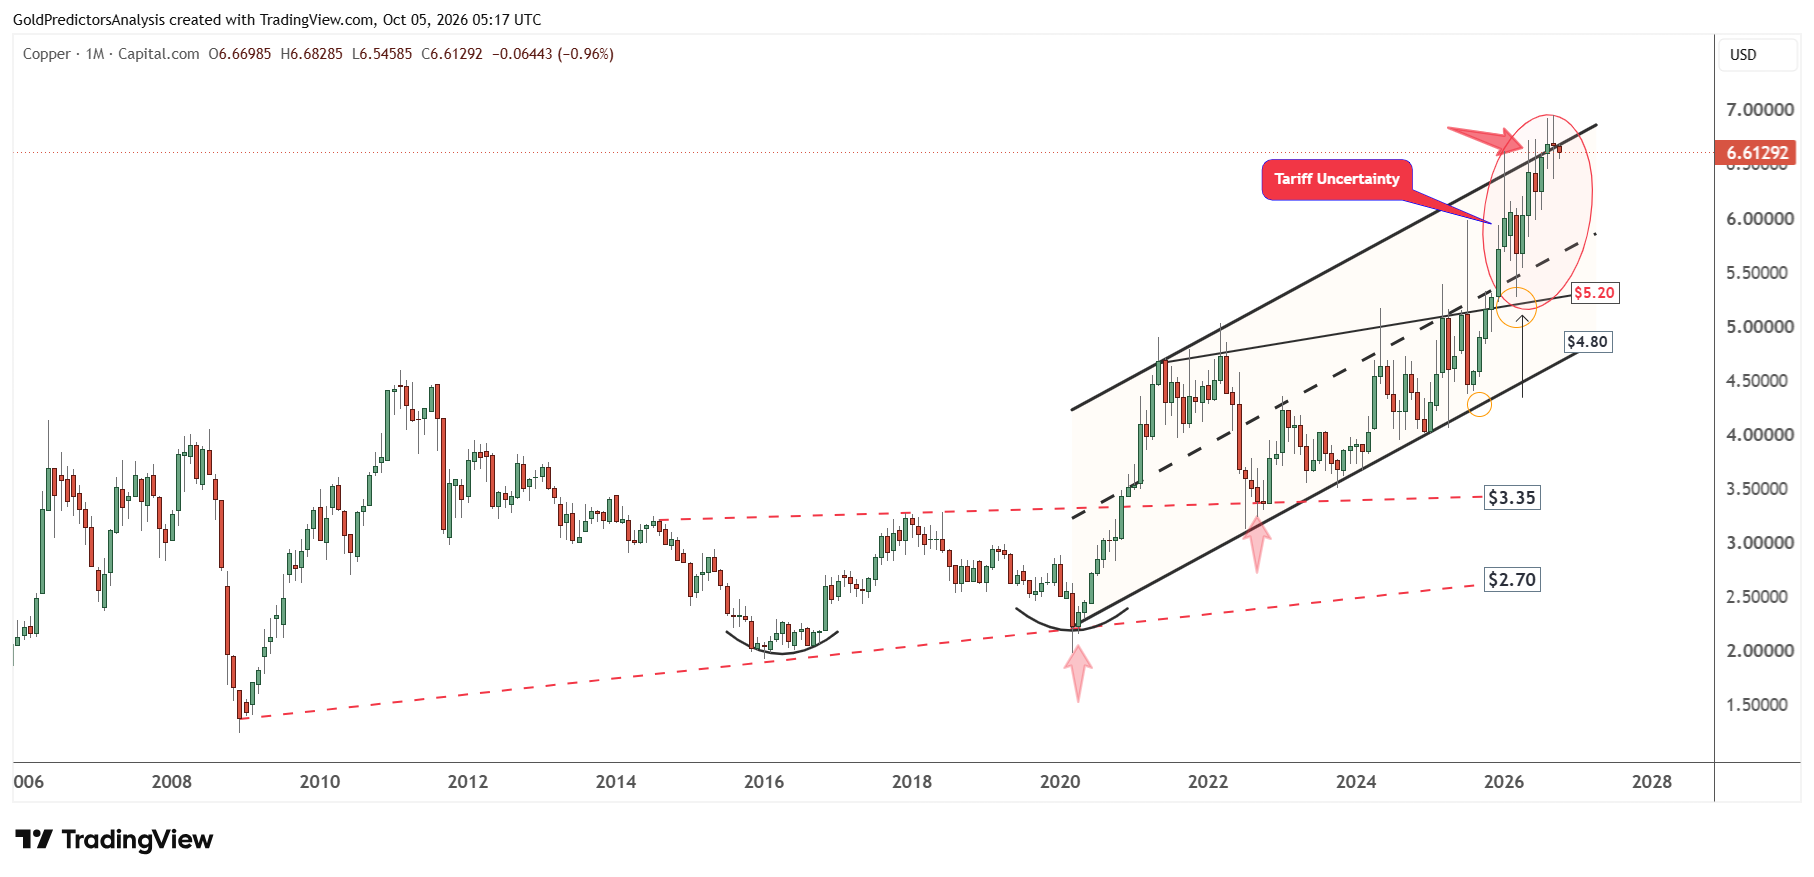
However, the price still remains overbought at the resistance of the ascending channel pattern. The long-term support in the copper market remains at $5.20. If prices drop from this resistance, then $5.20 support will likely offer a strong pivot point for long-term investors.
But there is still no sign of a correction as copper prices remain in a healthy bullish market. A break above $6.95 will likely point to further upside.
Short-Term Analysis: $6.50–$6.95 Trading Range
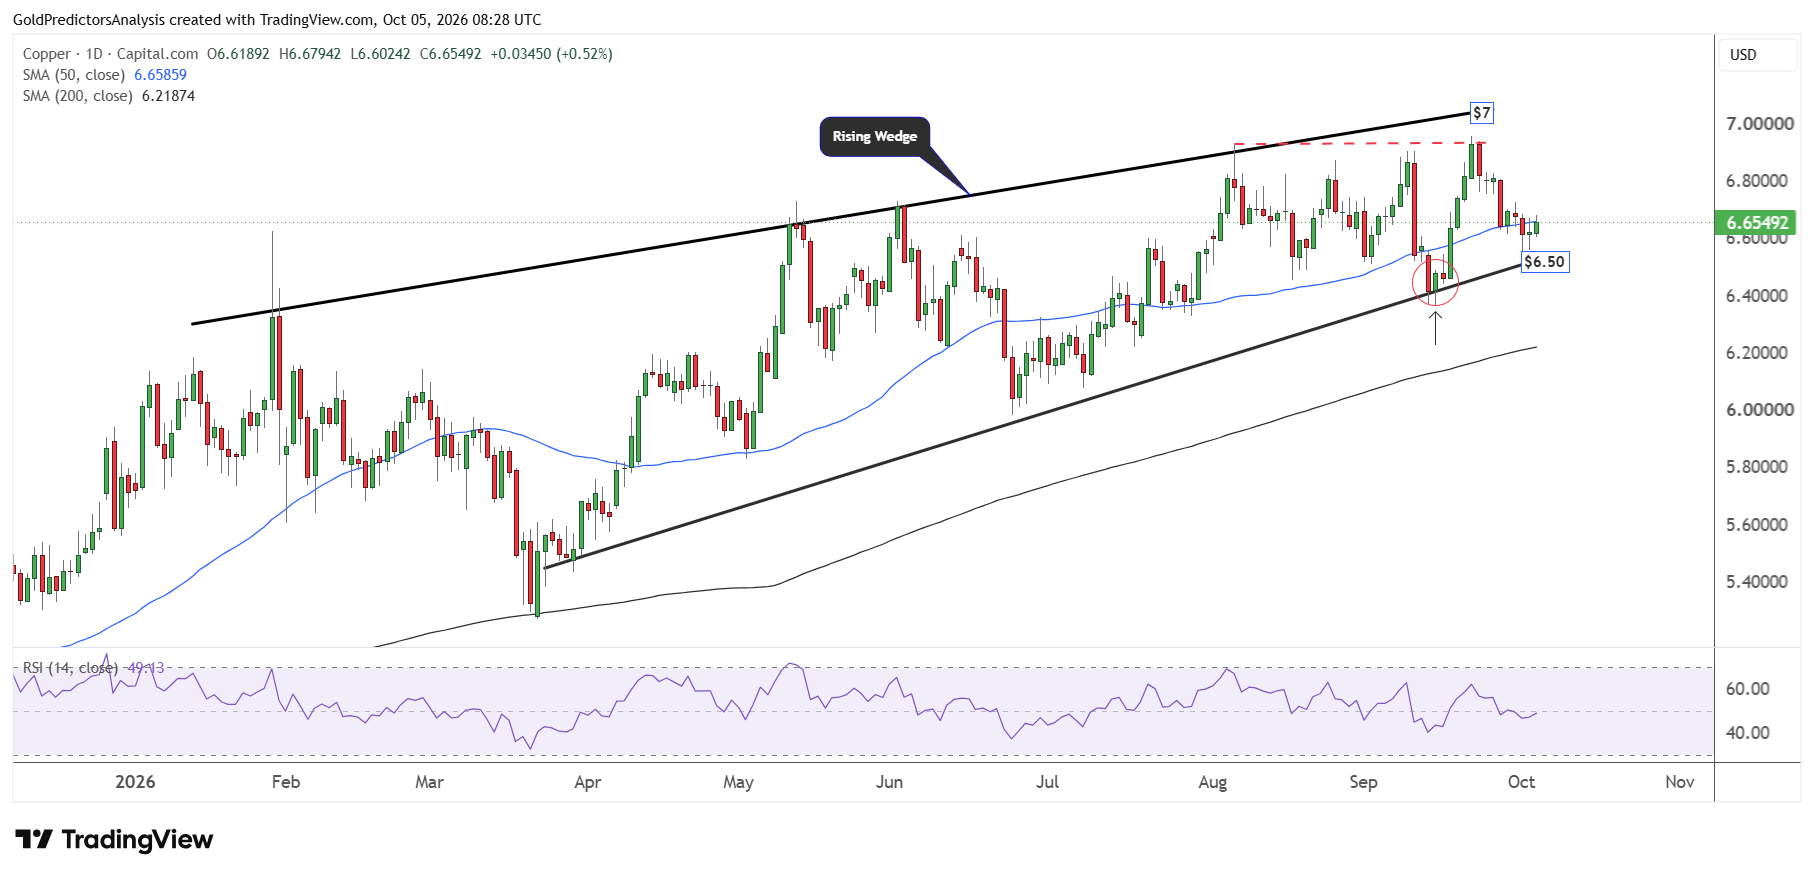
The short-term outlook for copper prices also remains uncertain as prices have been consolidating at the edge of the rising wedge pattern between $6.50 and $6.95. A break above $6.95 will offer a rally towards the $7.10 level, but a break below $6.50 will signal a deeper correction towards the $6-$6.20 area.
The RSI remains below the midline, which indicates the possibility of a deeper correction towards $6.20 before the next rally.
Copper Market Risks
The main downside risk for copper comes from the strong dollar and high costs that limit the buying of copper. The US dollar strengthened on Monday while Brent remained above $100 a barrel. This raises costs for overseas buyers and adds pressure on manufacturers. Therefore, some firms may delay purchases even as new orders improve.
The activity after the Chinese holidays will be an important test. A break below $6.50 would increase the risk of a decline towards $6-$6.20.
The size of any disruption in supply is another risk. If the disruption in Chile proves brief and recovery continues, supply concerns could ease and remove some support for prices. But the long disruptions could have the opposite effect. A break above $6.95 would weaken the bearish outlook in the short term.
What to Watch Next for Copper Prices
The broader trend for Copper remains positive, but prices still face pressure in the short term. The supply concerns and strong US factory orders may limit further losses in the short term. A break above $6.95 could bring $7.10 into view. A stronger rally could later reach $7.50. However, a break below $6.50 would raise the risk of a drop towards $6-$6.20. The reaction at these levels will suggest whether buyers can support a recovery.
The physical buying activity after the holidays in China and the updates from Codelco and Freeport will be important for copper prices. The duration of the pause in Chile and the pace of recovery at Grasberg will help clarify the outlook for supply. Moreover, the weak dollar and lower fuel costs would give buyers some relief. The strong buying could support a rally, while weak demand or an easing of supply concerns could keep copper under pressure.
Read more: Gold and Silver Rebound Faces Risk of a Deeper Drop