



Gold: Weak U.S. Hiring Pushes Fed Toward a Pause
Gold’s outlook improved as the labor market signaled more weakness than expected in the most recent U.S. jobs report. Nonfarm payrolls rose by just 29,000 for the month of September, versus expectations for roughly 90,000. The unemployment rate also edged up to 4.2%. Previous months’ payrolls were also revised lower. Additionally, annual wage growth slowed to 3.0%, which reduces the case for an interest rate hike by the U.S. Federal Reserve at their next meeting in October. Markets are now pricing in an interest rate hike by the Fed at their December meeting at roughly a 60% probability.
While some market participants may view the current environment as positive for gold, an increase in U.S. interest rates, yields, and the value of the U.S. dollar would reduce the opportunity cost of not holding U.S. dollar denominated assets. Additionally, while U.S. inflation continues to be elevated and a lack of fiscal stimulus continues in the U.S., the dollar has recently appreciated against the euro. This reduces the opportunity cost of holding the U.S. dollar.
High demand for structural reasons is still in evidence. Global gold ETFs bought 121 tonnes in August. Holdings are up a record 4,189 tonnes. Central banks also bought with China and Poland among the most active.

Silver: Fed Relief Meets a Still-Tight Physical Market
The retreat in near-term Fed tightening expectations and a still-tight silver physical market bolster the silver price. The Silver Institute expects 2026 to mark the sixth consecutive annual silver deficit, with fabrication and investment demand in that order, providing the principal support.
Industrial demand is becoming more finely tuned. While AI data centers are an important source of demand, so too is electrification of the grid and EVs, as well as solar and automotive electronics. Recycling is increasing and could offset demand, however, it hasn’t alleviated the industrial deficit.
Gold Technical Analysis: XAU/USD Holds $4,112 as $4,160 Remains the First Recovery Test
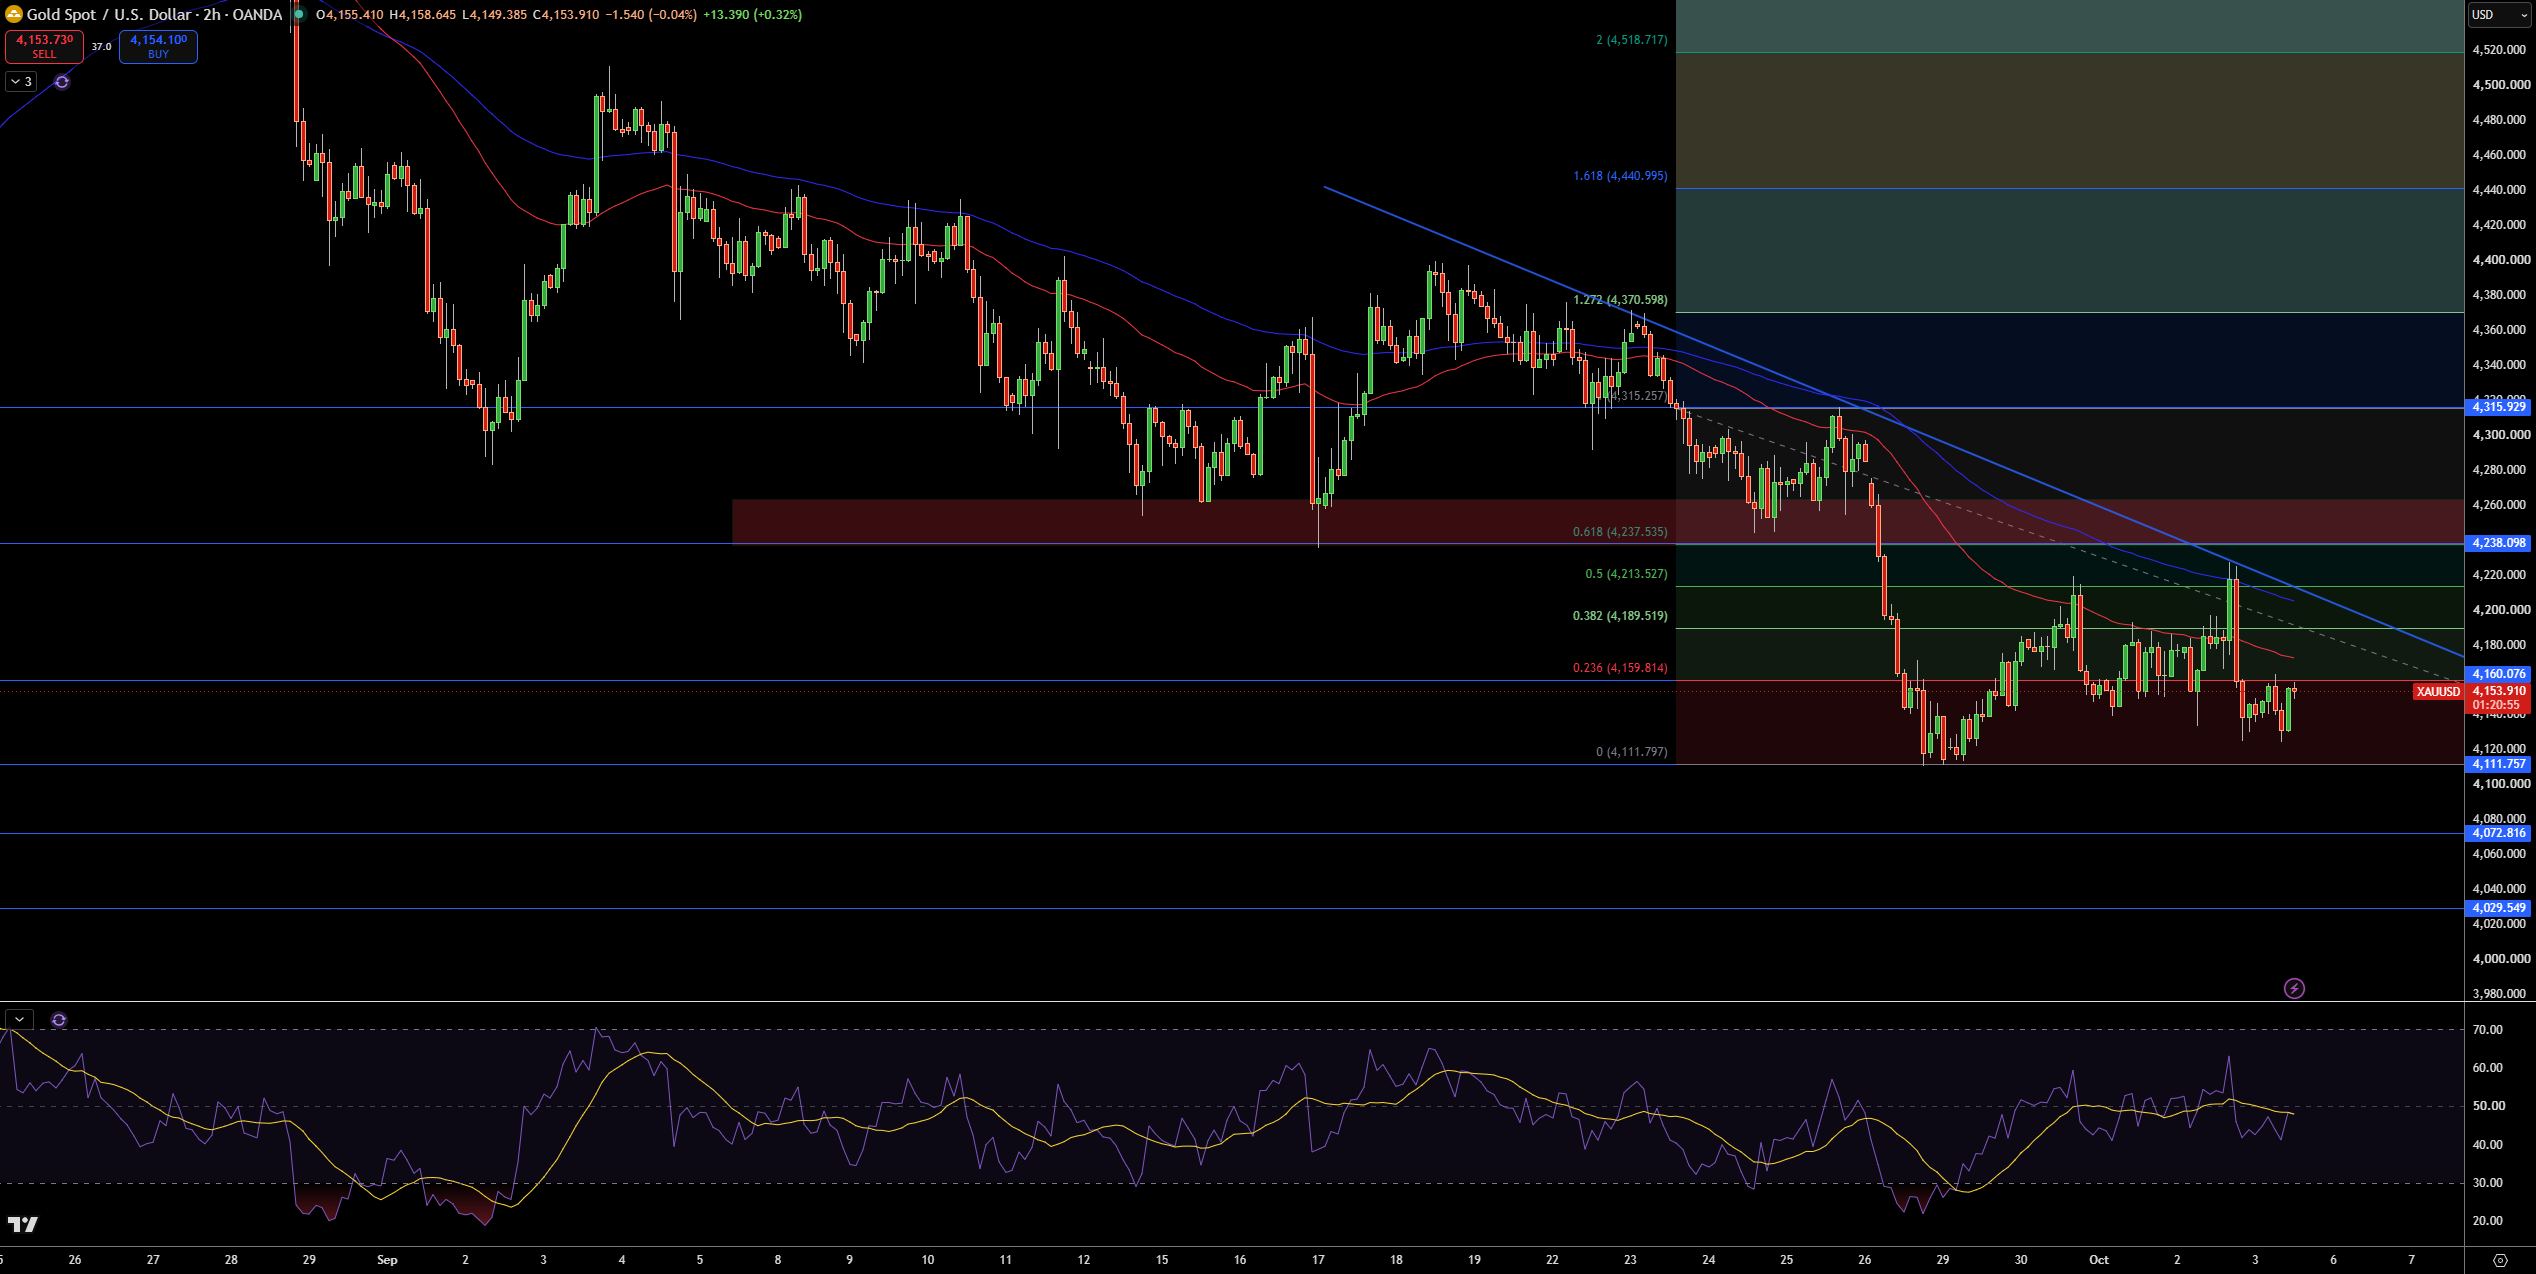
Gold is currently trading around $4,154, and what is worth noting is that the price is still consolidating above the $4,112 area after the recent sharp decline from the $4,238 area. In general, the larger trend is still bearish as gold is below both the moving averages and the bearish trendline, and the recent upward moves are failing to break above the nearby resistance levels.
An initial area of resistance is seen at $4,160. If that level is broken, then the next resistance is seen at $4,190, and further above that is $4,214 and the previous recent high at $4,238. On the downside, the $4,112 level is the first major support, and below that is the $4,073 and $4,030 areas.
Gold Price Forecast
Every new Gold analysis as it publishes, today's technical signal and key levels, live price — on one page.
See all Gold forecastsRSI is in the middle, but is still slightly bearish, which implies that while a bullish reversal is not confirmed, the recent consolidation above $4,112 has provided a slightly more stable trend. In general, I agree with the recent bearish bias while gold is below the $4,160-4,190 area and the descending bearish trendline. I would become more bullish if that trendline is broken with a move above $4,214, and I would take a bearish bias if that trendline and the support at $4,112 is broken with a move lower to $4,073.
Silver Technical Analysis: XAG/USD Holds $59.96 as $61.72 Caps the Recovery
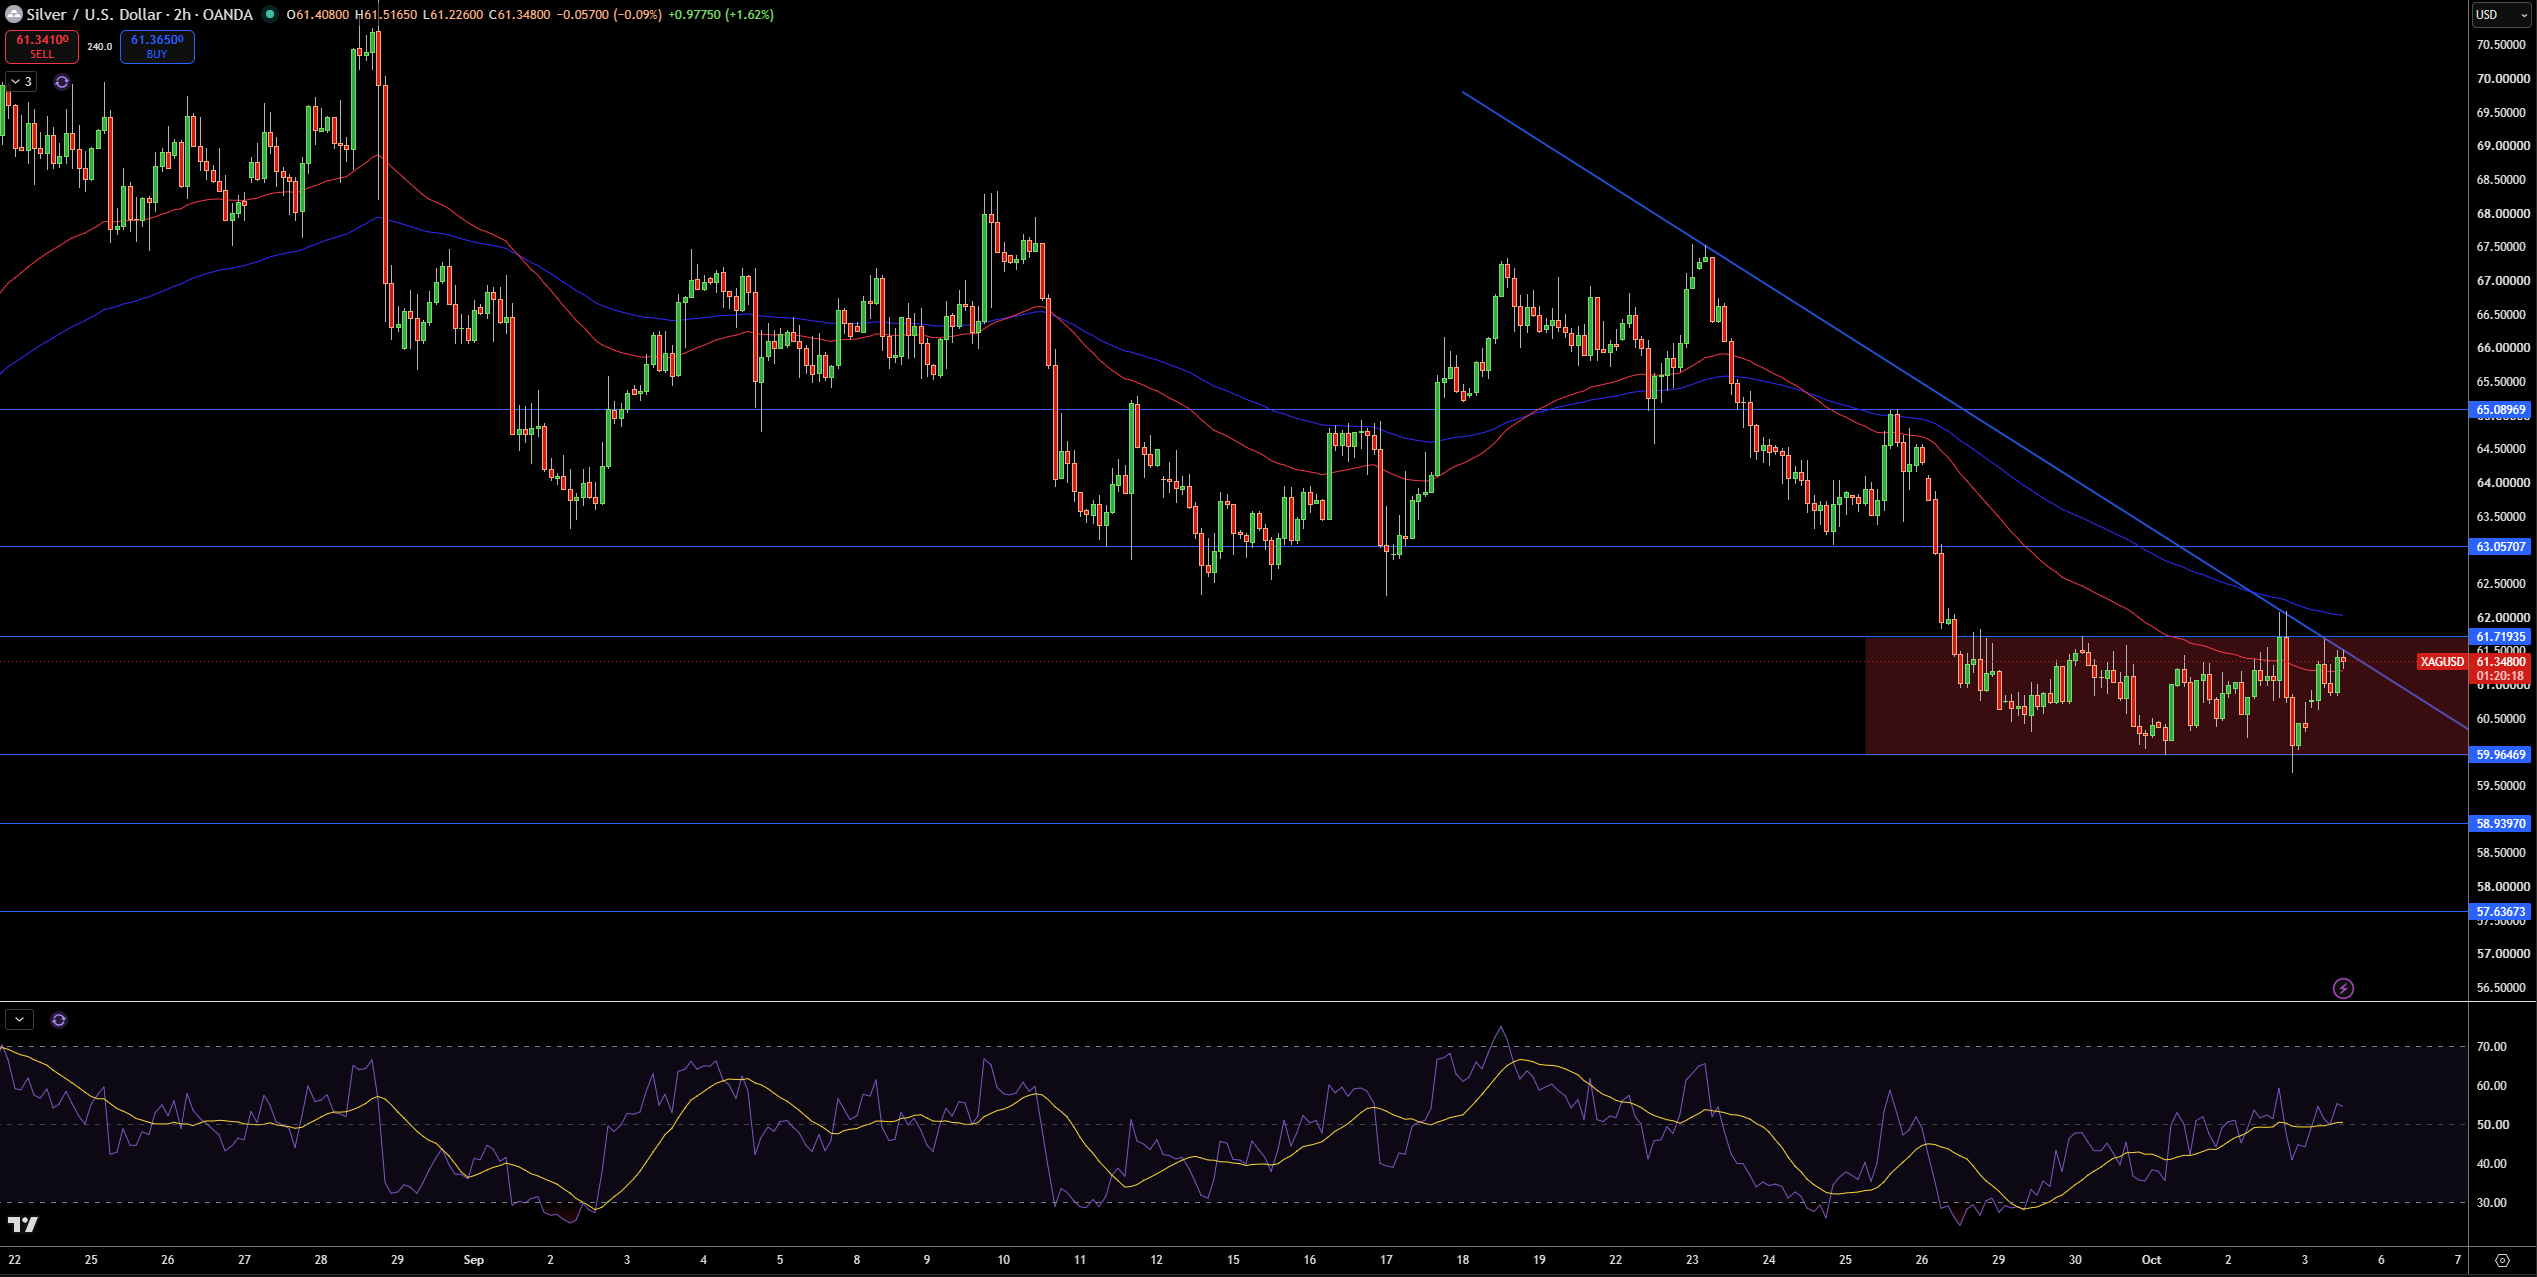
Currently, Silver is trading at $61.34 after failing to rebound from the $59.96 area. My attention is on how the price has been unsuccessful in breaking the descending trendline and both moving averages, while recoveries have been unsuccessful in crossing the $61.72 resistance. As such, the short-term trend is viewed as bearish.
The first resistance I am looking at is at $61.72. If the price breaks the resistance, then the next level of resistance will be at $63.06, and $65.09. If the bearish trend continues, then the support will be at $59.96, $58.94 and $57.64.
I am currently bearish on Silver because of the descending trendline, and the price being below the $61.72 level. As mentioned above, a break above $63.06 will change my view to a bullish one, and a break below $59.96 will give a stronger bearish view toward a break of $58.94.



