
USOIL: Inventories Rise, but Fuel Tightness and OPEC+ Discipline Limit the Cushion
US crude fundamentals show improvement in supply, but continued stress in refined products. The EIA showed US crude inventories at 427.3 million barrels, up 922K, for the week of September 25. Distillate stocks fell by approximately 2.3 million barrels to 105.2 million. The diverging trends between crude and distillates is important because distillates, and in particular diesel, is the tighter part of the barrel. On October 4, OPEC+ kept November production targets the same. Despite some OPEC+ members being under quota because of Middle East disruptions, the overall effect is more crude is available than earlier in the year, but restrictions in refining and transport remain.

UKOil: Middle East Exports Recover, but Logistics Remain the Real Constraint
After the losses from the previous week, Brent rose on Wednesday following the terror attack in Saudi Arabia, and then settled up for the week on Friday after Iran announced they would increase oil shipments through the Strait of Hormuz. Logistics are the biggest constraint on the global oil market.
Brent fundamentals have shifted from an outright shortage to a logistics issue. Middle Eastern crude exports strongly rebounded in the second half of September, averaging around 18.5 million barrels per day (mbd) by October 1, close to pre-war levels. However, the attacks on tankers, increased insurance costs, and the disruption of normal shipping lanes through the Strait of Hormuz continue to obstruct the flow of oil. Also, the Group of Seven (G7) member countries’ announcement to release 100 million barrels from their strategic petroleum reserves has temporarily relieved the immediate concerns of a supply shortage, and the decision by the Organization of Petroleum Exporting Countries (OPEC) and other producers to not increase their output has removed the risk of a policy-related increase in supply.
Natural Gas: Record Output Meets Strong LNG Pull
As for natural gas, record U.S. production and strong LNG exports have kept U.S. natural gas fundamentals balanced. Working natural gas in storage, as of October 1, was at 3.415 billion cubic feet (Bcf), 3.9% less than last year and 2.4% above the five-year average. Average natural gas withdrawals for the month of July reached an all-time high of 137 billion cubic feet per day, and average LNG exports for the month of September reached 10.9 million metric tons.
Natural Gas Technical Analysis: NG Reclaims $3.00 as $3.10 Becomes the First Upside Test
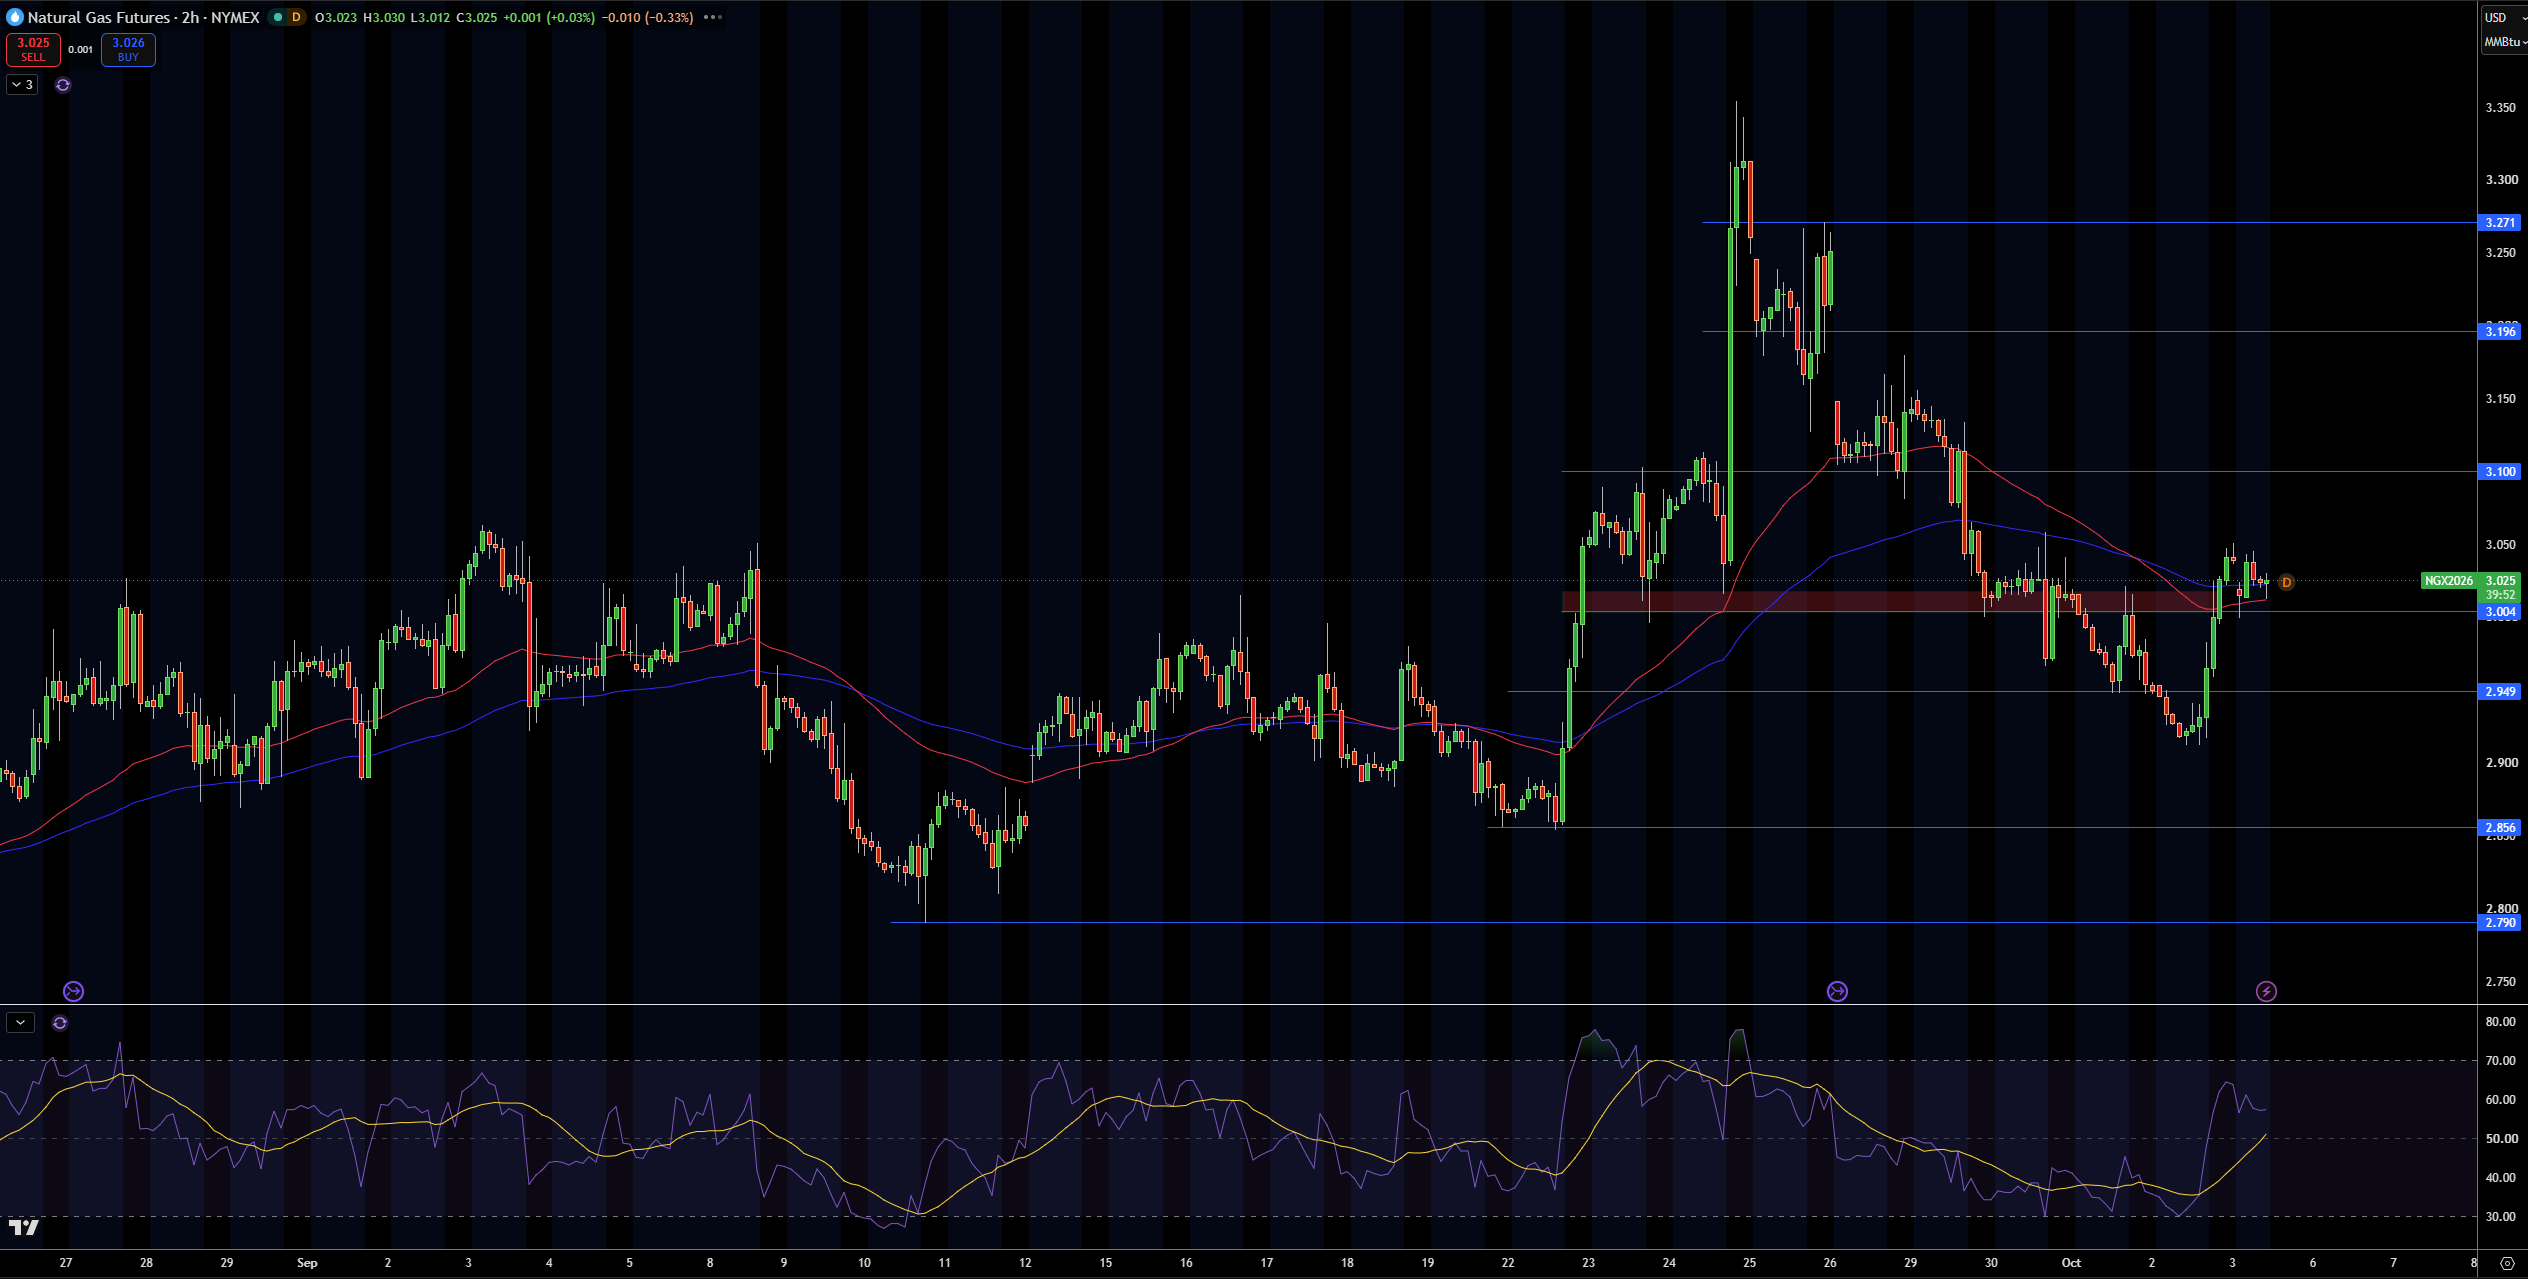
Currently trading near $3.03 on the 2-hour chart, NG has recovered sharply from the $2.90-2.95 area. What interests me is that $3.00 has been reclaimed by the market and the moving average cluster is now tested from below. The retest of $3.00 has improved the near term outlook, but the structure still favors a bearish bias, and to turn structurally bullish, the $3.10 area needs to be taken out.
Natural Gas Price Forecast
Every new Natural Gas analysis as it publishes, today's technical signal and key levels, live price — on one page.
See all Natural Gas forecastsI am looking for resistance at $3.10 first. A break above that area would have $3.20 and $3.27 next on the map. Looking at the other side of the trade, if $3.00 is broken, then support comes at $2.95 and then $2.86 and $2.79.
RSI has recovered to the 50-line from the oversold condition, telling us that near term momentum has improved. I am neutral to slightly bullish as long as NG is above $3.00. An upside break above $3.10 would have me more bullish. A move back below $2.95 would put $2.86 back in focus.
WTI Crude Oil Technical Analysis: USOIL Holds $88.54 as $92.90 Remains the Key Recovery Test
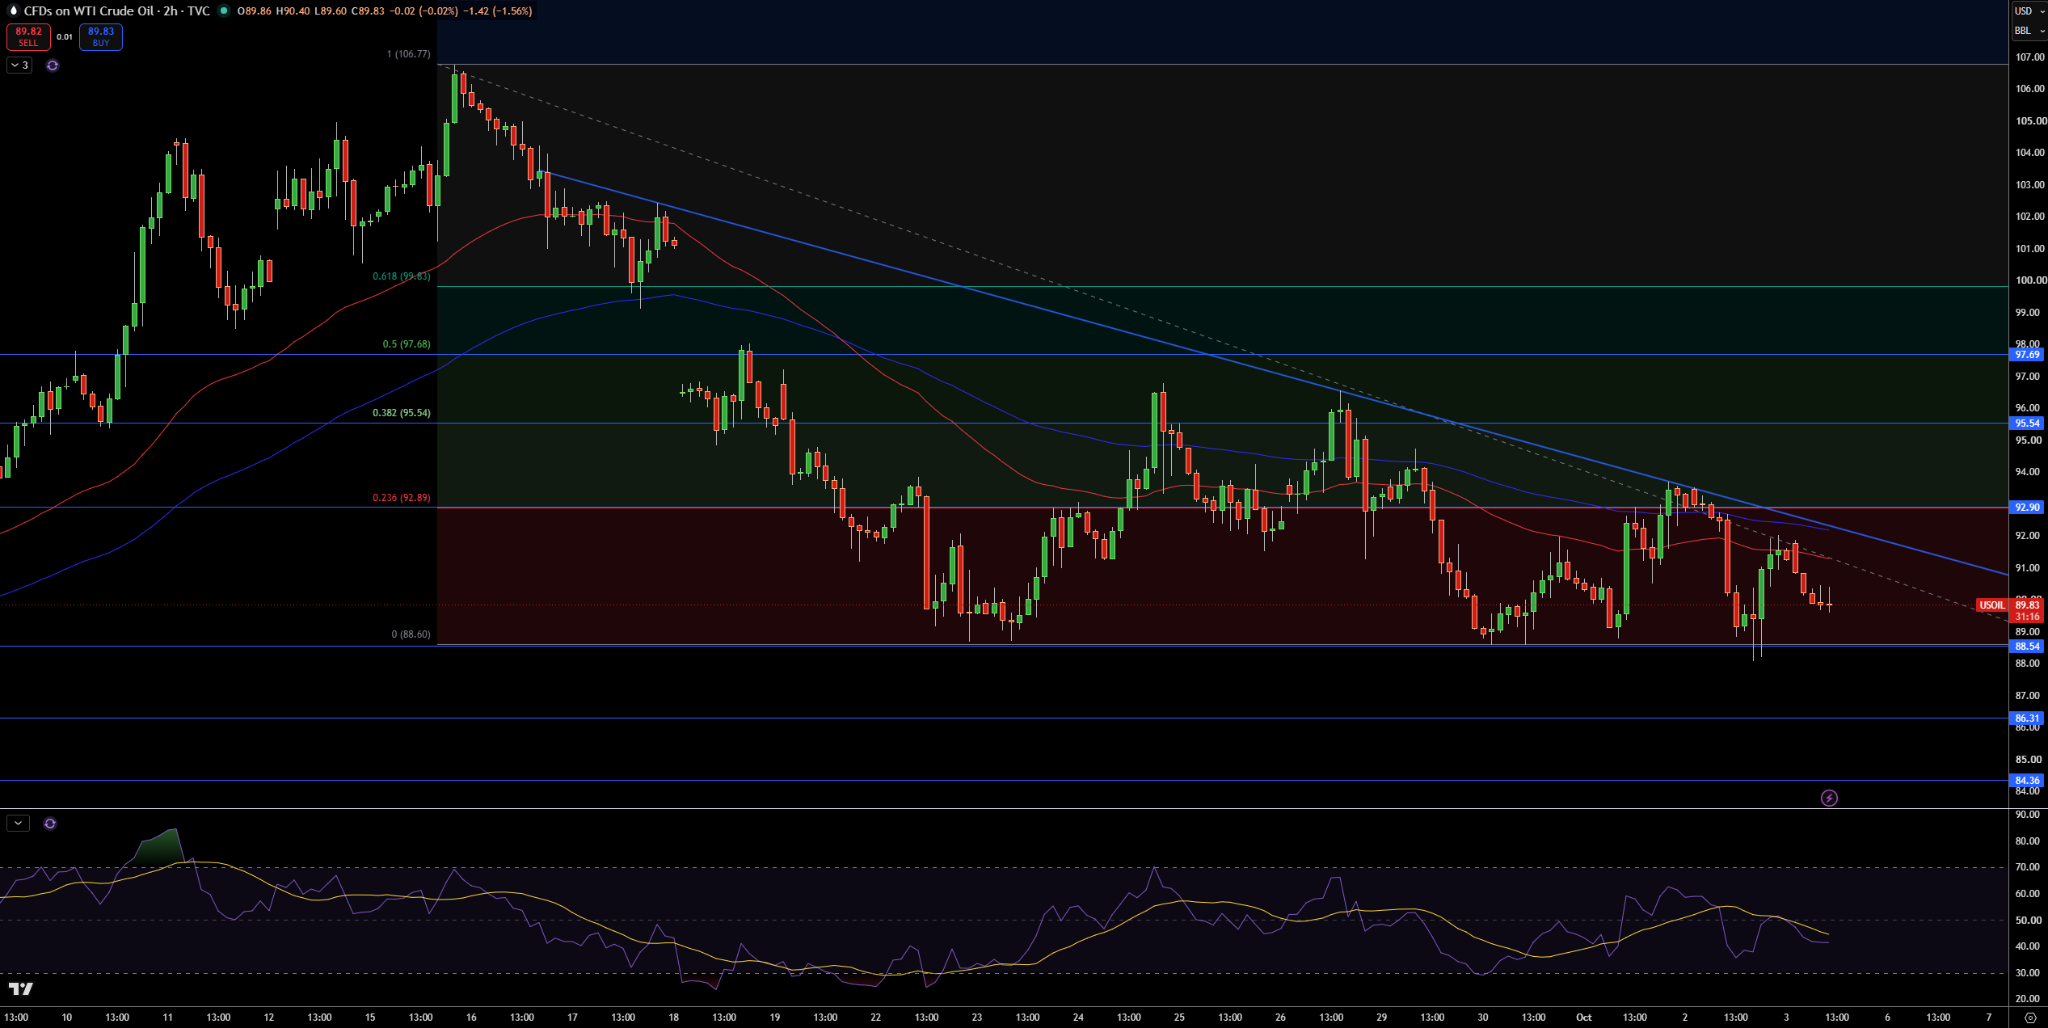
WTI is currently trending at $89.83, and has been unable to close above $88.54. Bearish lower highs are still in effect, meaning sellers control the short-term trend.
The moving averages and the descending trendline remain bearish, meaning sellers control the longer-term trend. The next bearish target is the psychological support at $80.00, though it would take a trend change before it becomes valid.
Current trendline support and the $88.54 level are the first line of defense. Should price break below, the next targets become $86.31 and $84.36.
A bullish reversal would invalidate this bearish outlook, meaning a strong uptrend beyond $92.90 would target $95.54, and beyond that, $97.69 and $99.83. Support and resistance levels can always be found by using the about document in the forum.
Brent Crude Oil Technical Analysis: UKOIL Holds Above $98.71 as $103.89 Caps the Recovery
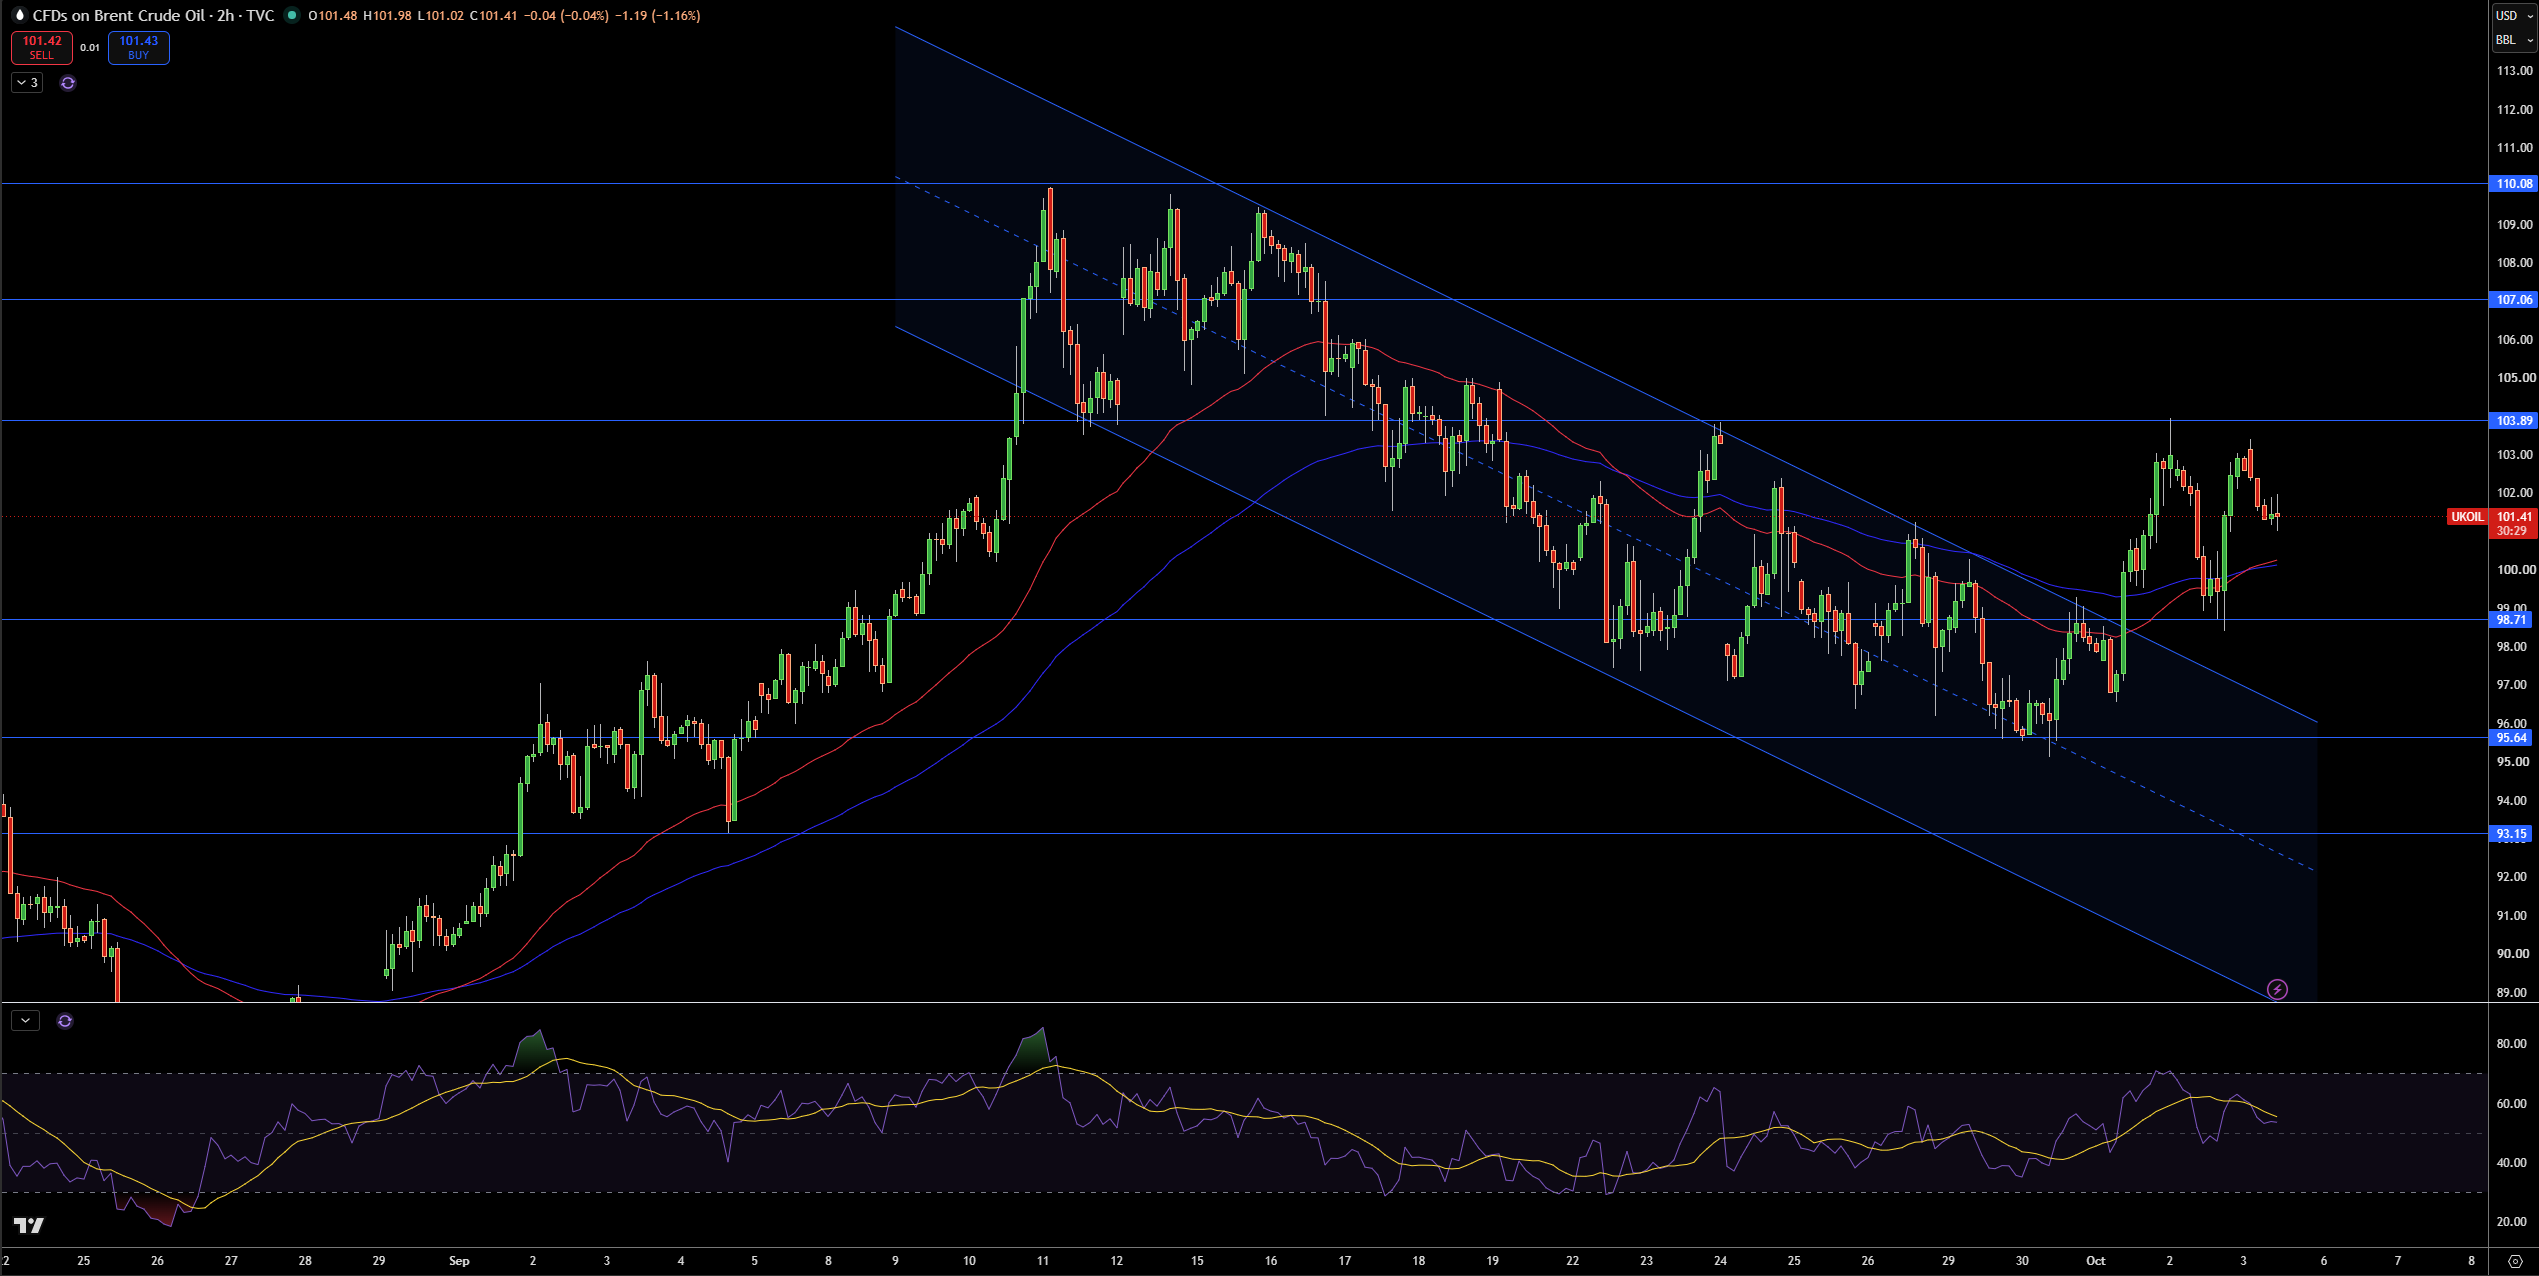
Brent crude is currently being traded near $101.41 on the 2-hour chart after breaking out of the descending channel and reclaiming the moving average cluster. What is worth noting is that price has held the $98.71 area, which keeps the recent recovery intact, and although buyers have not broken the $103.89 area, it keeps the upside potential capped.
To the upside, the first area of resistance is at $103.89, beyond which the next area of resistance comes in at $107.06, and then $110.08. If the upside breakout starts to fail, then the $98.71 area would provide support, with the next area of interest coming in at $95.64 and then $93.15.
RSI has eased from stronger levels, which indicates that momentum has slowed, but is still bullish. So long as price holds above $98.71, I would keep a bullish bias. A break below $95.64 would bring a bearish bias, and a break above $103.89 would increase the likelihood of a move toward $107.06.