
The Dow Jones continues to drop to the 50,000 level as higher Treasury yields and rising fuel costs put pressure on stocks. The stocks in the technology sectors remain strong, but the Dow needs broader gains across the financial, industrial and consumer companies. The market now watches for the upcoming earnings to see whether profits can withstand higher costs.
Agustina Patti, Financial Markets Strategist at Exness, commented:
Elevated US Treasury yields continue to put pressure on the Dow Jones, as increased borrowing costs weigh on businesses and market sentiment. Attention is now turning to corporate earnings for signs that companies can maintain profitability despite higher costs. A moderation in yields, alongside resilient earnings, could provide some support for the index, while renewed upward pressure on yields could keep volatility elevated
In my view, the Dow needs to defend the support level of 50,000 and see some relief in Treasury yields to support a recovery. This article presents the key economic drivers, sector trends and technical levels that could shape the next move in the Dow.

Dow Jones Fundamentals: High Yields and Oil Pressure Stocks
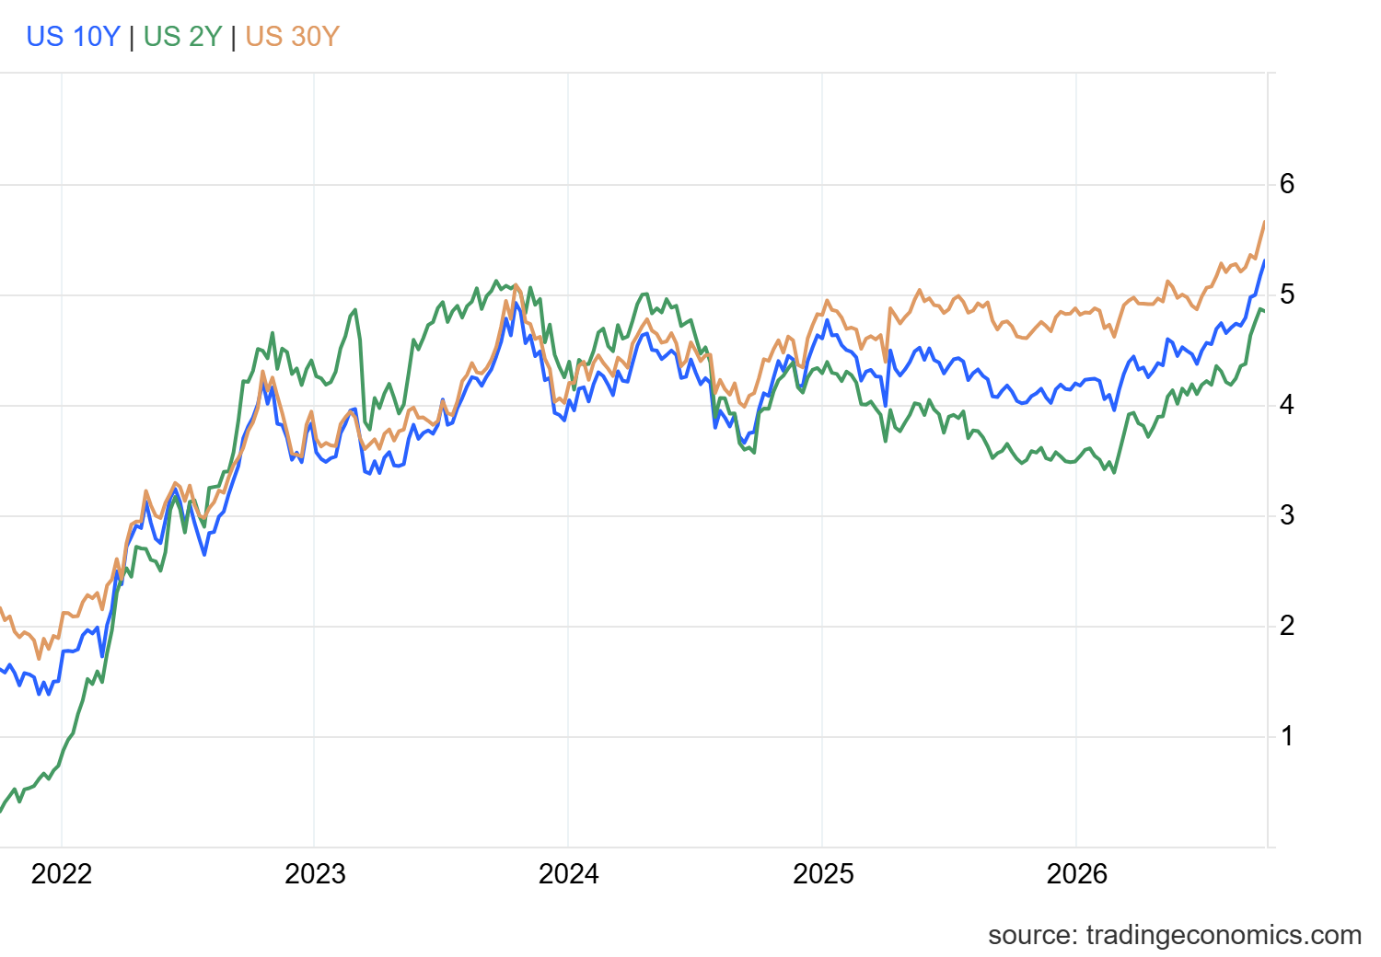
The Treasury market remains a major challenge for the Dow Jones. The 10-year Treasury yield reached the highest level since 2002 at about 5.32%. Meanwhile, the 2-year yield reached the 4.91% and the 30-year yield was around 5.67%. The long-term yields remained above the short-term yields. The high yields can reduce stock valuations and make new investments more expensive for businesses.
The oil market added fresh inflationary pressure after Chinese refiners suspended fuel exports beyond Hong Kong and Macau. The restriction could tighten supplies of fuel even if crude shipments improve. For Dow companies, higher fuel prices can increase the cost of production and transport. They can also leave households with less money for other purchases and create a challenge for consumer businesses.
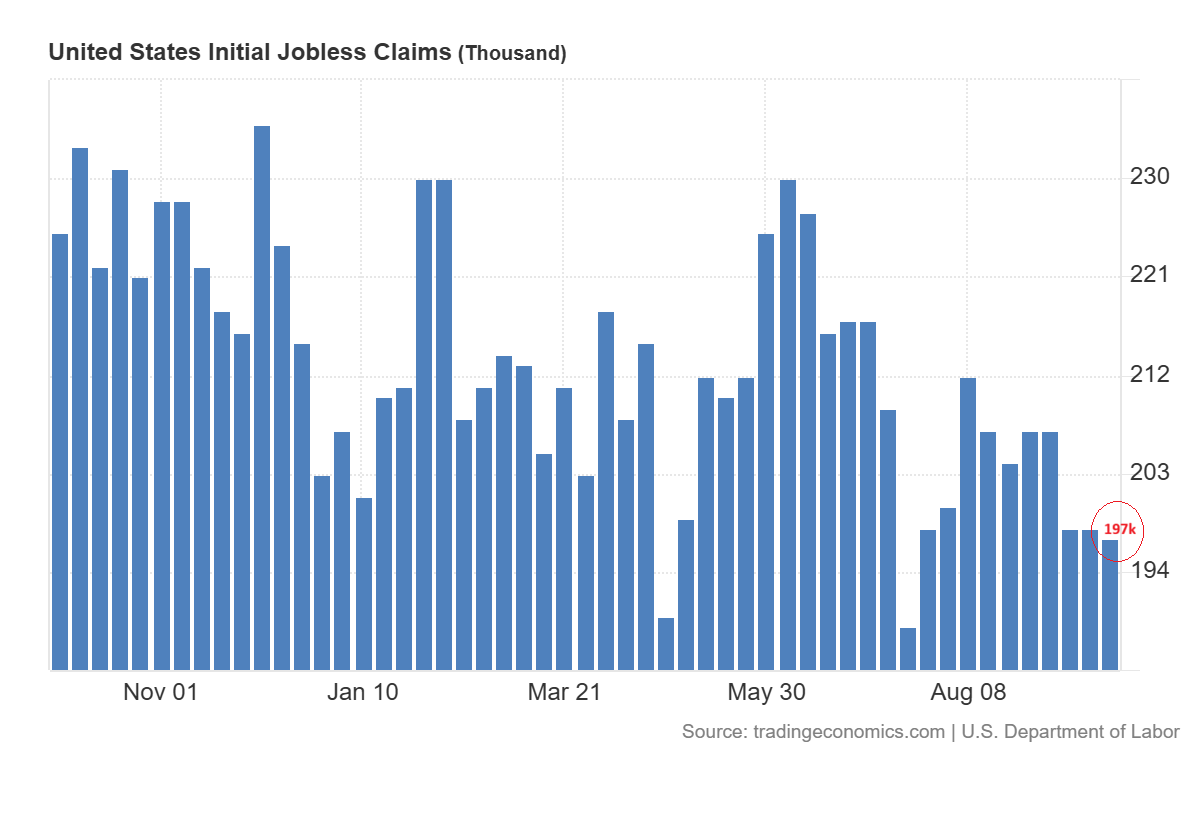
The labor data offered some support for the economic outlook. The chart below shows that the initial jobless claims dropped to 197,000, below the forecast of 200,000.
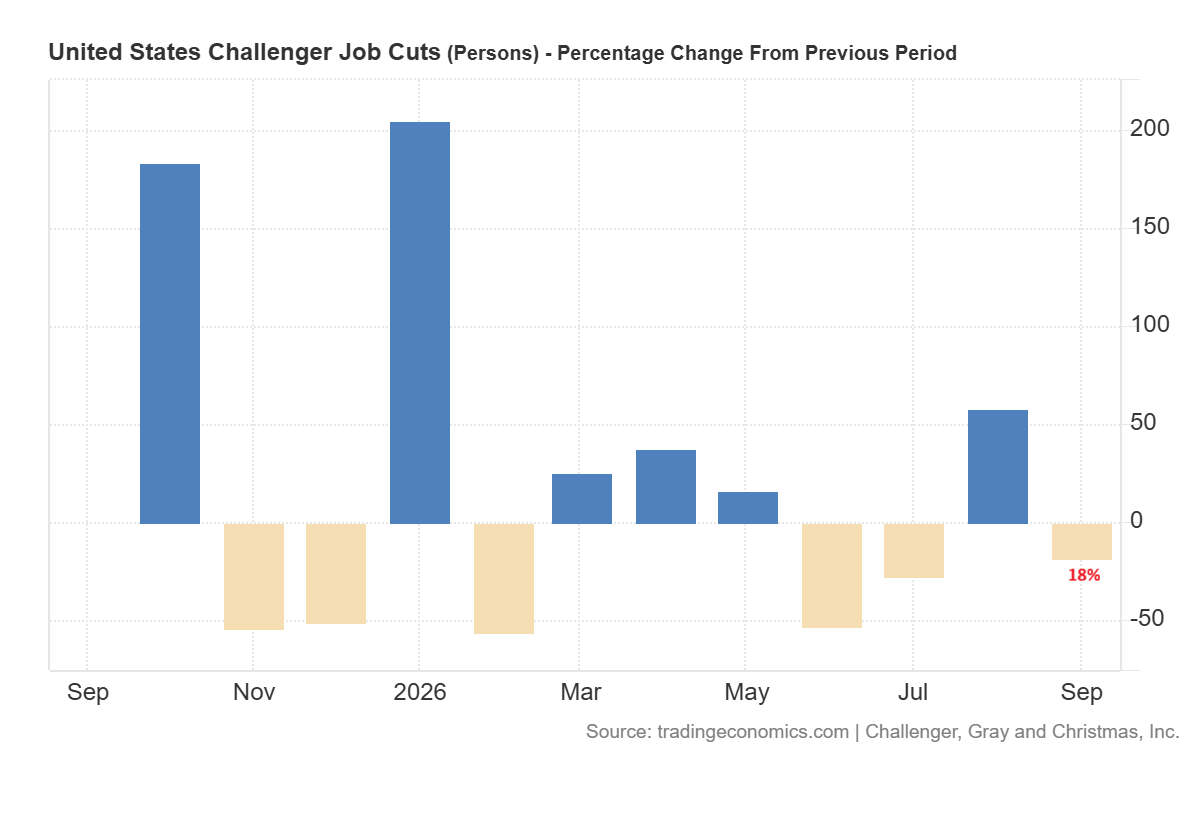
The planned layoffs declined 18% in September from the previous month as seen in the chart below. But the announced hiring plans dropped 23% from a year earlier. In my view, limited layoffs support consumer demand but slower hiring leaves the Dow Jones exposed if higher costs begin to weaken spending.
Investors are now waiting for the fresh data to see whether it can ease pressure on the bond market. The FedWatch tool shows that the expectations of the rate hike in October have dropped significantly after the PCE data.
Dow Jones Lags Nasdaq as Earnings Come Into Focus
These macro pressures support the modest recovery in the Dow Jones. Dow Jones has lost 4.31% in September while the Nasdaq index has gained 3.42%. This difference suggests that investors remained more willing to buy technology stocks than the broader mix of companies in the Dow Jones. In my view, strong participation across financial, industrial and consumer stocks would make the recovery more convincing.
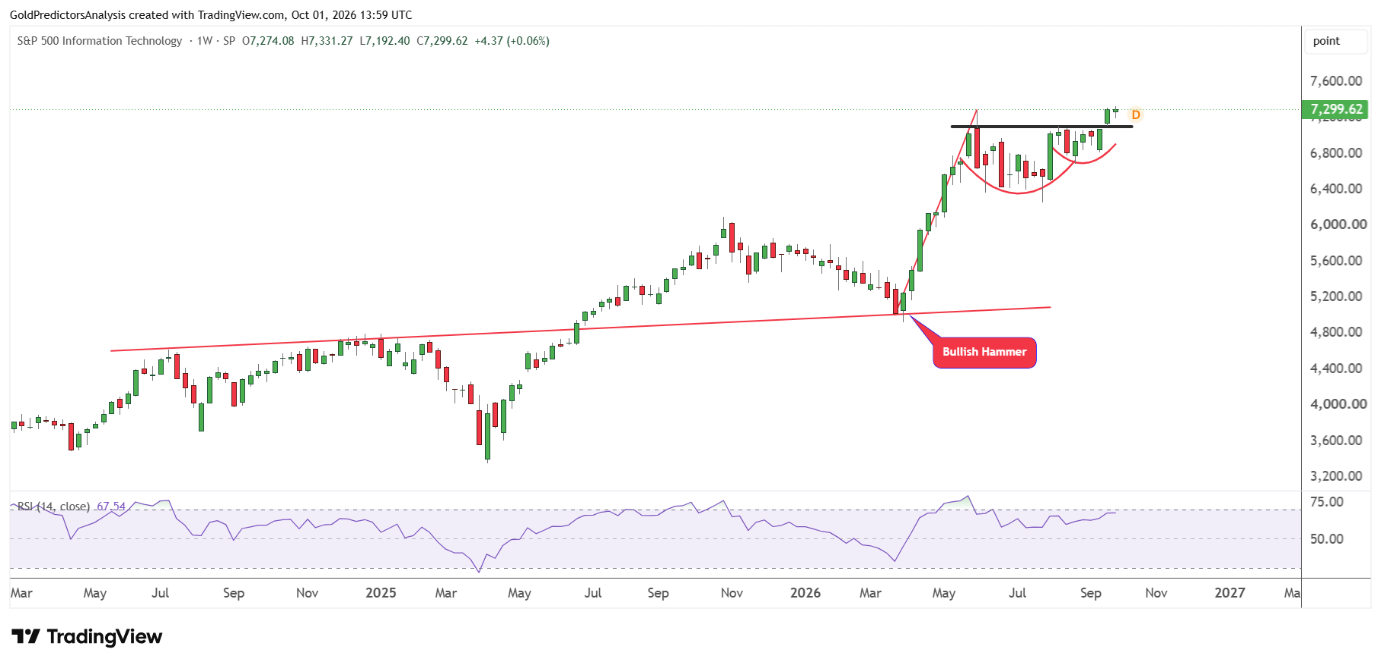
The chart below shows that the S&P 500 technology index has broken the key resistance of 7,100 after forming a strong cup and handle formation. This breakout suggests further upside in the index. This positive price action suggests that technology stocks will continue to perform better. This outperformance will likely push the Nasdaq Index higher.
The top performers for technology companies in September were Advanced Micro Devices Inc. (AMD), Intel Corp. (INTC) and Meta Platforms Inc. (META), which gained over 25% in September.
The companies registered in the industrial sector face a different concern. The US authorities had slowed the licensing of exports for aircraft parts bound for China. Officials were also considering rules that could make further restrictions easier to impose. This adds uncertainty around the supply chains of aviation and the exposure of Boeing to Chinese customers.
The investors should watch whether delays in licensing affect the availability of parts, customer commitments or future orders. In my view, the outlook for Dow remains cautious in the near term despite the strength in technology stocks. The upcoming earnings for Goldman Sachs Group Inc. (GS), Caterpillar Inc. (CAT), Microsoft Corp. (MSFT), Amgen Inc. (AMGN) and UnitedHealth Group Incorporated will likely define the next move in Dow Jones.
Dow Jones Technical Analysis: 50,000 Support Faces a Key Test
The weekly chart for the Dow Jones shows that the index hit the target of 55,000 in August 2026 and dropped towards the key support zone around 50,000. The index is now challenging the key support level at 50,000, which is defined by the February 2026 highs.
A break below this level will likely open the way for another drop towards 45,000. However, this level is considered a major support level and may open the way for another rally towards the 55,000 area.
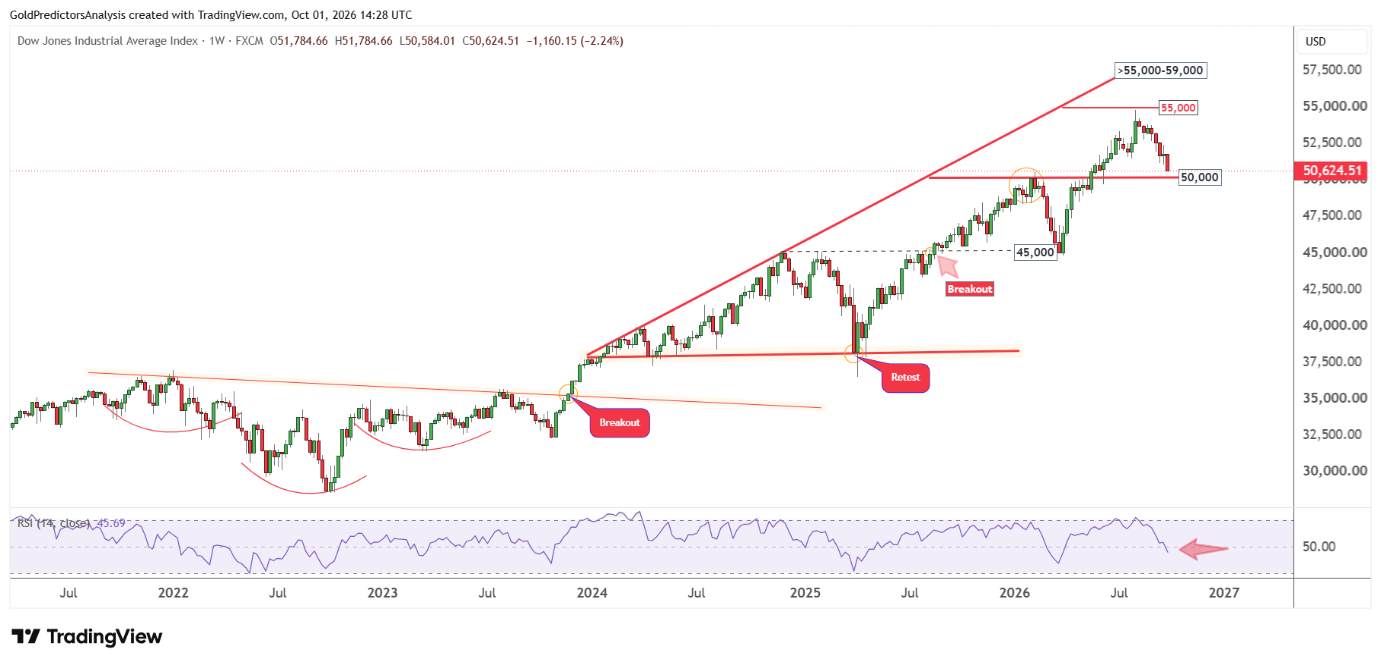
The emergence of an inverted head and shoulders pattern from 2021 to 2023 and then the formation of a broadening wedge pattern suggest heavy volatility in the index. Therefore, the ranges in the index might be high. But this correction may be considered an opportunity for investors in the long term.
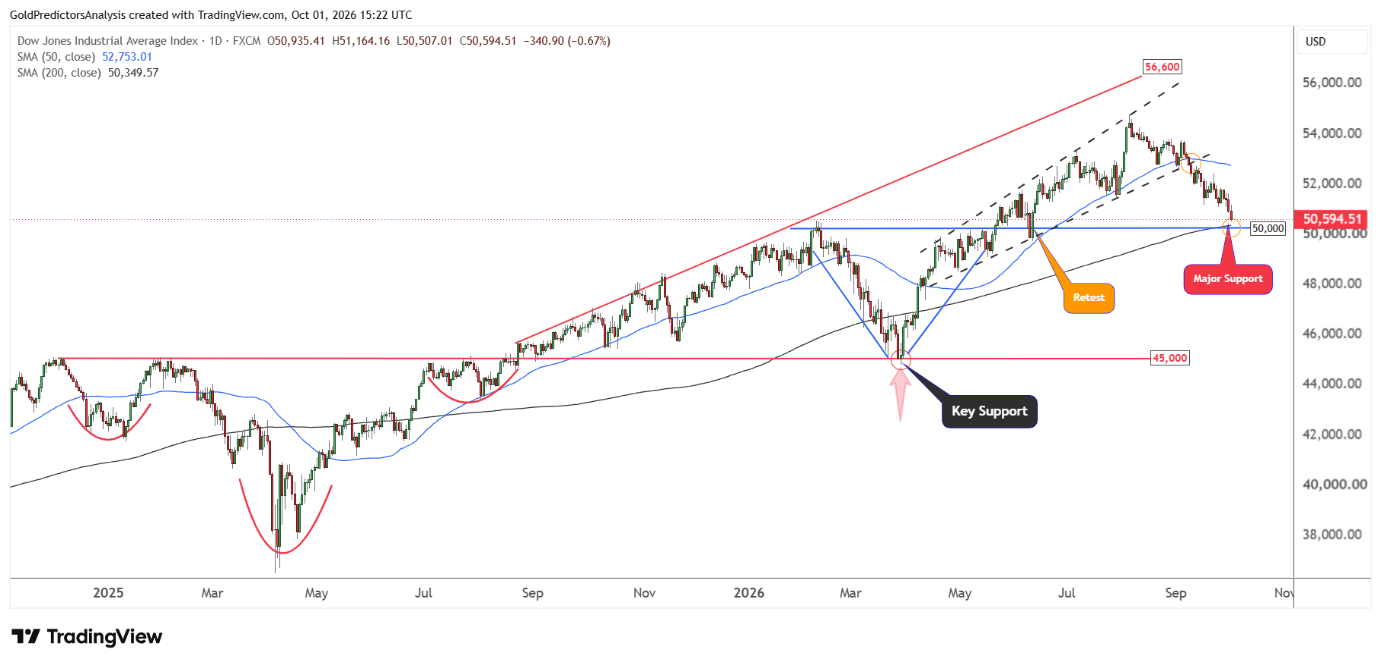
The importance of this support is also highlighted on the daily chart, which shows that the 50,000 level is intersected by the 200-day SMA and the horizontal support line from the February 2026 highs.
However, the breakdown from the ascending broadening wedge pattern in September 2026 at 52,700 suggests a continued drop towards the 48,000 to 49,000 area. However, if the 50,000 support holds, the next rally in the Dow Jones will likely be towards the 53,000 area. A break above 53,000 will likely open the way for 55,000 and 60,000 levels.
What to Watch Next in the Dow Jones
The Dow Jones remains under pressure from high Treasury yields and higher fuel costs. These factors raise expenses for the business and could weaken consumer spending. The stocks in the technology sectors continue to show strength, but the Dow needs a stronger recovery across the financial, industrial and consumer companies. The upcoming earnings will show whether profits can withstand higher costs. In my view, lower yields and steady demand would give the index a stronger basis for recovery.
The 50,000 level remains the key support because the 200-day SMA and the February highs meet in this area. If this support holds, the Dow could recover towards 53,000. A break above that level would bring 55,000 and 60,000 into view. But a break below 50,000 would increase the risk of a decline towards 48,000 and then 45,000. The reaction to support and the earnings guidance for companies will help to shape the next move in Dow Jones.