


Recovery Holds Above Dynamic Support
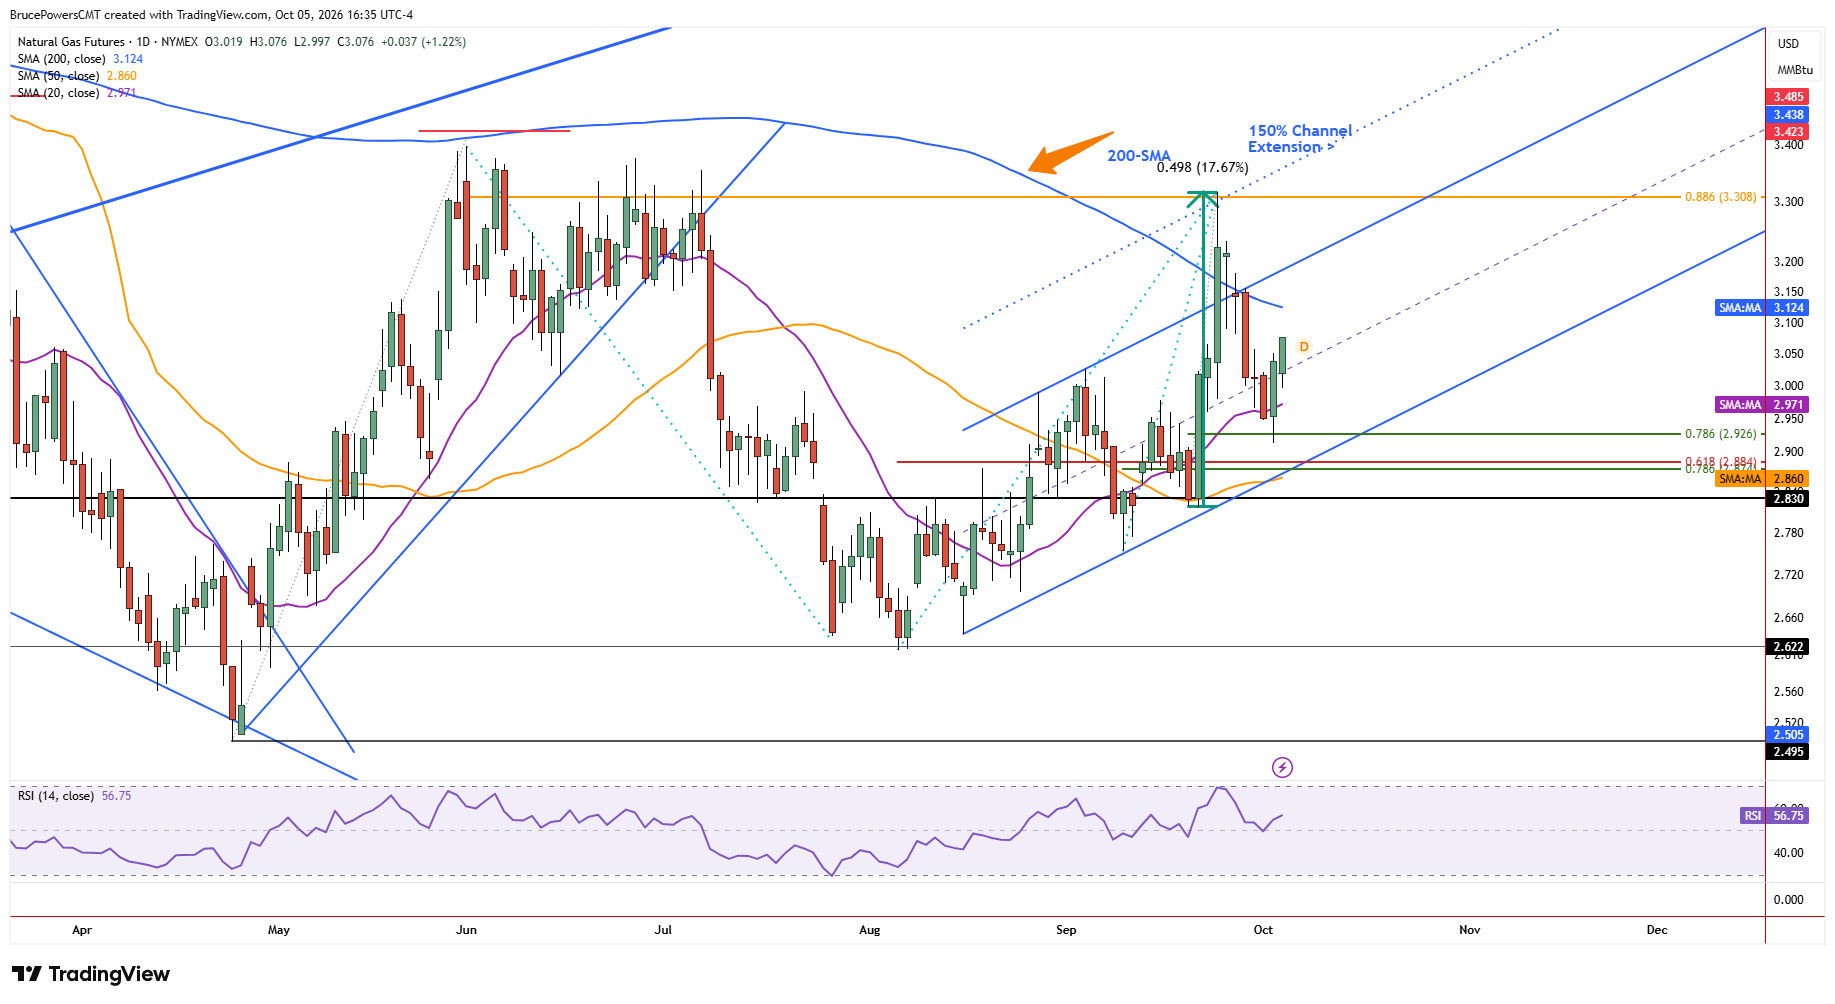
Natural gas extended its recovery on Monday, reaching a four-day high of $3.075, and remaining on track to close at a five-day high. A higher daily low of $2.997 confirmed support at the 20-day moving average following a relatively minor retracement of just over one-third of Friday’s bullish outside day. Although trading continues in the upper range of the day at the time of writing, it is not yet clear whether the bullish extension above Friday’s high of $3.051 will be confirmed by a daily close above that level.

Upside Targets Come Into Focus
Nonetheless, key dynamic support at the 20-day moving average was confirmed, suggesting that upward pressure may continue. Whether that can lead to an eventual recovery above the recent high of $3.317 remains to be seen but it certainly increases the chance that the next upside target at the 200-day moving average near $3.12 could be reached. Last Tuesday’s lower daily high of $3.156 is another initial upside target, along with the upper boundary of a rising trend channel. Since Tuesday’s high found resistance at that upper boundary, the market is highlighting it as an area to watch, either for an upside breakout and further sign of strength or a rejection that results in a decline.
Prior Surge Raises Exhaustion Risk
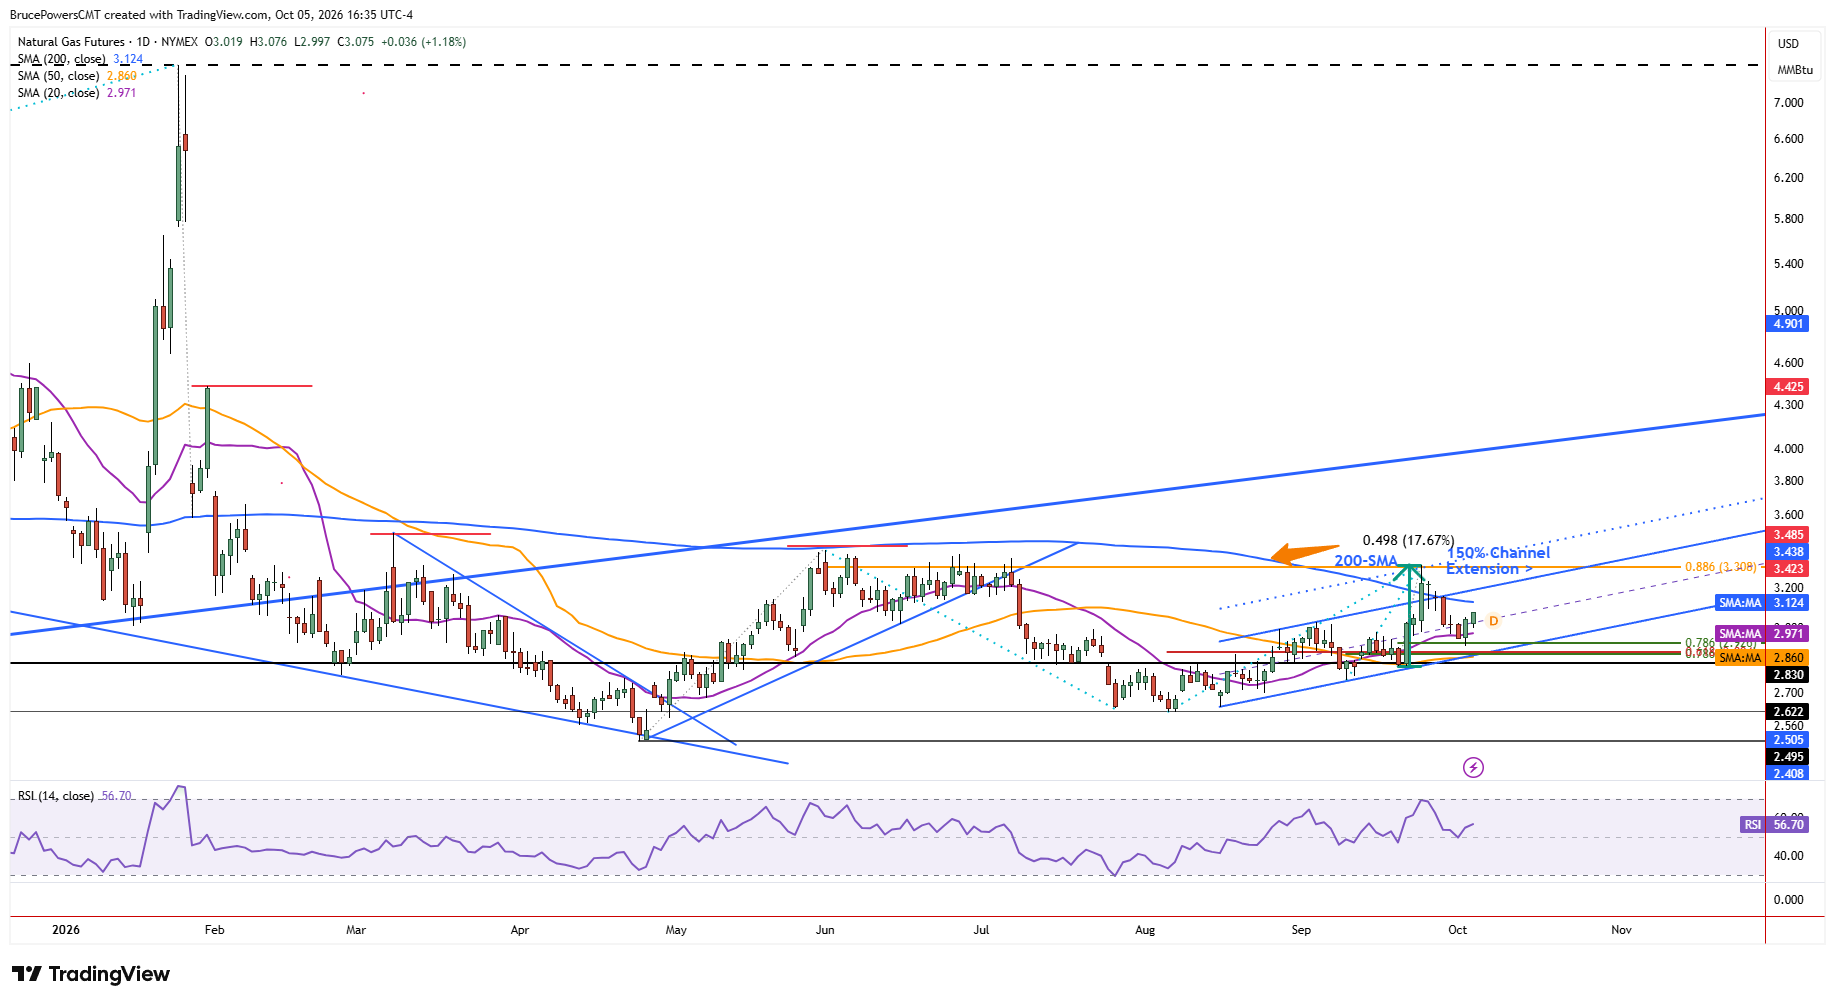
Even if natural gas continues to strengthen, upside potential may initially be limited to the levels noted above given the characteristics of the prior upswing. Natural gas advanced by approximately 17.5% in only three days recently, measured from swing low to high. That high of $3.317 led to trend exhaustion and was followed by a 78.6% Fibonacci retracement of the prior advance on Friday. Although the daily relative strength index (RSI) did not reach overbought during the advance, an upside breakout from a rising trend channel also occurred, resulting in another half channel advance before the correction quickly returned natural gas to the original channel structure.
$3.12 Becomes the Critical Test
For the recovery to regain stronger upside momentum, natural gas would need to sustain a move back above the 200-day moving average before there is a greater chance of advancing beyond the initial targets. For now, that average remains key resistance, with the outlook improving if it can be reclaimed and price begins to hold above it. The confirmation of support at the 20-day moving average has kept the recovery attempt alive, but the reaction to the 200-day moving average will determine whether that support can translate into a broader advance.
If you’d like to know more about how to trade natural gas, please visit our educational area.


