Fibonacci Support Meets Bearish Trend Structure
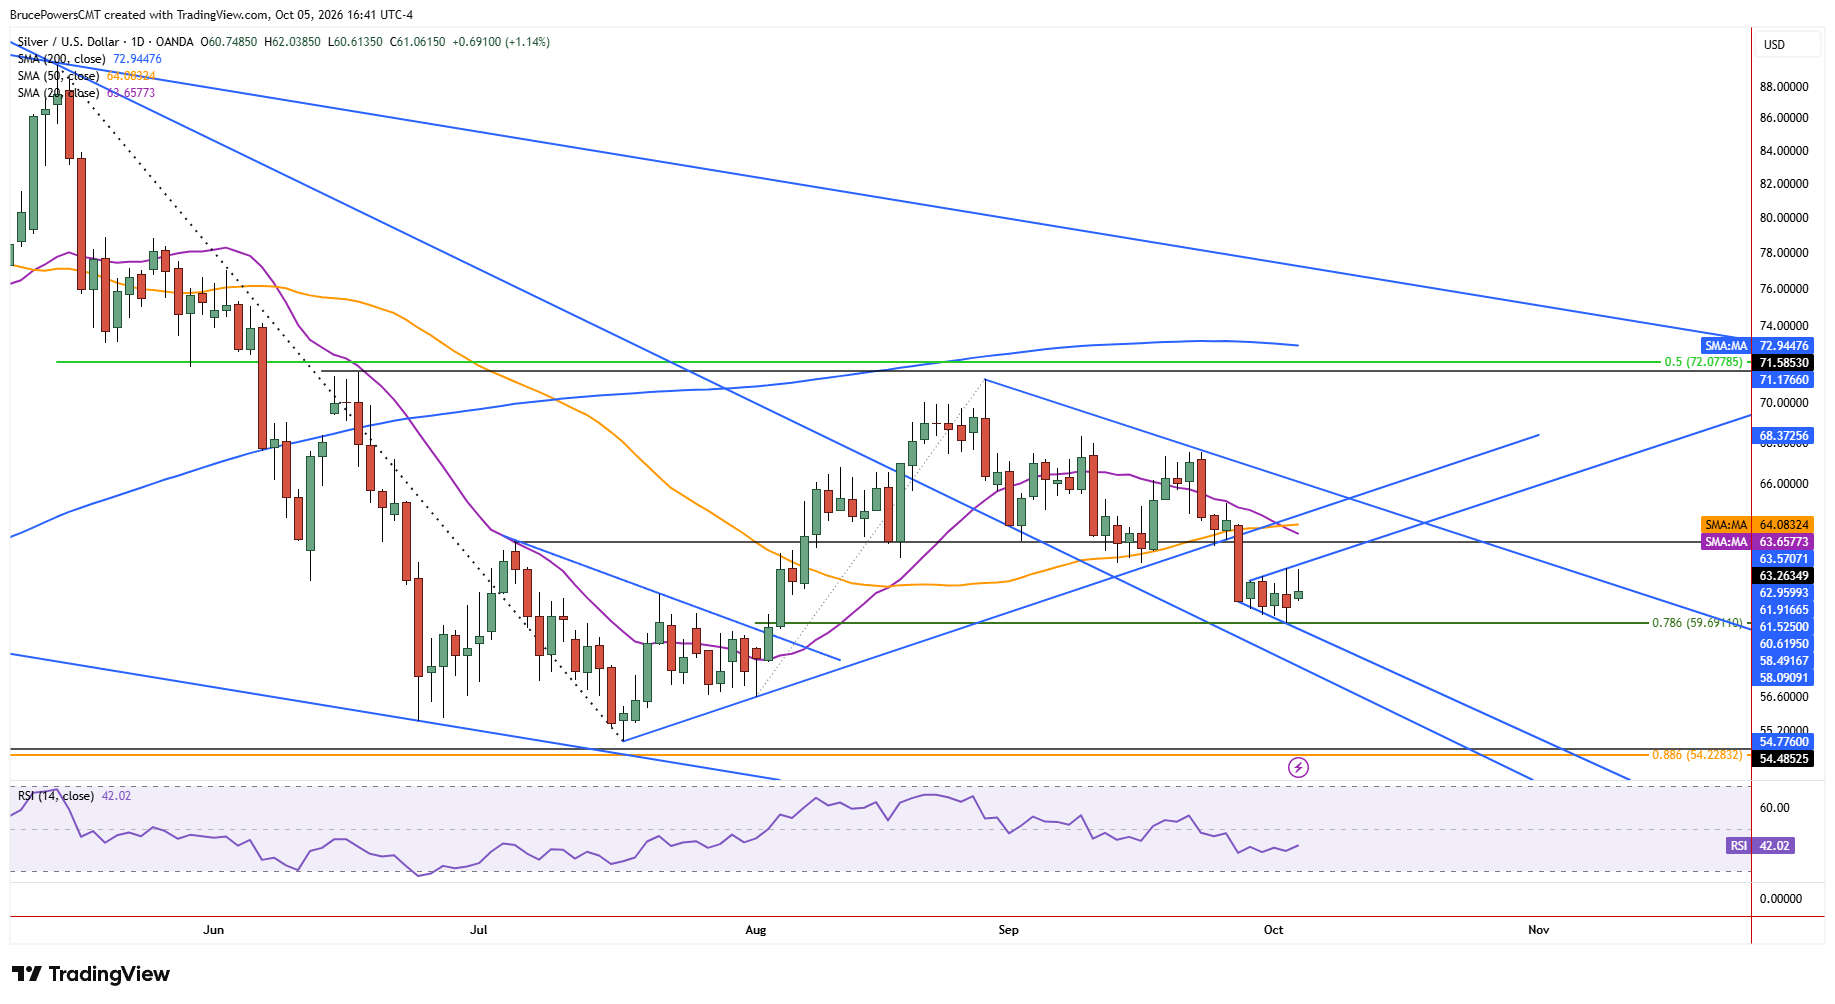
Silver declined last Friday to a potential short-term support level that could begin to attract buyers, but any recovery may quickly encounter resistance as prior support is tested near the $63.28 to $64.11 price zone. A new retracement low of $59.69 was established with the completion of a 78.6% Fibonacci retracement of the prior advance. Typically, successful recoveries from a retracement become less reliable if the 78.6% level is exceeded. That makes the low a higher probability support area based on Fibonacci analysis, although the broader trend structure remains bearish.

$59.69 Becomes Critical Short-Term Pivot
Notably, silver recorded successive lower daily lows for four days as the 78.6% Fibonacci zone at $59.69 was approached. This illustrates how a higher-probability price target can act like a magnet, attracting price toward the level before a move completes. It is not clear yet though whether support will continue to hold and lead to higher prices. Therefore, the reaction to $59.69 is becoming increasingly important for determining the next short-term direction.
Volatility Signals a Broader Price Formation
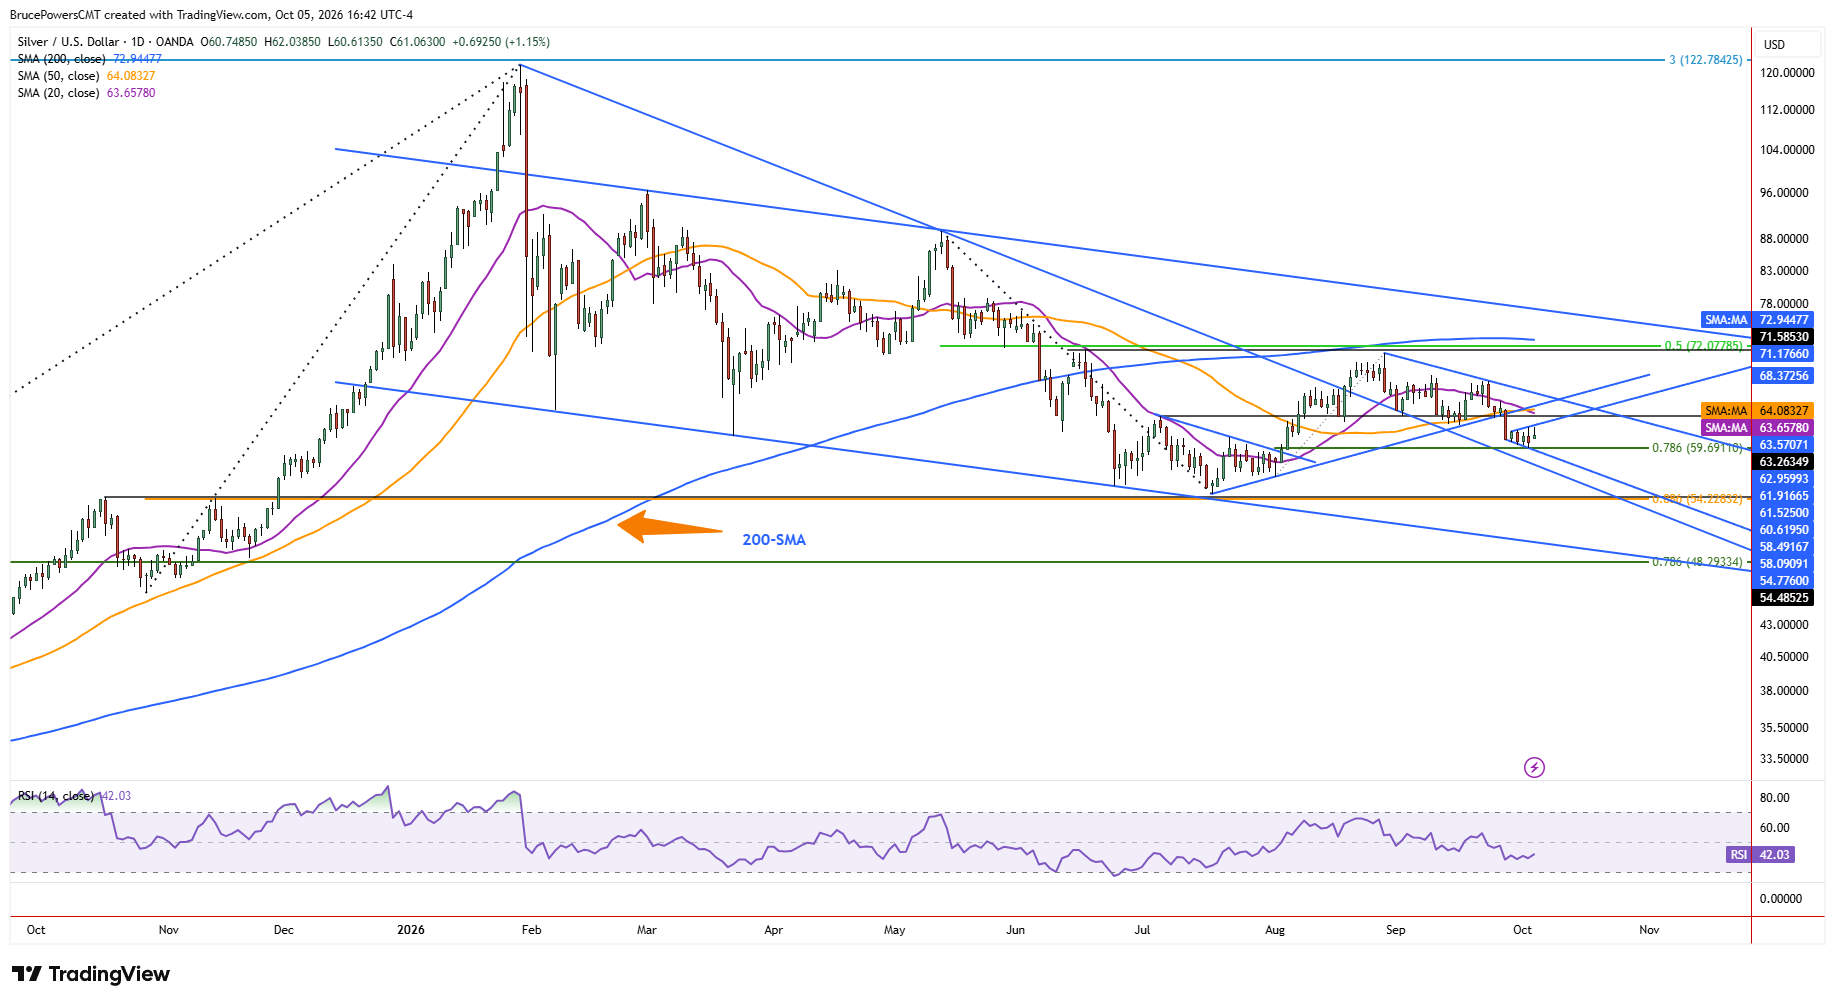
A small consolidation pattern has formed near the low with volatility expanding on Friday to identify key near-term support and resistance at $59.69 and 62.09, respectively. Consequently, Friday’s wide-range candle suggests that the five-day tight range could expand into a slightly larger broadening formation, increasing the potential for initial false breakout signals. Meanwhile, downward pressure is increasing as represented by the 20-day moving average crossing below the 50-day moving average. The bearish crossover also occurred just below a short-term rising trendline that had previously marked dynamic support, adding to the evidence of weakening momentum.
Falling Moving Averages Limit Recovery Potential
The falling 20-day moving average near $63.65 shows that initial upside from a bullish breakout could be limited, with the average declining each day. It could fall to price before volatility picks up, which would mean further short-term consolidation until then. For the bears, a bounce followed by another downswing typically provides tighter risk and a better setup for positioning if bearish momentum resumes after key support breaks.
Breakdown or Recovery Sets Next Direction
For now, a sustained decline below $59.69 is bearish, although the broadening formation could produce a false breakdown. A rally above last Monday’s high of $64.11 shows buyers starting to take back control. Ultimately, the response to the $59.69 support level should help determine whether the current correction stabilizes or extends lower. On the upside, the lower swing high at $67.55 is a key upside target that would need to be recovered before the bullish outlook for silver improves with greater reliability.
Silver Price Forecast
Every new Silver analysis as it publishes, today's technical signal and key levels, live price — on one page.
See all Silver forecastsIf you’d like to know more about how to trade gold and silver, please visit our educational area.