Long-Term Breakout Gains Momentum
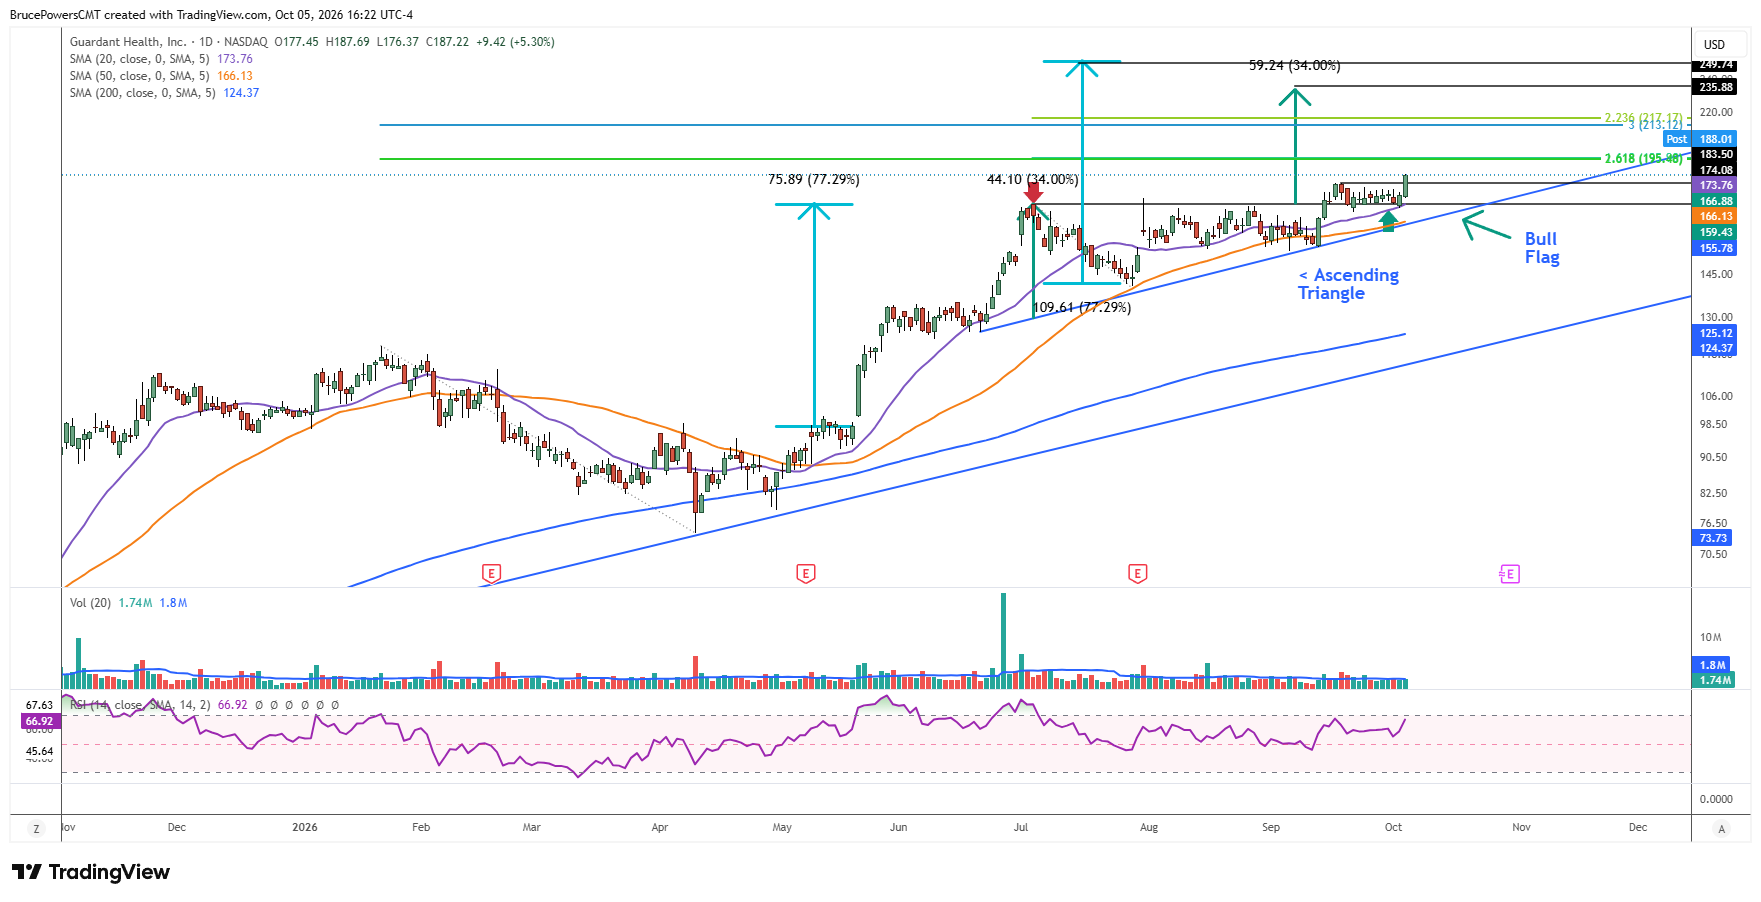
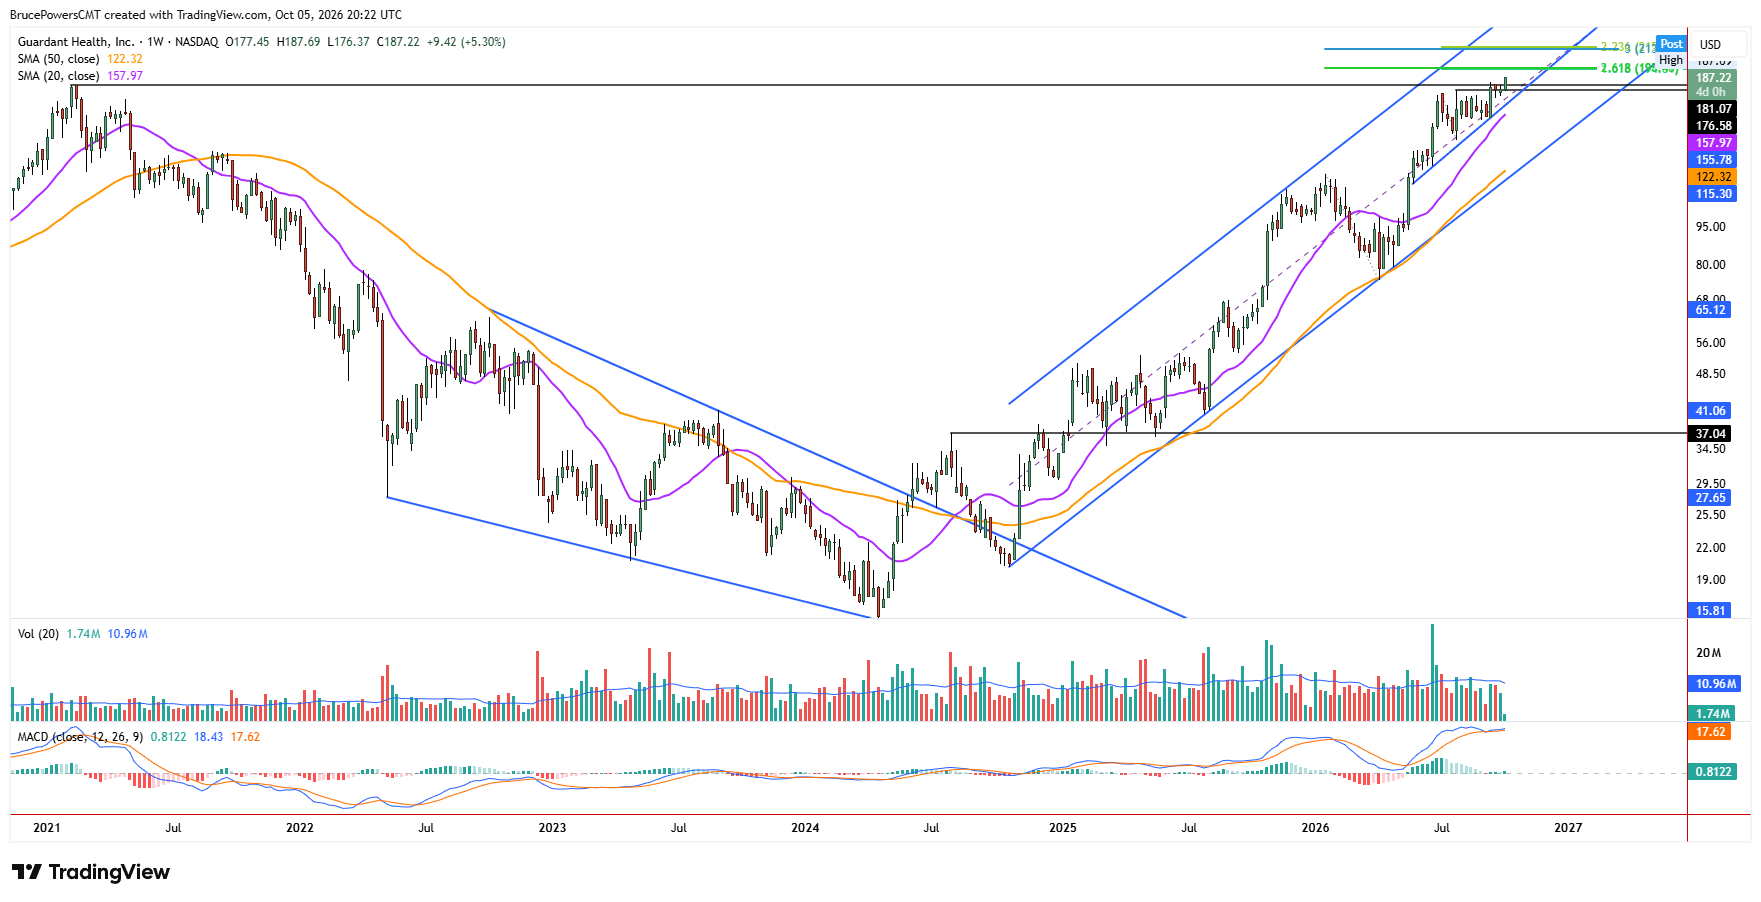
Guardant Health, Inc. (GH), a precision oncology company, extended its recent breakout from a long-term basing pattern on Monday, suggesting that a new leg higher may be beginning. A new record high of $187.38 was reached on Monday after an initial multi-year breakout above the 2021 high of $181.07 triggered in mid-September. Following that initial bullish trend continuation signal, GH consolidated in a relatively tight range near its highs. That consolidation followed a longer ascending triangle formation that preceded the September breakout, providing another bullish continuation signal.

Bullish Patterns Align Across Timeframes
Together, these patterns show a long-term upside breakout accompanied by bullish signals from two shorter-term consolidation patterns. The longer and shorter timeframes are in sync, which could make bullish follow-through more powerful if buyers maintain control.
Fibonacci Targets Map Further Upside
Regardless of what follows, key support has been defined by this week’s higher weekly low of $176.37. The breakout was further confirmed with a daily close above $183.50 on Monday at $187.22, establishing a new record daily closing price for the stock. Several potential initial upside targets are suggested by Fibonacci extensions of prior downswings at $195.88, $213.12, and $217.17. However, the measuring objective from the ascending triangle pattern suggests an eventual upside target near $235.88.
Moving-Average Test Confirms Buyer Strength
Technically, GH is in a powerful position given the bullish pattern alignment across multiple timeframes. If buyers can maintain control above key support, upside follow-through would be consistent with the long-term bullish trend. Smaller bullish confirmation signals include the pullback and subsequent rejection of GH at the 20-day moving average on Friday.
Weakness during that day broke below a seven-day support range before reversing to the upside near the 20-day moving average. A pullback followed by a successful test and rejection of support near a key moving average after a consolidation breakout is typical bullish behavior in a strong stock.
Shortening Consolidations Point Toward $250
The progression from a larger ascending triangle to a smaller bullish flag shows improving underlying momentum. Consolidation is shortening, which reflects increasingly aggressive buyer behavior. In this case, a sharp measured move is estimated using a conservative approach, based on an advance of at least 75.8% that preceded the ascending triangle formation.
That distance added to the $174.08 breakout level points to approximately $249.74. This measured-move objective, together with the Fibonacci targets above, provides additional upside potential if GH can sustain its breakout. The immediate test remains whether buyers can defend $176.37 and keep the stock above its breakout structure.
If you’d like to know more about technical analysis and how traders use it, please visit our educational area.