Two Breakouts Shift the Technical Picture
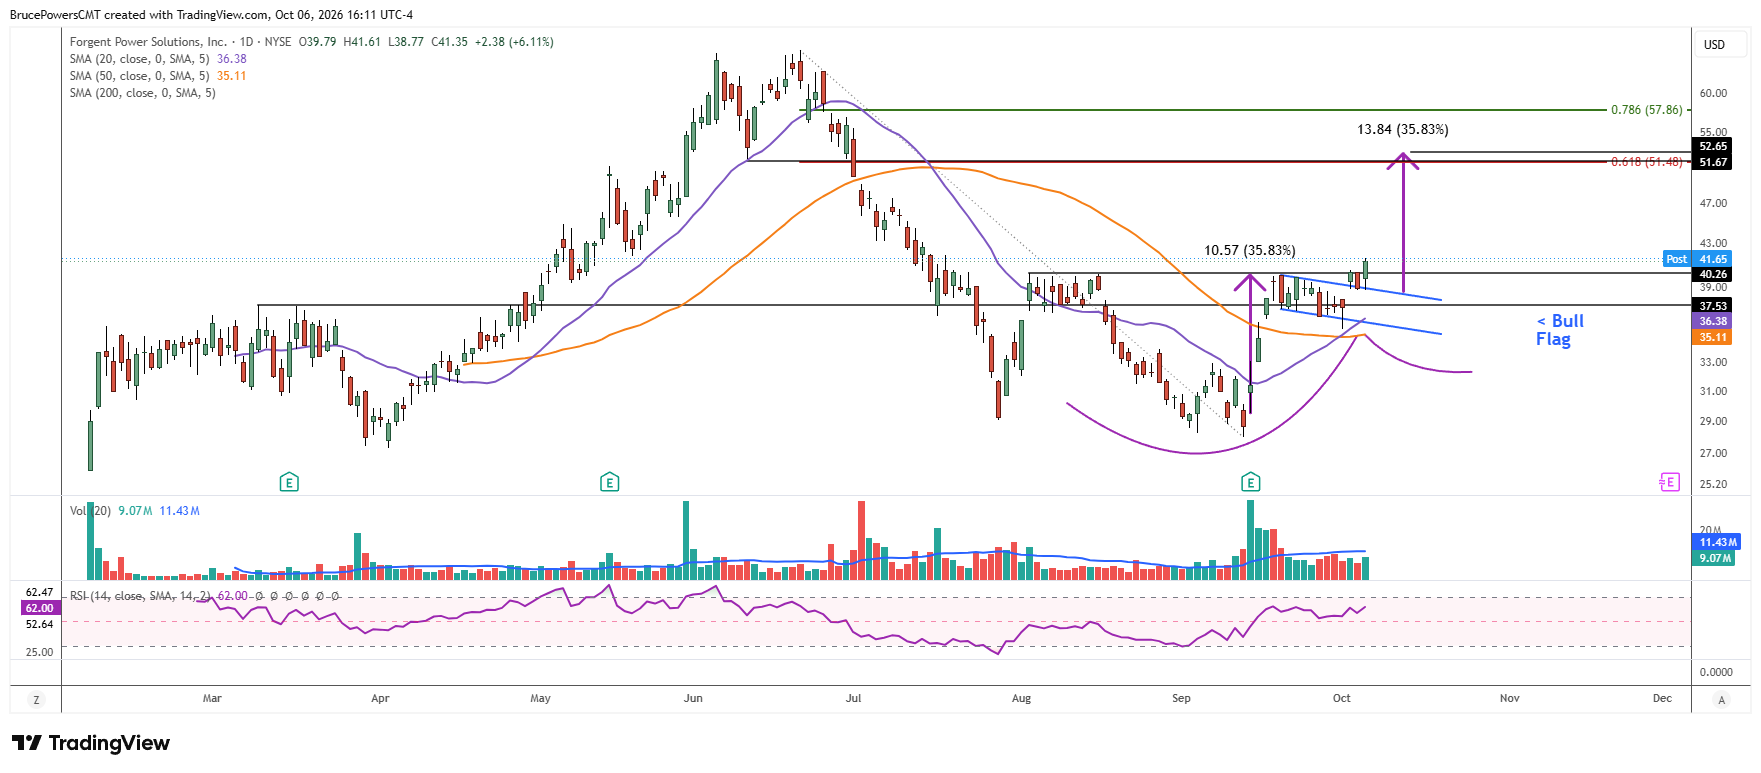
Shares of Forgent Power Solutions (FPS), advanced to an 11-week high of $41.30 on Tuesday, triggering two bullish pattern breakouts and signaling that a significant correction may have ended. The company designs and manufactures electrical distribution equipment, and it has benefited from AI data center expansion. Tuesday’s advance confirmed a breakout from a bottom pattern with resistance at $40.56. That upside breakout followed a bullish signal for a smaller bullish flag pattern that triggered last Friday.

Higher Support Strengthens Bullish Momentum
The bottom of the flag at $35.51 resulted in a higher swing low and bounce off support near the confluence of the 20-day and 50-day moving averages. Those averages were recently reclaimed during a sharp advance of approximately 25.8% that preceded the flag formation. The switch to those averages marking dynamic support is bullish behavior.
Also, bullish momentum was recently confirmed by the 20-day moving average crossing above the 50-day moving average. Nonetheless, key support is at $35.51, and if FPS can stay above it, the bias will remain bullish. This combination of higher support, bullish moving-average momentum, and two pattern breakouts strengthens the developing bullish structure.
$52.65 Zone Marks First Major Test
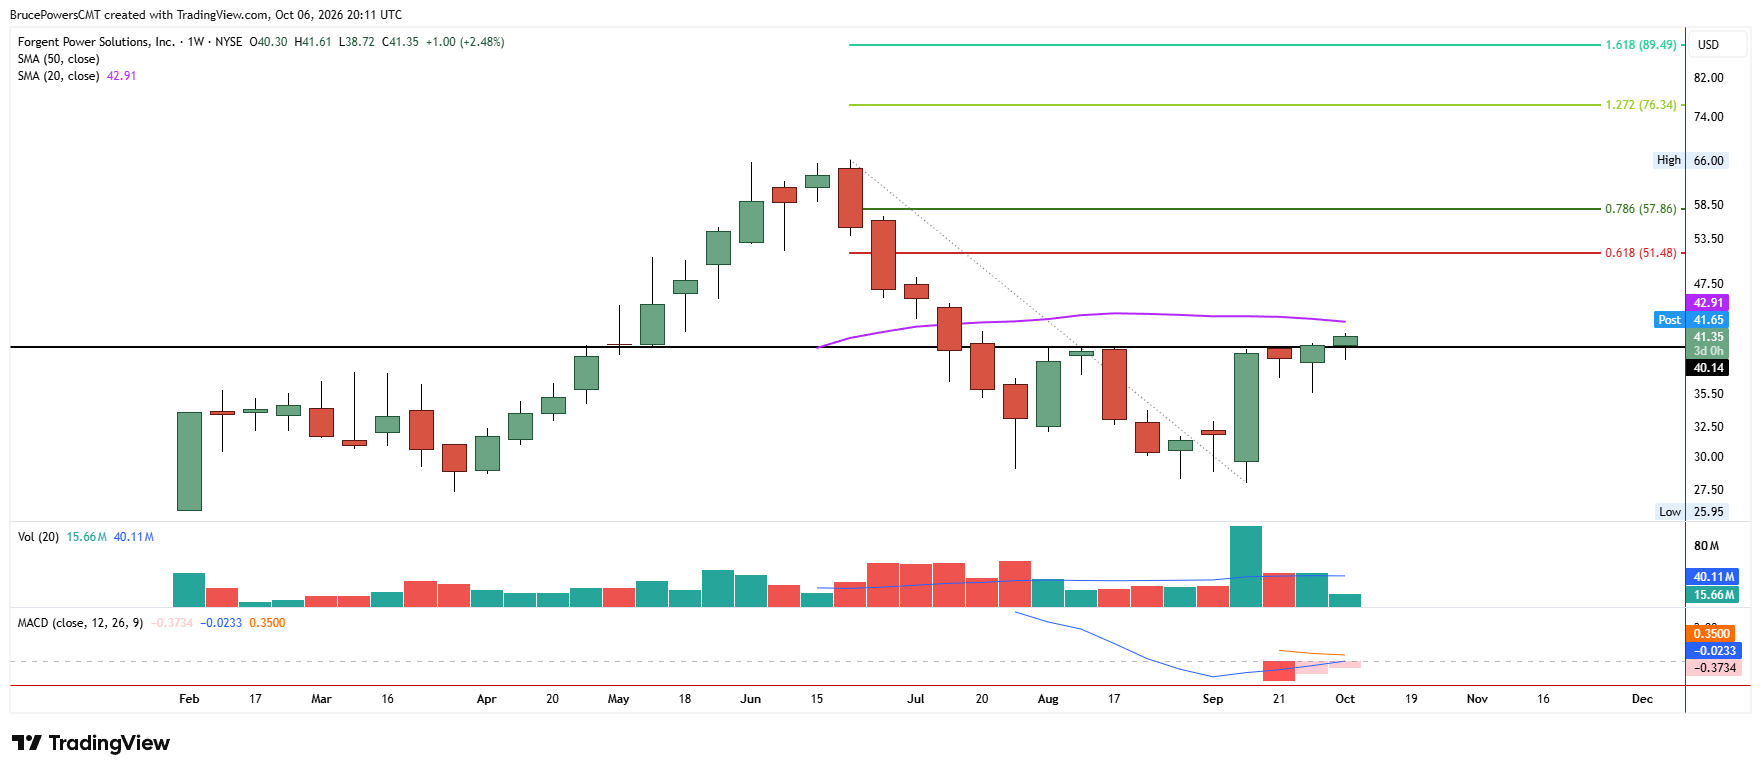
An initial upside target is at the confluence of several indicators from around $51.48 to $52.65. The low of the range is the 61.8% Fibonacci retracement of the prior decline, and the top is a measured move objective from the bottom formation. There is also a prior higher swing low at $51.82 from June, which reinforces the range. A move into this zone would therefore represent the first significant test of the strength of the new advance.
Long-Term Bottom Comes Into Focus
Since the current developing bottom pattern formed near the prior lows from earlier in the year, it seems reasonable to infer that a long-term bottom has probably been established for FPS. This supports the idea that an uptrend may be in its early stages. Therefore, the $66.00 peak in June may eventually be tested or exceeded. A sustained move above the initial target zone would strengthen that longer-term interpretation and put the June peak increasingly within reach.
$35.51 Holds Key to Breakout Follow-Through
Over the past three days, support has been recognized at the upper boundary of the flag pattern, as prior resistance is now shown as support. This would suggest that short-term weakness should find support relatively quickly, and if not, it could be a warning sign that bullish momentum may not be as strong as it currently appears. For now, the bullish breakout structure remains intact as long as FPS holds above $35.51, making that level an important reference for whether Tuesday’s breakouts can develop into a sustained advance.
If you’d like to know more about technical analysis and how traders use it, please visit our educational area.