Fibonacci Support Brings Buyers Back
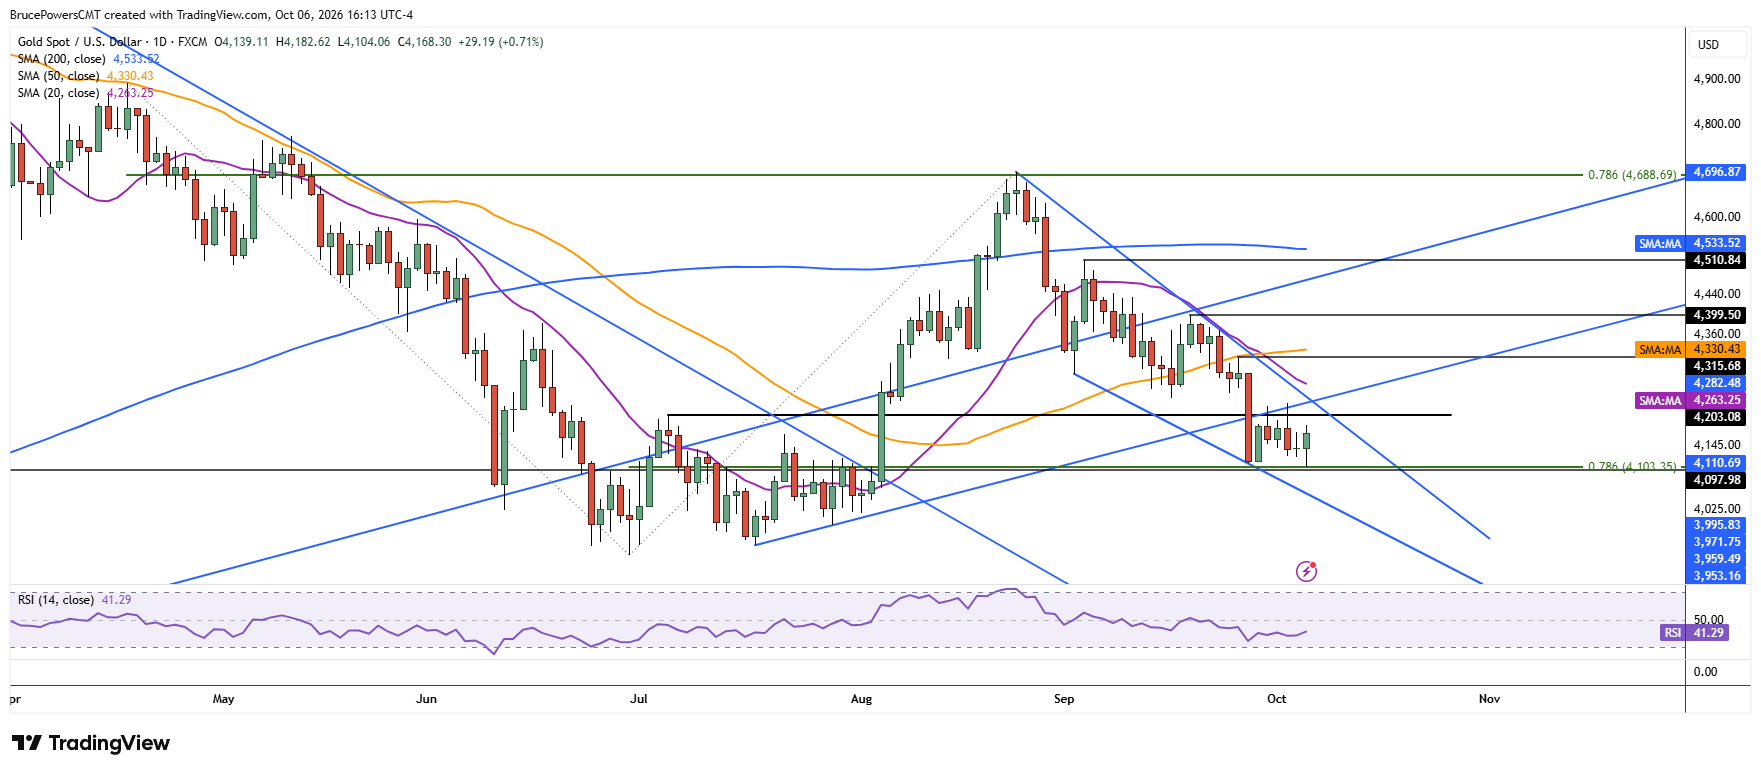
Gold extended its correction to a new retracement low of $4,104 on Tuesday before finding support and staging an intraday recovery. A daily high of $4,179 followed the low, which came after an earlier bullish signal above Monday’s high of $4,170. While a daily close above that high will confirm the short-term signal, gold remains inside a six-day consolidation range with resistance at $4,226 and support now defined by Tuesday’s low.

Bearish Trend Faces a Short-Term Test
Overall, gold remains in a bearish technical position below key trend resistance. Until there are signs to the contrary, the bearish trend is anticipated to continue. However, Tuesday’s price action was bullish for several reasons, although it does not necessarily mean further strength will follow. First, sellers began the session in control, resulting in an extension of the decline, but support was quickly found after gold reached the 78.6% Fibonacci retracement of the prior advance at $4,103.
That was a more specific test of the Fibonacci zone than the earlier low of $4,111 last week. The subsequent bullish reaction from that Fibonacci retracement zone sets up a possible undercut-and-rally pattern. In this case, Tuesday’s bullish hammer candlestick could mark the low for the correction following the completion of a key Fibonacci retracement.
Risk of Chasing Downside Emerges
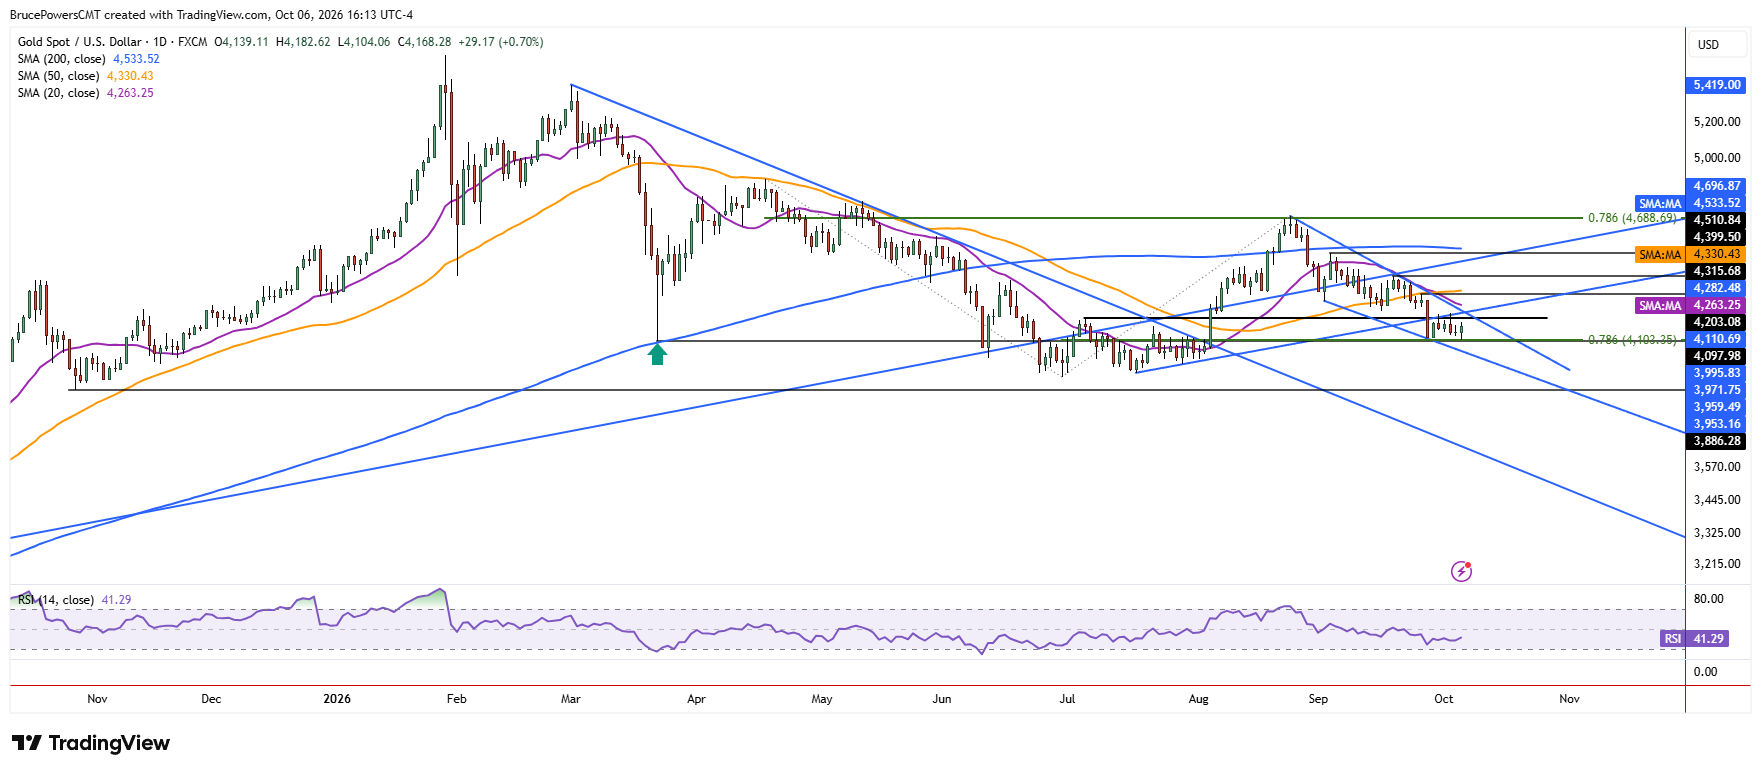
The downside potential for gold may appear too obvious given the bearish trends, and Tuesday’s price action showed the risk of shorting into new lows. This suggests that a bounce may occur before new lows are tested. That bounce could extend into a stronger recovery before being followed by further declines. Therefore, Tuesday’s low at $4,104 becomes an important near-term reference point, as a hold above it would provide early evidence that the bearish trend is losing momentum.
$4,226 Break Would Shift Short-Term Momentum
A bullish reversal signal would trigger on a move above $4,226, with a likely test of resistance at the 20-day moving average to follow, currently near $4,263 and falling. The significance of that moving average was demonstrated during the prior two pullbacks, which found resistance near the 20-day moving average before the bearish trend continued.
Gold Price Forecast
Every new Gold analysis as it publishes, today's technical signal and key levels, live price — on one page.
See all Gold forecastsA key initial upside target is the lower swing high at $4,316, since a rise above it would signal a reversal of the prior short-term decline and put gold in sight of the more significant upside target at the lower swing high of $4,399. For now, Tuesday’s test of the 78.6% retracement and subsequent recovery provide a reason for caution on the downside, but gold must still break above $4,226 before the short-term technical picture meaningfully improves.