



SP500 Tests Historic Highs
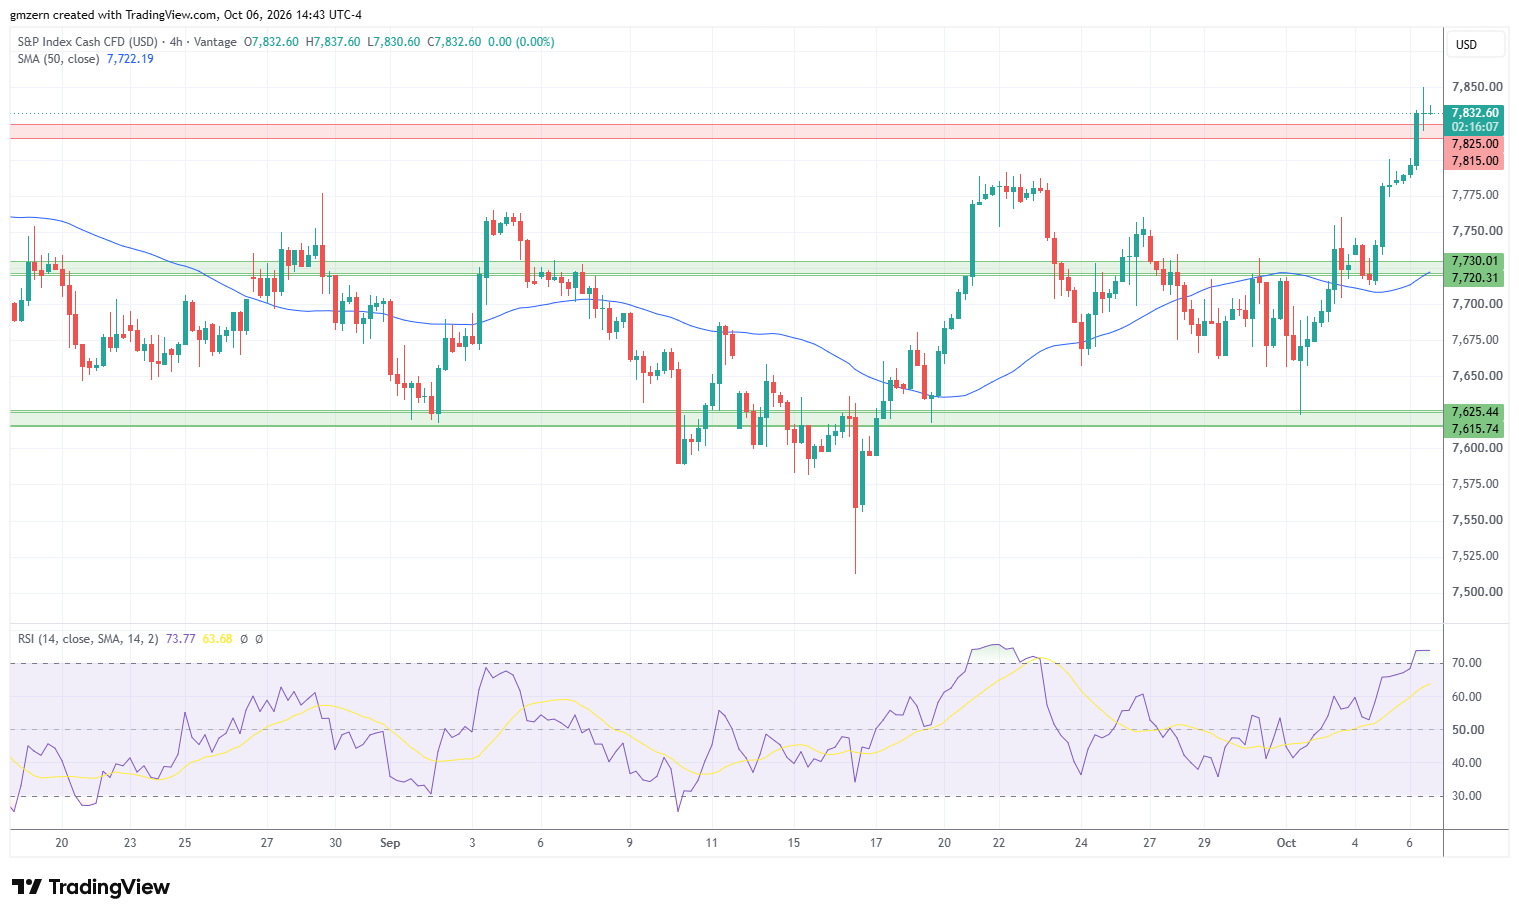
SP500 tests new highs as traders focus on the pullback in Treasury yields and stay bullish on the tech sector.
Treasury yields pulled back as bond traders have started to buy the dip. The yield of 2-year Treasuries declined towards the 4.79% level, while the yield of 10-year Treasuries settled near 5.27%. It remains to be seen whether pullback in Treasury yields will continue in the near term. That said, FedWatch Tool indicates that the probability of a rate hike at the meeting in October declined below the 20% level, which may provide some support to bond markets.
Oil markets rebounded from session lows amid reports indicating that Iran ramped up attacks on tankers in the Strait of Hormuz. Oil traders worry that additional escalation in the Middle East may reduce supply. Interestingly, the rebound in the oil markets did not put material pressure on SP500.
Utilities stocks are among the biggest gainers in the SP500 index today as traders react to the pullback in Treasury yields. The strong rally in Constellation Energy stock, which gained +11.7%, provided material support to the utilities sector. Constellation Energy soared as the company signed a 20-year energy deal with Google. Consumer defensive stocks have also managed to gain strong upside momentum.
Currently, SP500 is trying to settle above the resistance level at 7815 – 7825. In case this attempt is successful, SP500 will head towards the 7900 level. I’d note that RSI is in the overbought territory, so the risks of a pullback are increasing.
On the support side, a move below the 7800 level will push SP500 towards the nearest support, which is located in the 7720 – 7730 range.

NASDAQ Moves Higher Amid Strong Demand For Tech Stocks
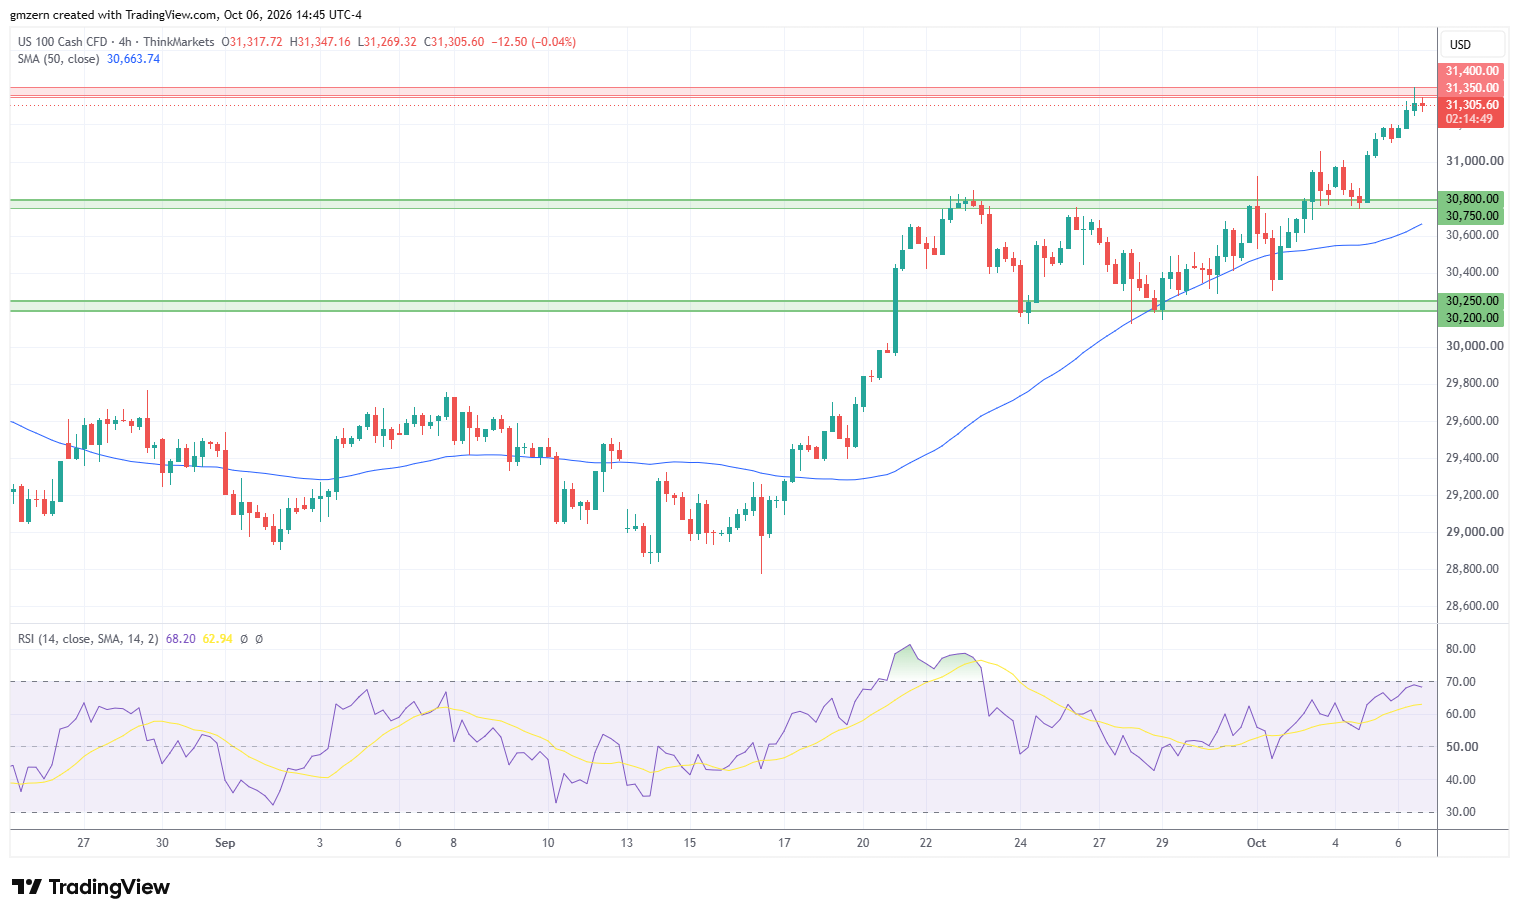
NASDAQ tested new highs as demand for tech stocks remained strong. Constellation Energy was the biggest gainer in the NASDAQ index today. Chip stocks were also among the best performers in the index.
I’d note that demand for software stocks has also increased, which indicates that the market is extremely bullish. From a big picture point of view, software stocks are trying to rebound after multi-month sell-off, which was triggered by worries about the negative impact of AI.
NASDAQ climbed above the previous resistance level at 30,750 – 30,800 and is trying to settle above the next resistance at 31,350 – 31,400. If NASDAQ manages to settle above the 31,400 level, it will head towards the 32,000 level. RSI remains in the moderate territory, so there is enough room to gain momentum in the near term.
Dow Jones Price Forecast
Every new Dow Jones analysis as it publishes, today's technical signal and key levels, live price — on one page.
See all Dow Jones forecastsDow Jones Attempts To Settle Above 51,700
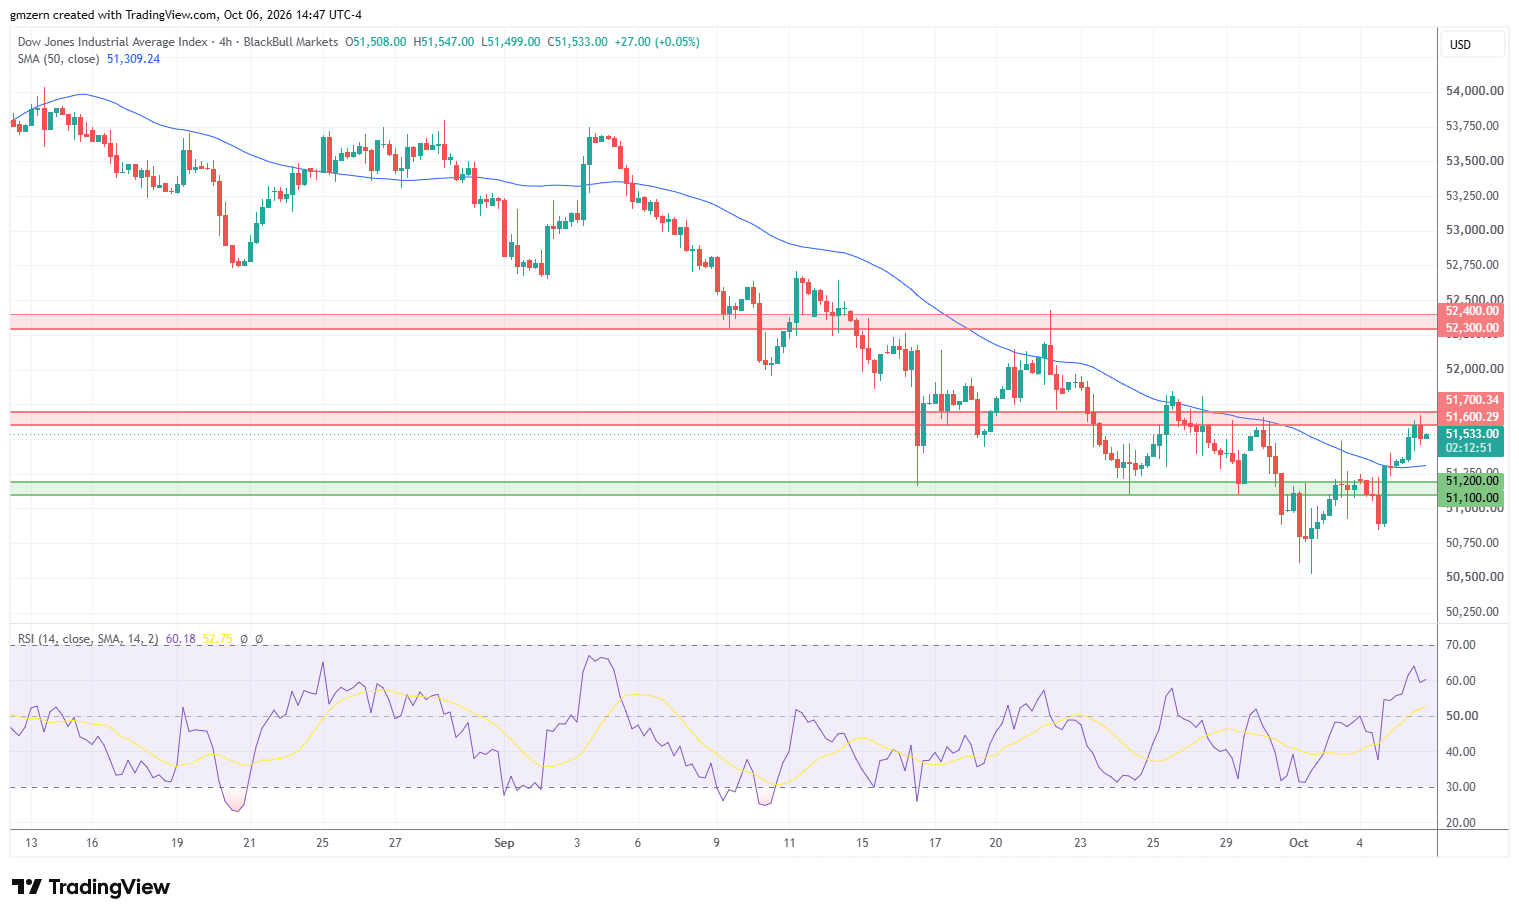
Dow Jones gained ground amid broad rally in the equity markets. Cisco, which is up by +4.3%, is the best performer in the Dow Jones index today.
From the technical point of view, Dow Jones is trying to settle above the resistance level at 51,600 – 51,700. If Dow Jones manages to settle above the 51,700 level, it will head towards the next resistance level, which is located in the 52,300 – 52,400 range.
For a look at all of today’s economic events, check out our economic calendar.


