
Gold Bounced Off a New Low, but Yields Still Control the Trade
Gold took out last week’s low early Tuesday and the sellers couldn’t do anything with it. Buyers stepped in right underneath, and now the daily chart has gold making a possible closing price reversal bottom with the main trend still pointing down.
The bond market handed gold this bounce. Long-term yields and the dollar came off Monday’s highs, and that’s about all the buyers have to work with so far.
At 09:45 GMT, spot gold is trading at $4,153.22, up $12.69 or +0.31%. It opened at $4,143.54, reached $4,158.38 and bottomed at $4,103.52.

A Small Dip in Yields Is the Whole Gold Bounce
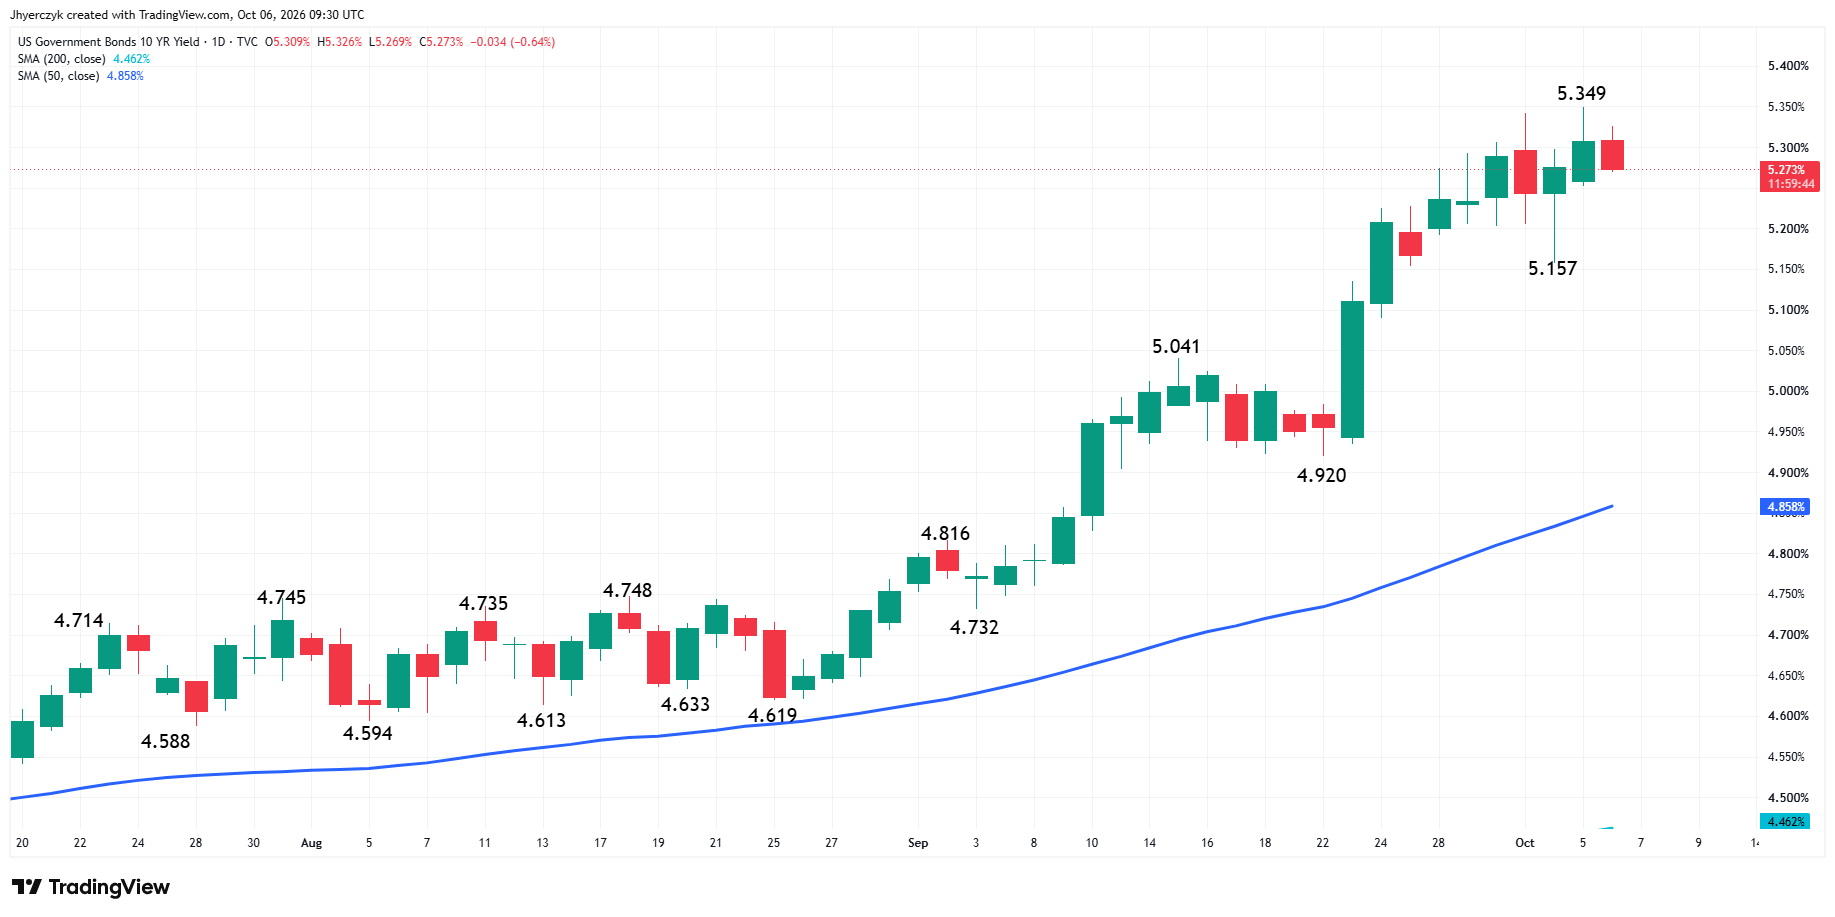
Monday was ugly for anyone long gold. The 10-year Treasury yield hit 5.349% and the 30-year got to 5.703%, levels nobody had seen since 2002, once bond sellers went back to work after the reaction to Friday’s Non-Farm Payrolls report wore off.
Tuesday’s pullback was small. A 3.4-basis-point drop took the 10-year to 5.273%, the 30-year gave back 3.1 to 5.630%, and gold came off the low with them. Neither one is anywhere close to a level that takes the pressure off.
Meanwhile the two-year barely moved near 4.81%, still well below last week’s 4.96% high. The front end calmed down after the weak payrolls number and the long end kept getting sold.
Nobody’s buying long-dated Treasuries with any conviction. The metal will bounce every time yields dip. It needs the long end to stay down if the bounce is going to become more than short-covering.
Gold Price Forecast
Every new Gold analysis as it publishes, today's technical signal and key levels, live price — on one page.
See all Gold forecastsServices Inflation Kept the Bond Sellers in Charge
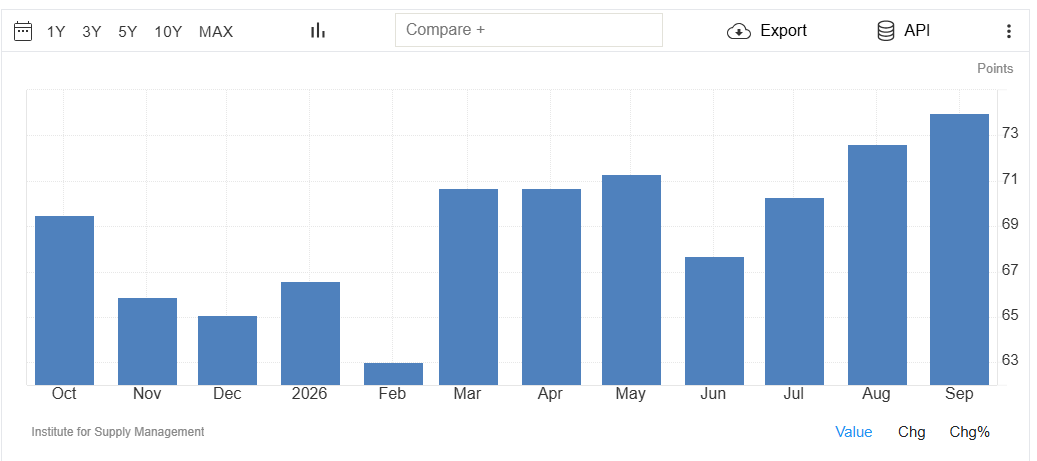
I went straight to prices paid in Monday’s ISM services report, and that’s where the problem was. It rose 1.4 points to 74 and took the 12-month average to its highest since March 2023. The headline index slowed to 54.9 in September, right around expectations and down from August, but traders looked right past it.
Input costs are still going the wrong way with domestic demand stretching supply chains. Payrolls weakened on Friday. Services inflation didn’t, and that kept the bond selloff going after the jobs report.
Wednesday’s Fed minutes are the next read. Traders want to know how worried officials were about long-term yields and whether the September hike had broad support.
December Is Still the Fed Date Gold Has to Worry About
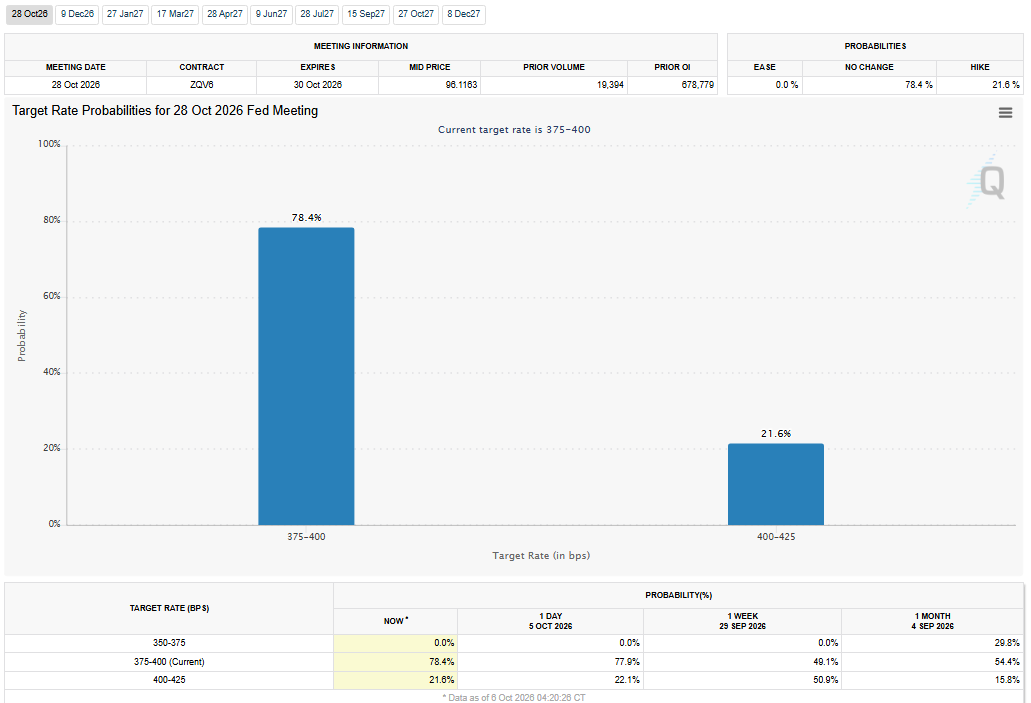
October has calmed down a lot since Friday’s jobs report. FedWatch has a 78.4% chance the Fed sits tight at the October 28 meeting and only 21.6% on a 25-basis-point hike.
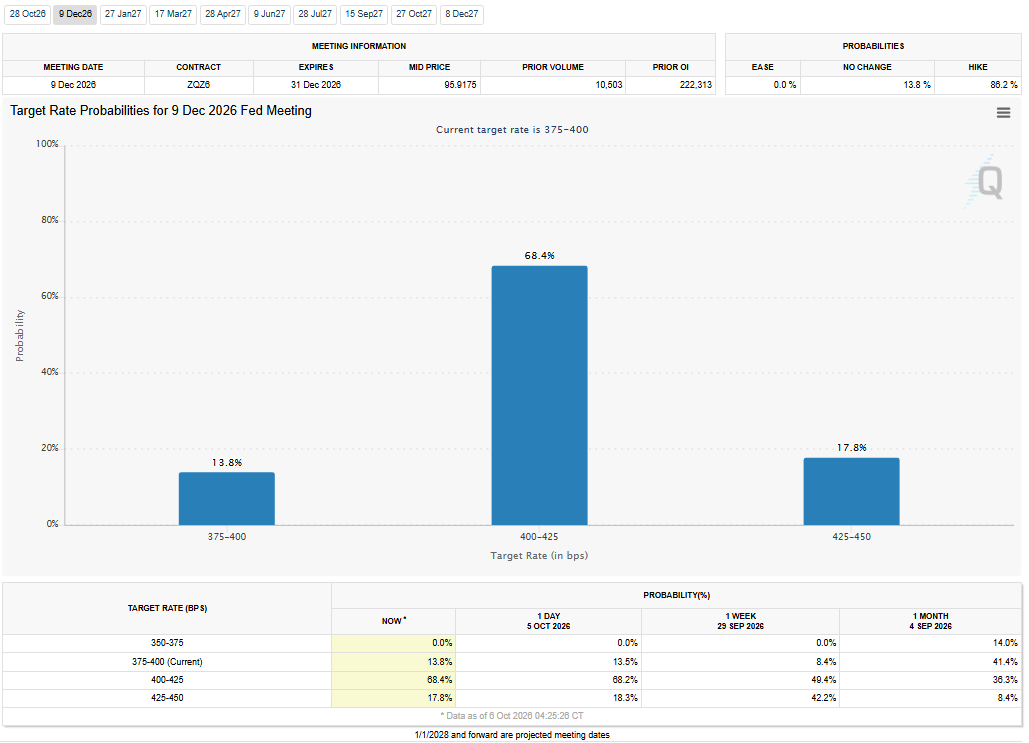
December’s a different trade, with 86.2% odds of at least one hike by the December 9 meeting. The market puts 68.4% odds on a move to 4.00% to 4.25% and another 17.8% on a move to 4.25% to 4.50%.
Gold has to carry both dates, and December won’t go away without softer inflation.
The Dollar Paused but Hasn’t Given Gold Anything
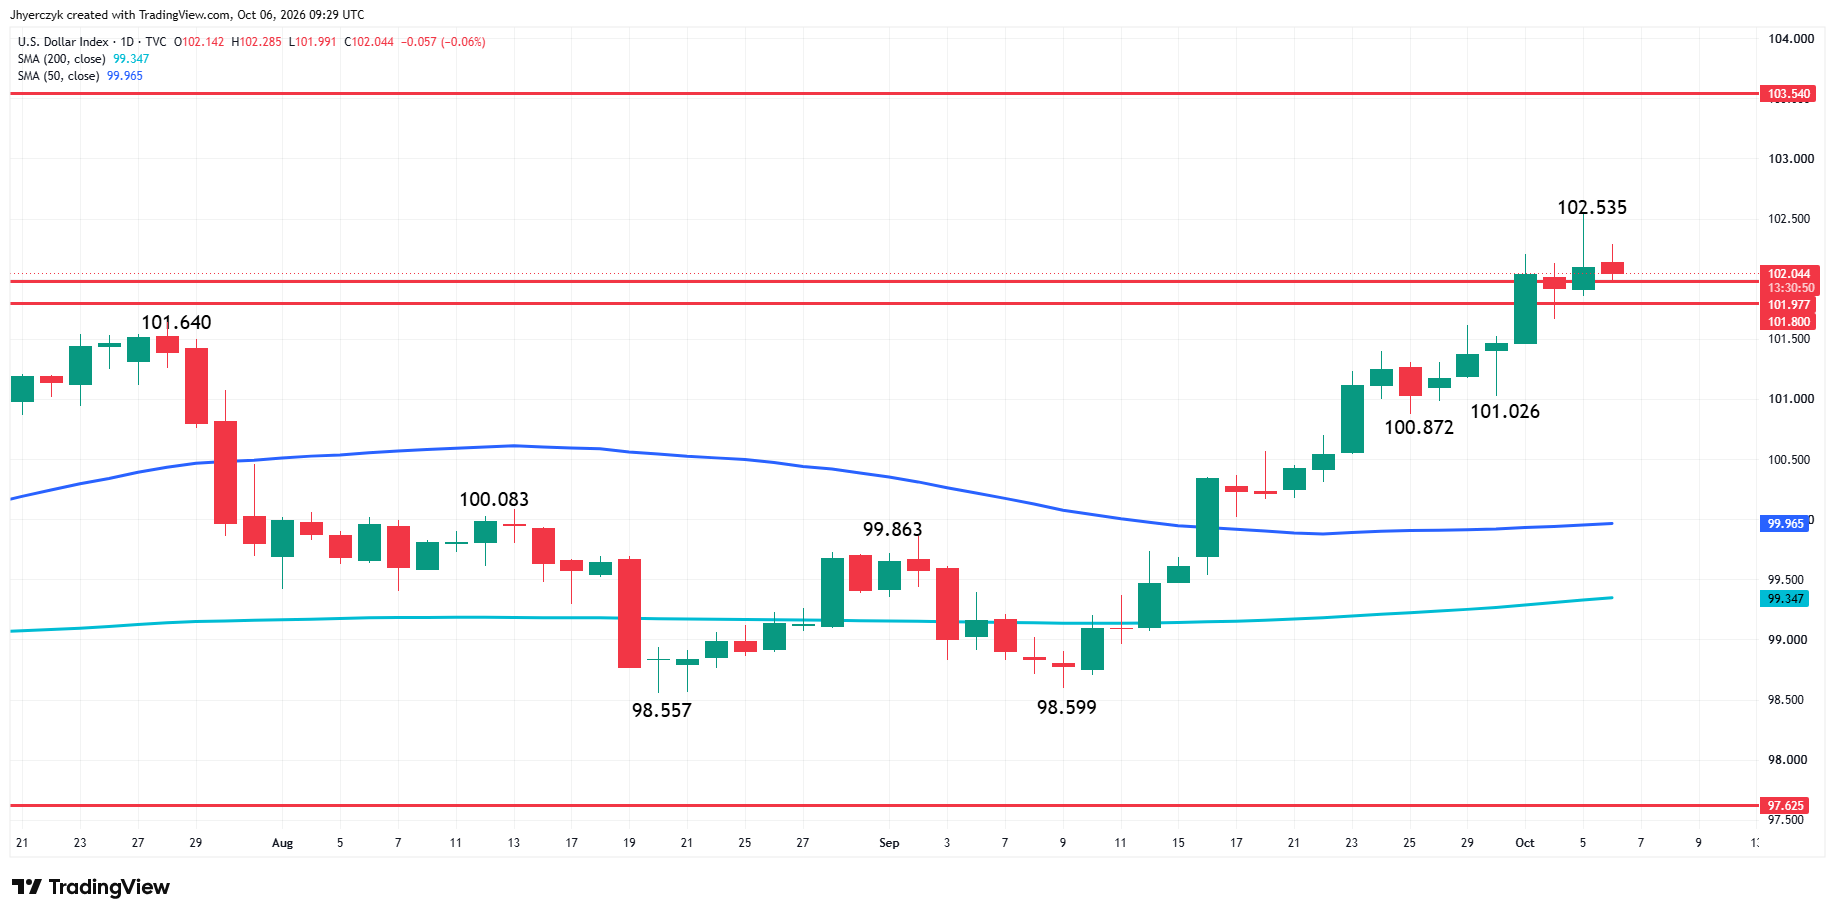
The U.S. Dollar Index reached 102.535 Monday and held near 102 early Tuesday. It was slightly lower on the session at 102.044, but it remains well above its 50-day and 200-day moving averages.
Gold is not getting much help from either side of the financial trade. The dollar has quit going up, but nothing on the chart says it’s breaking down.
No safety bid showed up off the Middle East either. Saudi-backed Yemeni government forces said they retook coastal areas near the Bab el-Mandeb Strait and pushed the Houthis out of much of the territory taken last month. It just was not enough to overcome the rates trade.
Daily Spot Gold (XAUUSD) Technical Analysis
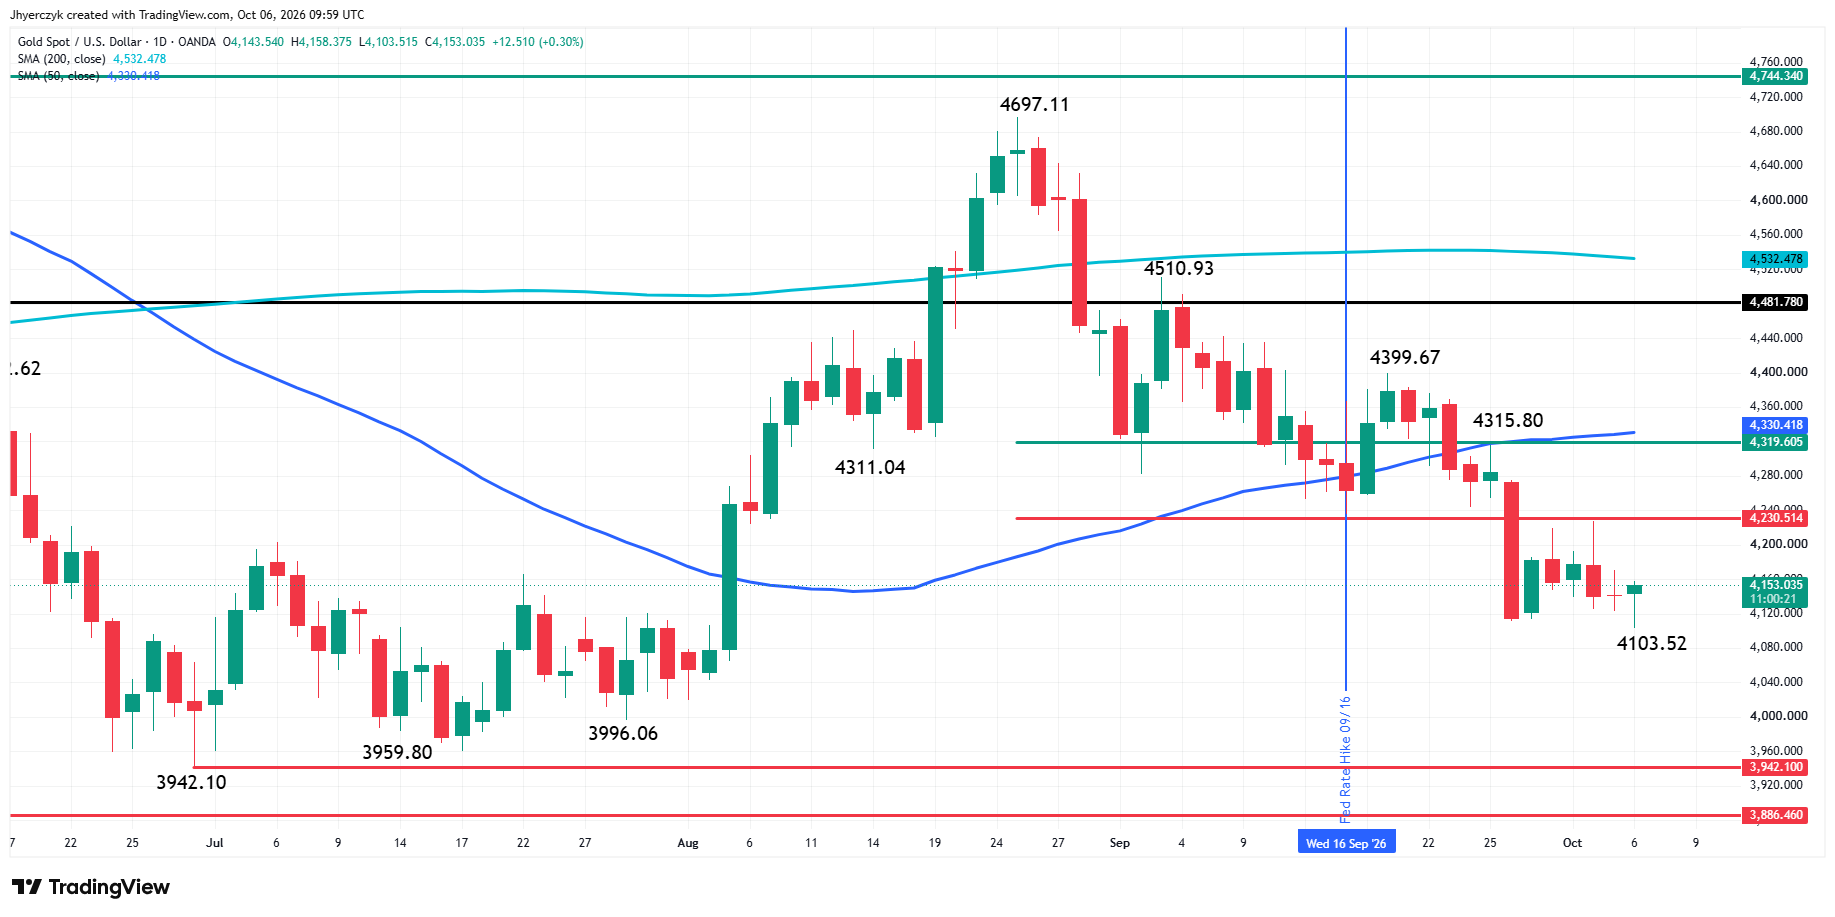
Spot gold is edging higher early Tuesday after reversing earlier weakness that drove the market through last week’s low at $4,110.87. The main trend is down according to the daily swing chart, but today’s early reversal sets up the possibility of a closing price reversal bottom. If confirmed, this chart pattern will not change the trend, but it could trigger a two- to three-day counter-trend rally.
A trade through $4,399.67 will change the main trend to up. A move through $4,103.52 will reaffirm the downtrend.
Nearby resistance is being provided by the long-term 61.8% level at $4,230.51. Overtaking this level could extend the counter-trend rally into the 50% level at $4,319.61, followed closely by the 50-day moving average at $4,330.43.
On the downside, several main bottoms are potential targets, including $3,996.06, $3,959.80 and $3,942.10.
What to Watch
Wednesday’s Fed minutes land on a bond market that kept selling the long end straight through a weak jobs report. Services prices are still climbing and December still carries a hike, so bond buyers don’t have much reason to come in. Gold is trading off long-term yields until that changes.
Gold has a chance to form a closing price reversal bottom after the early washout through $4,110.87, but the bond market still has the final say. Buyers defended $4,103.52 early Tuesday and price hasn’t tested $4,230.51 since. The bias is to the downside because of the bearish main swing chart and the current position relative to the 50-day moving average, and a closing price reversal bottom could shift short-term momentum to the upside without changing the trend.
If you’d like to know more about how to trade gold, please visit our educational area.