
Dollar Index: High Yields Offset Softer Fed Expectations
Although U.S. payrolls increased in September, unemployment rose to 4.2%, and the Fed is expected to cut rates in October, the U.S. dollar is still strong, supported by higher U.S. treasury yields. The spread between the 2 year and 10 year Treasury yields has risen to it’s widest level since 2000. Despite tame labor market conditions and slower wage growth, investors expect the Fed to cut rates to calm higher inflation, prompting a shift in the expected policy path. Long term Treasury yields rose to 18 year highs in September, reflecting elevated inflation expectations.

EUR: French Fiscal Stress and Spanish Politics Deepen the Drag
The fundamental issues affecting the euro have increased beyond monetary policy. In France, uncertainty over the ability of the government to bring fiscal balance has increased market risk. This is particularly the case after the government reached an accord with unions to cut the pension age. Meanwhile, in Spain, uncertainty has returned after Prime Minister Pedro Sanchez called for a November general election.
European Central Bank (ECB) flexibility is challenged by rising inflation. On the 6th of October ECB Chief Economist, Philip Lane, stated that they do not have strong evidence of a general second-round inflationary effect resulting from the energy price shock. Lane states that they will maintain a cautious, data-dependent, approach to policy.
GBP: BoE Tightening Risk Weighs on Fiscal Policy
Sterling is relatively supported against its peers due to expectations the Bank of England (BoE) will further increase interest rates. The BoE believes inflation will rise above 4% in early 2023, and markets believe there is a high chance of a rate increase in November.
The prospect of further fiscal expenditure by the UK government poses a risk to already elevated UK bond yields. On October 28th the finance minister will outline his plans to maintain fiscal responsibility during these tough economic times.
GBP/USD Price Forecast
Every new GBP/USD analysis as it publishes, today's technical signal and key levels, live price — on one page.
See all GBP/USD forecastsU.S. Dollar Index Technical Analysis: DXY Holds 101.76 as 102.49 Remains the Next Upside Test
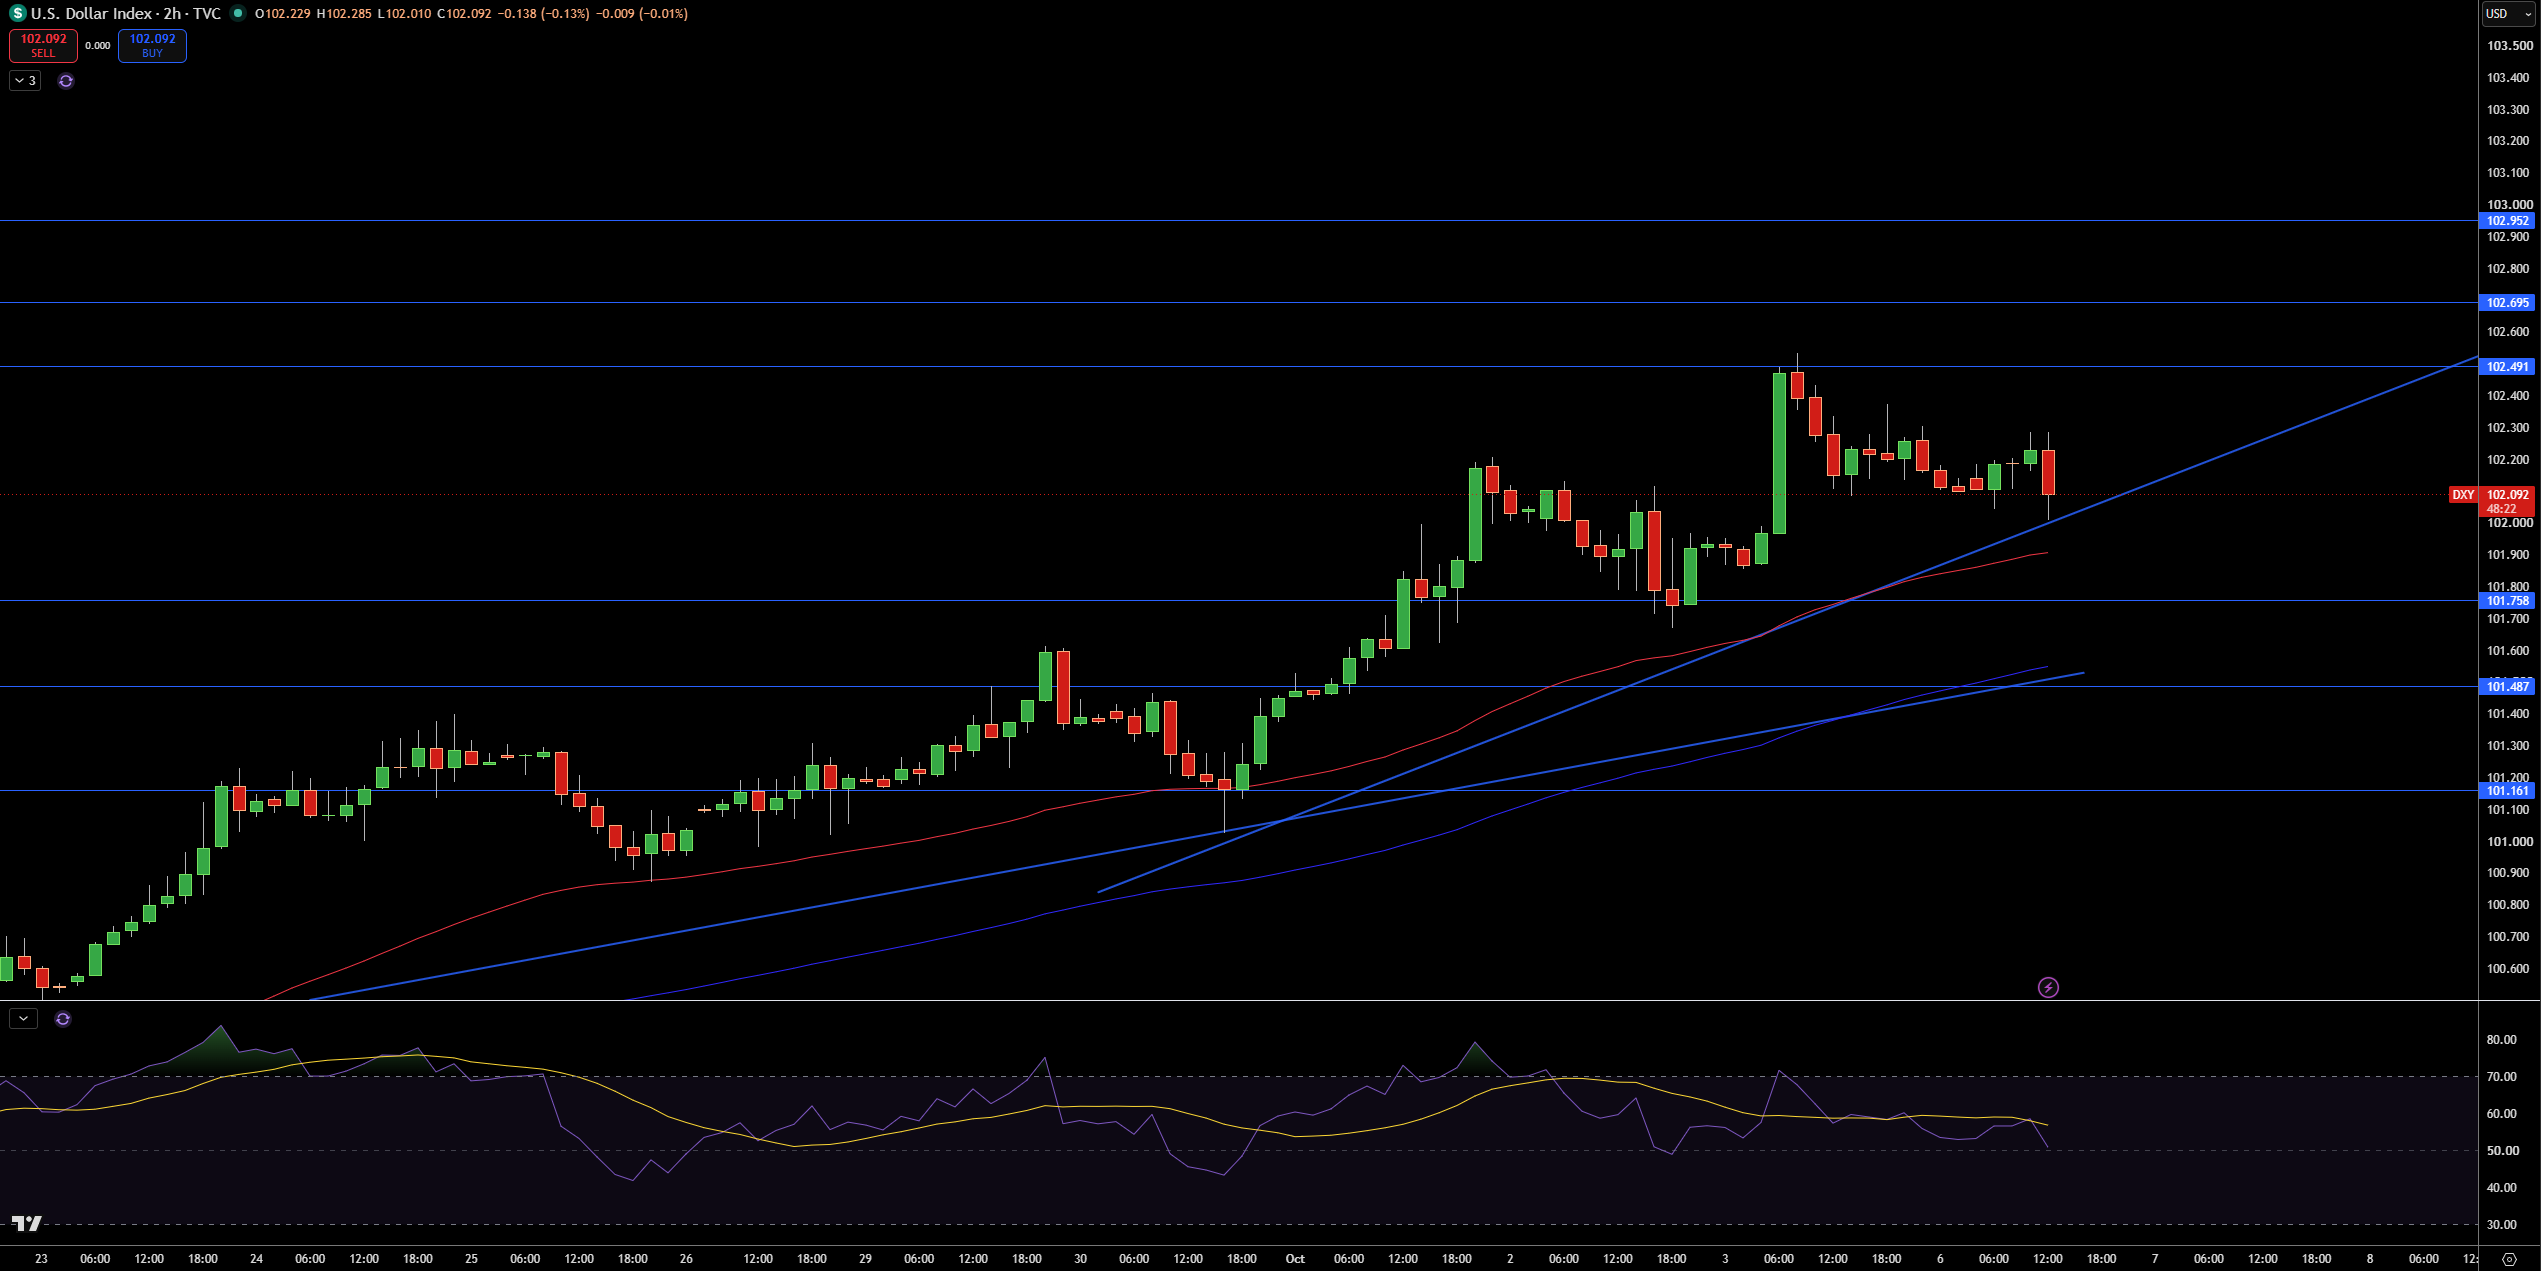
The U.S. Dollar Index is trading near 102.09 on the 2-hour chart, and what stands out to me is the fact that price continues to hold above the rising trendline and both moving averages despite the latest pullback to the 102.49 resistance area. Price action has formed a series of higher highs and higher lows.
102.49 is the first level of resistance, and a clear break above that would open 102.70 and 102.95 to the upside. The rising trendline and the 101.76 level come in as the first line of support, and beyond that 101.49 and 101.16 come in to play.
RSI has cooled from overbought territory, but is still in overbought territory, and as long as that remains the case, I will remain bullish on DXY. A break below 101.76 would negate the bullish case while a break above 102.49 would validate the case for a move to 102.70 and 102.95.
GBP/USD Technical Analysis: Sterling Holds 1.3180 as 1.3250 Remains the Key Recovery Test
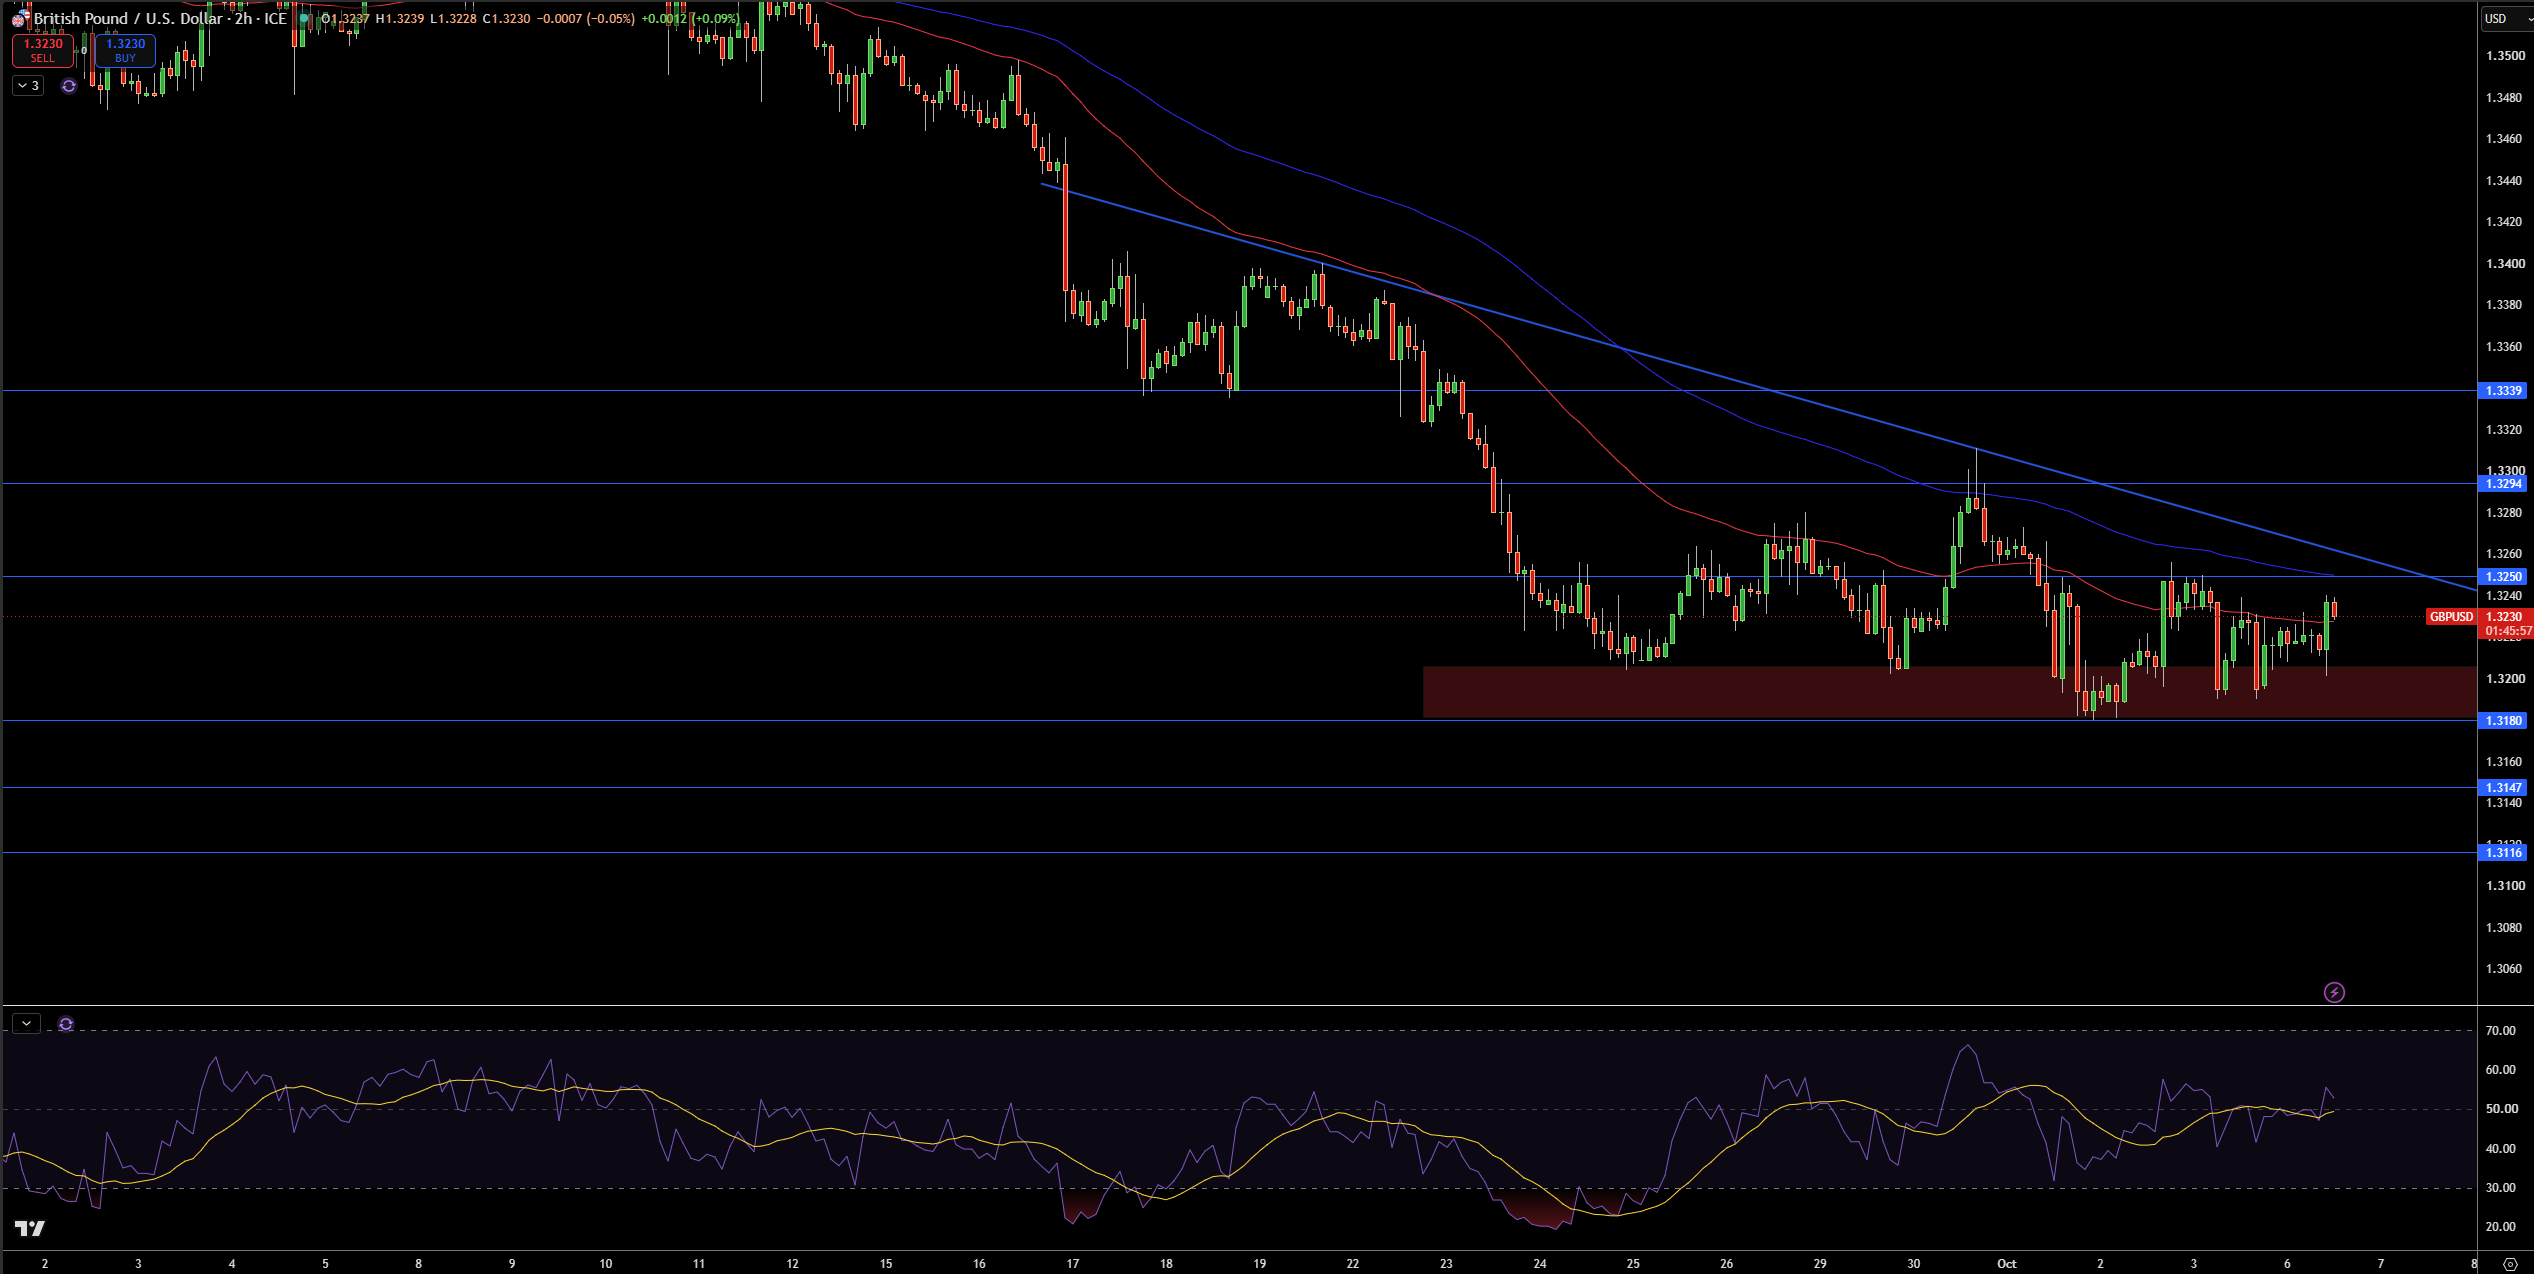
Currently, GBP/USD is trading at 1.3230 and has been holding above 1.3180. 1.3250 has been resistance with repeated attempts to move beyond it unsuccessful. The moving averages are bearish as is the trend line. Until 1.3250 is convincingly broken, the tilt in the structure will favor sellers.
I will look for 1.3250 as first resistance. Above that, 1.3294 and 1.3339 remain key levels. If sellers return to control, 1.3180 would provide support, and if broken, 1.3147 would be the next key level. If we break below 1.3147, 1.3116 would be next.
The RSI is at the 50 level. A break below 1.3294 would reinforce the case for a move to 1.3147/1.3116. Sustained trading above 1.3294 would provide an uptrend to 1.3339 and 1.3385.
EUR/USD Technical Analysis: Euro Breaks 1.1331 Support as 1.1095 Comes Into Focus
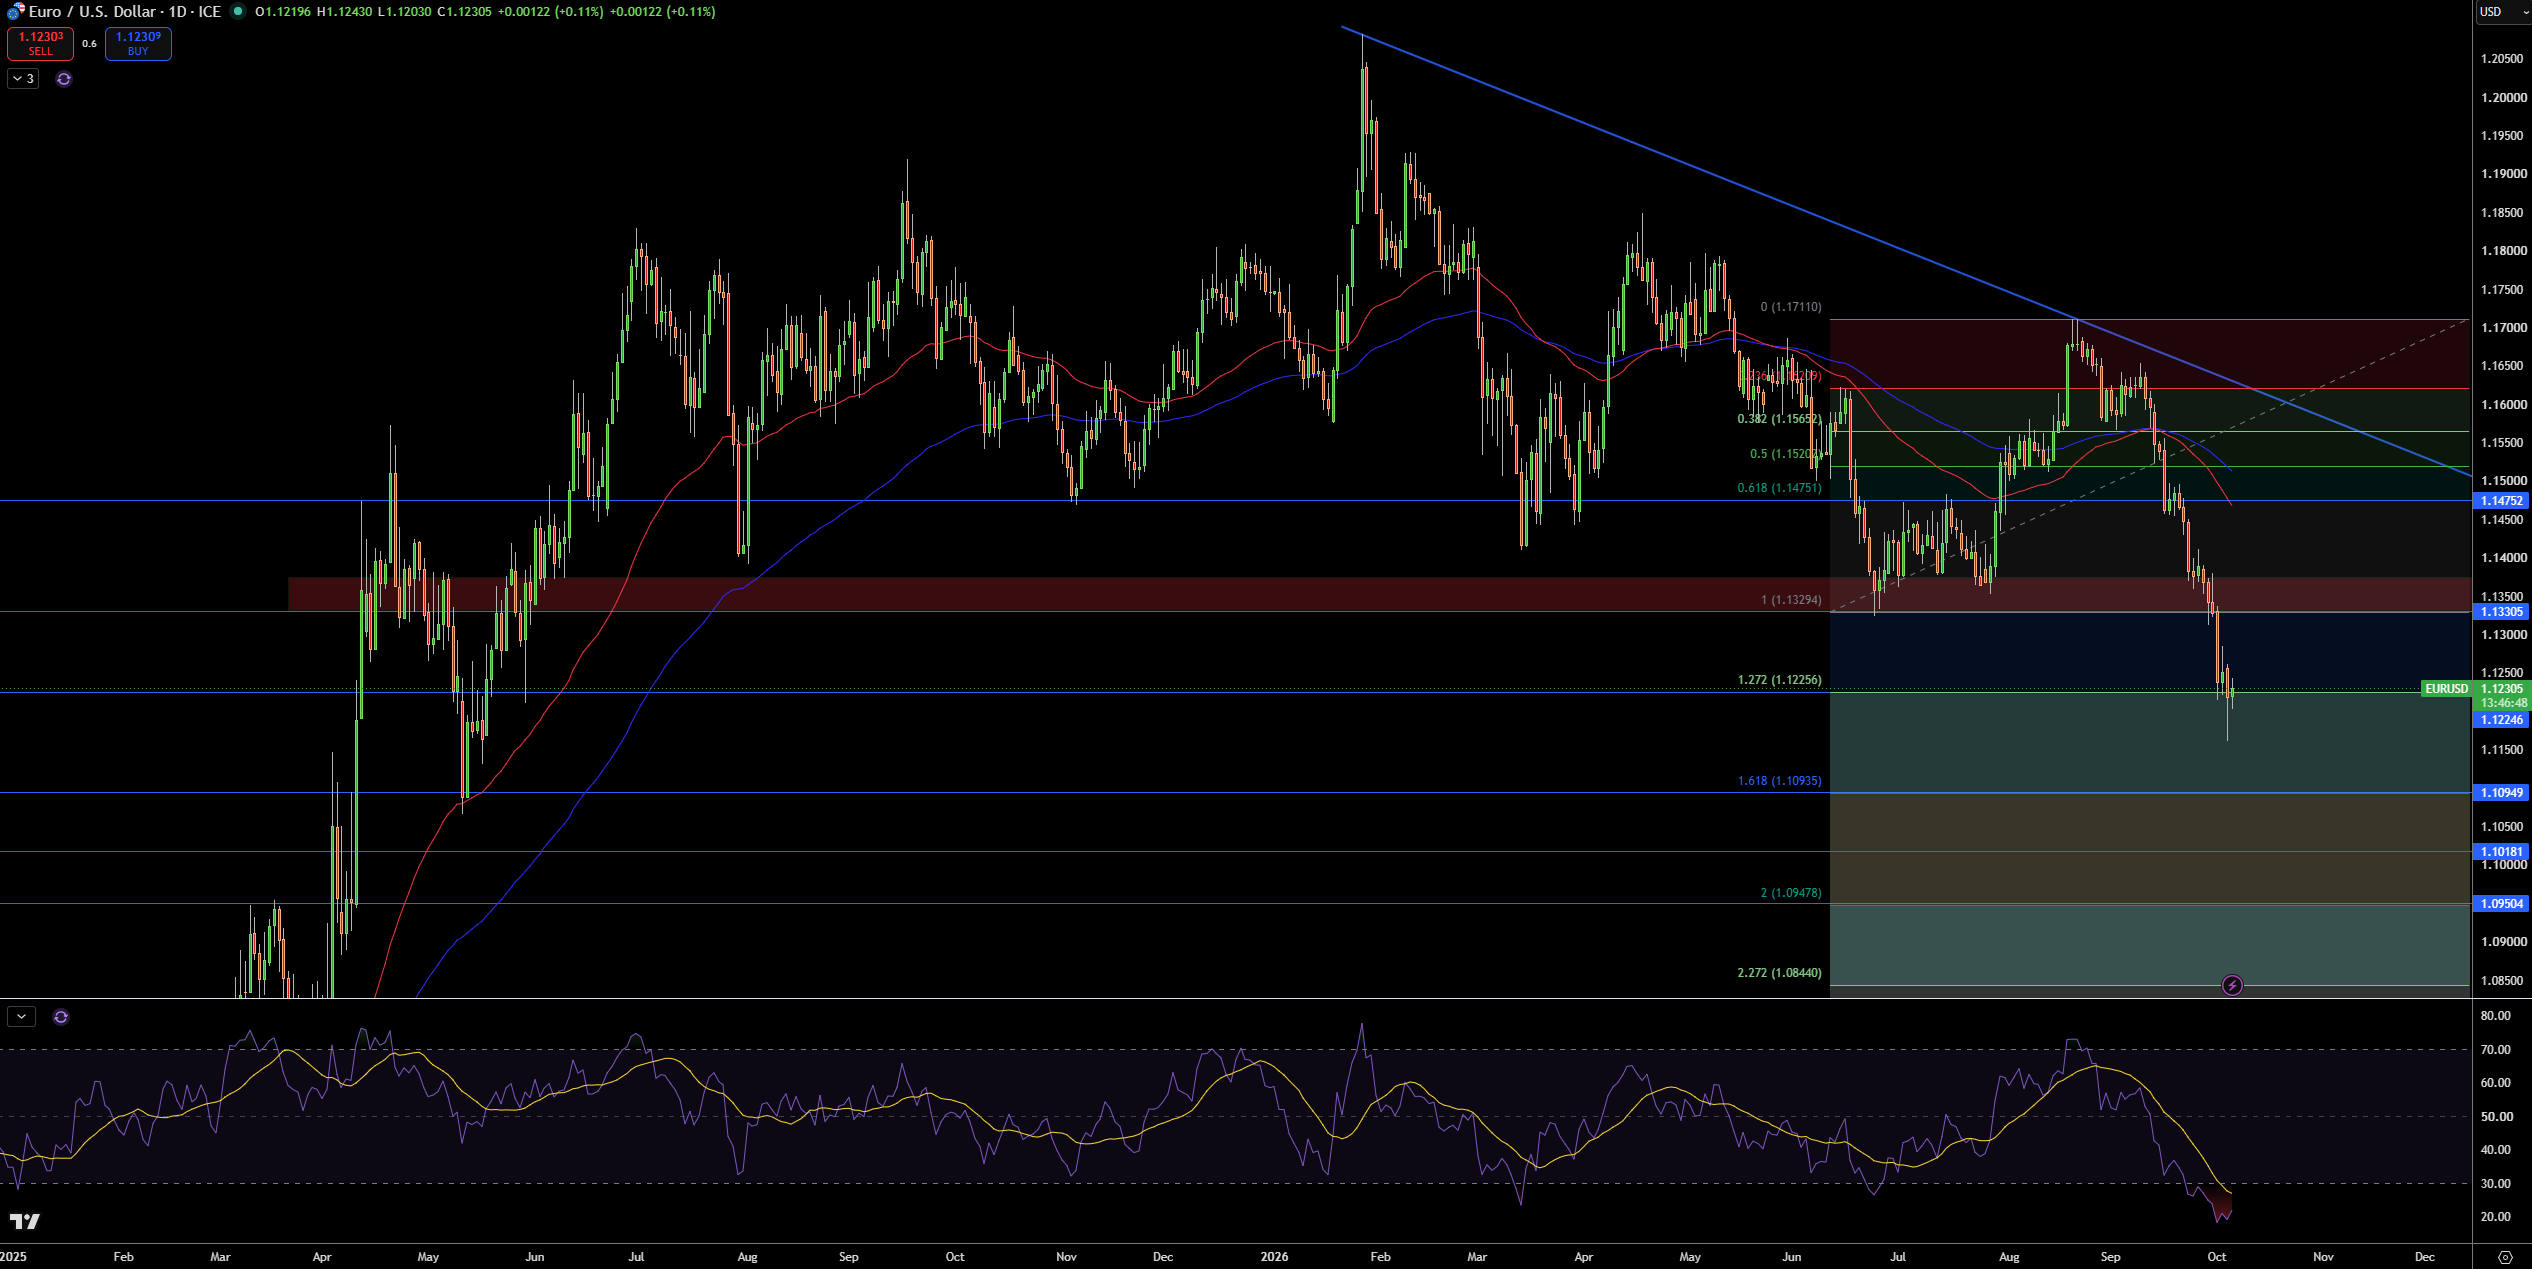
The EUR/USD is trading at 1.1231 on the daily chart and has extended lower and broken through the 1.1331 support area. In the short-term, the bearish outlook is intact while price is below both the moving averages and the bearish trend line. Add to that the recent break lower has pushed price toward the 1.1225 Fibonacci extension, and the larger picture is also bearish.
Support is located at 1.1225, and if broken, support at 1.1095, 1.1018 and 1.0950 would be next in line. Resistance would come in at 1.1331 and 1.1475, if the bulls took control.
RSI is also in oversold territory, indicating the decline is exhausting and a bounce should be expected. However, I am of the bearish camp until the Euro breaks and closes above 1.1331 and the bearish trend line. A close above 1.1475 would put a new long-term bullish view in place. A break below 1.1225 would confirm the bearish view and target 1.1095.