
Dollar Index: Fed Minutes Take Focus as October Hike Bets Recede
The U.S. Dollar’s fundamental backdrop should remain supportive, even if expectations of an immediate Fed Funds rate hike have subsided. Markets assign only a 20.5% chance of a 0.25% increase in October, down from ~51% last Wednesday. Bets of an increase by December are higher at 84.5%. Investors will be looking for clues on the Fed’s ‘terminal rate’ in the upcoming release of the minutes from the September FOMC meeting.

EUR: French Fiscal Relief Offers Only a Temporary Reprieve
The EUR remained under fiscal and political uncertainty in the eurozone. French sovereign debt rallied after Presidential hopeful Marine Le Pen increased her proposed spending cuts to €140bn from €125bn. Political announcements will likely remain the principal driver for French bonds for the remainder of the year.
Challenges remain. The French-German 10-year yield spread widened to almost 160 basis points last week, as doubts increased about whether France would be able to control its budget deficit. Political uncertainty has also increased in Spain after the announcement of snap elections.
GBP: Persistent Inflation Keeps BoE Tightening Risk Alive
As for the UK pound, the focus remains on persistent inflation. This week, BOE Policymaker Catherine Mann said that inflation could rise to 4% by the end of the year and persist in wages.
The Bank of England left its main policy rate at 3.75% on September 17, but a growing number of officials have signaled that the energy price increase could cause persistent second-round inflation. Concerns about the public finances remain, with the yield on Britain’s 30-year gilt recently rising above 6%, the highest level since 1998. This is before the October 28 budget.
GBP/USD Price Forecast
Every new GBP/USD analysis as it publishes, today's technical signal and key levels, live price — on one page.
See all GBP/USD forecastsU.S. Dollar Index Technical Analysis: DXY Holds 101.76 as 102.49 Remains the Key Upside Test
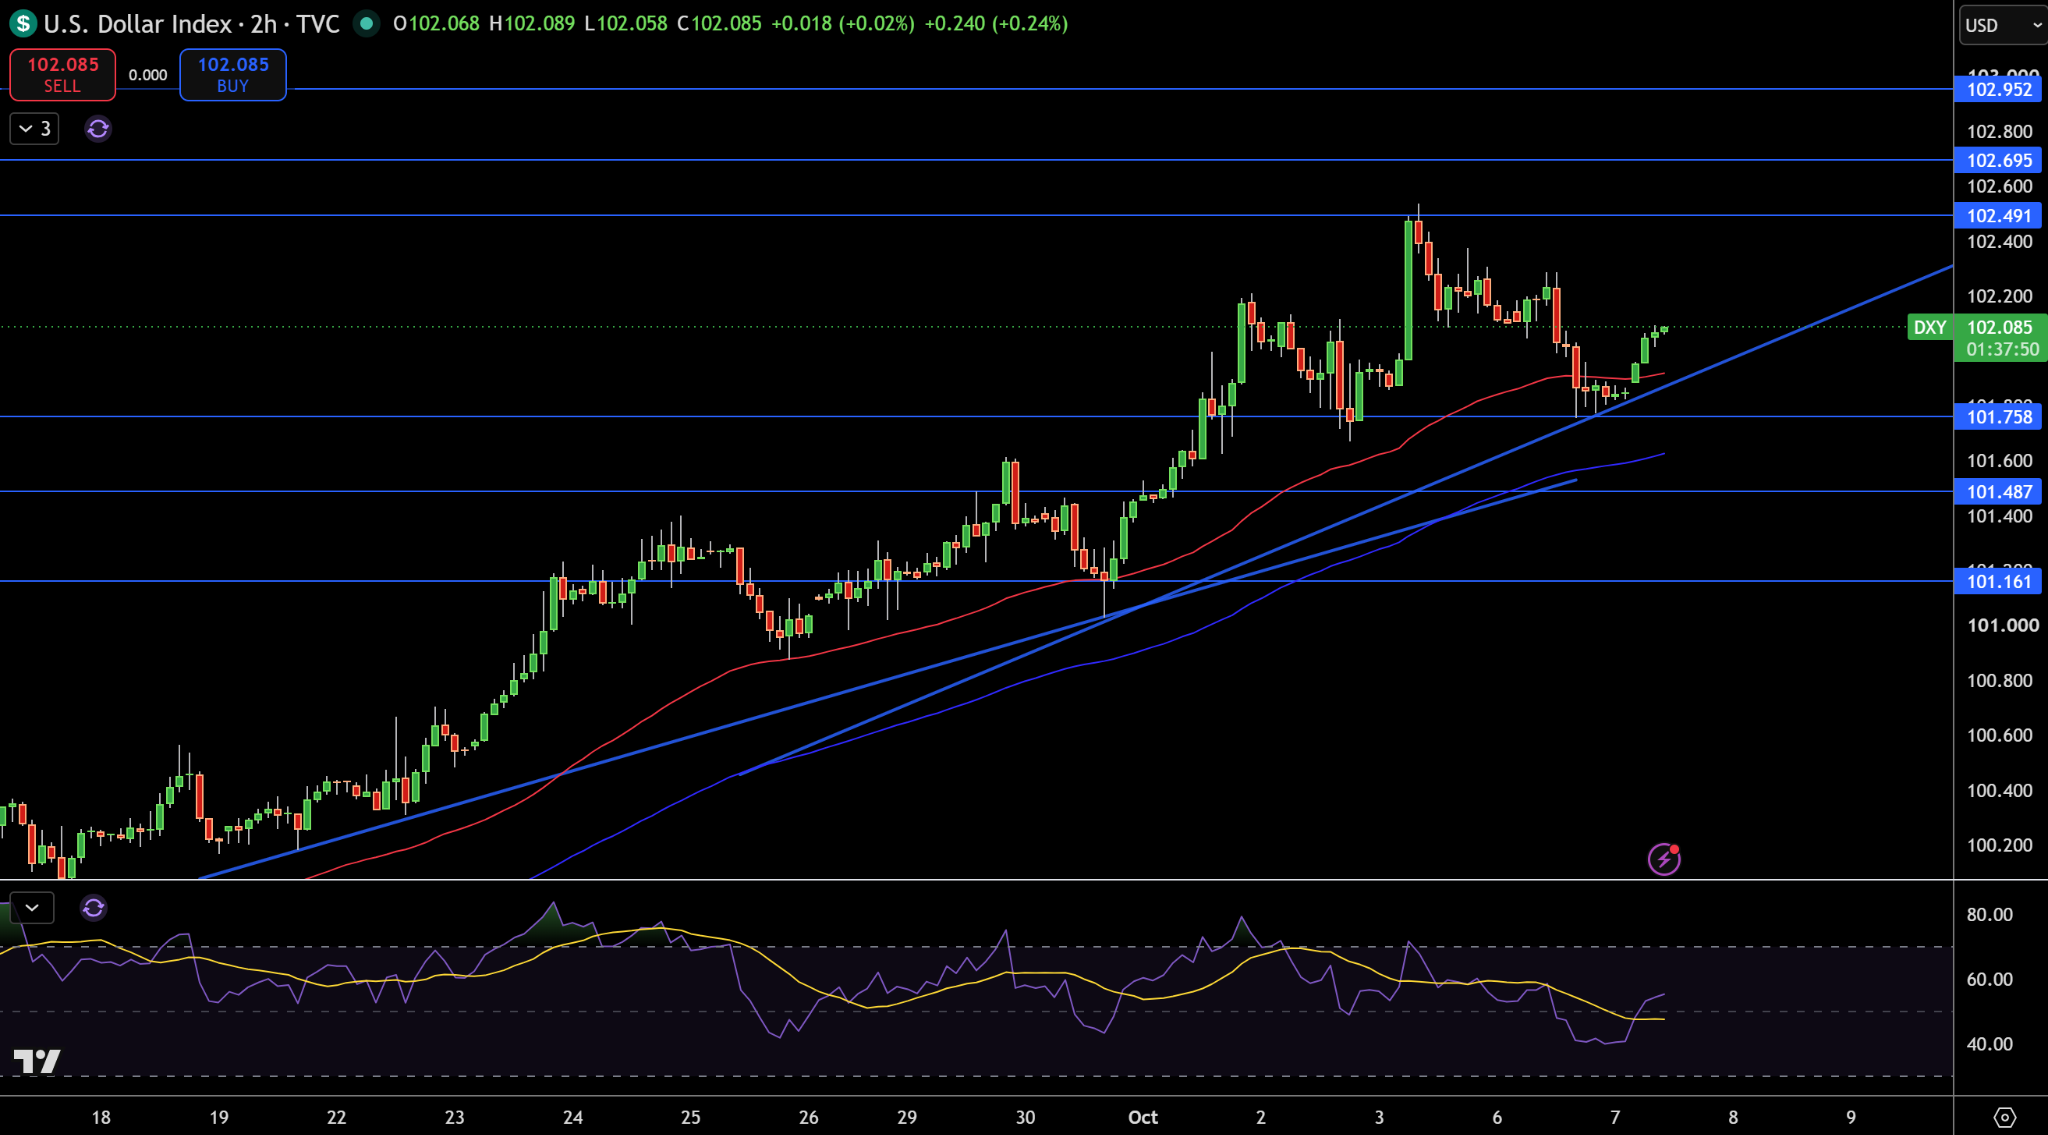
The U.S. Dollar Index is near 102.09 on the 2-hour chart, and what is important to me is how price has respect the rising trendline while being above both the moving averages. The latest bounce from 101.76 support area maintains the larger higher-low structure, but the bulls will need to break 102.49 to continue the trend.
102.49 is my immediate resistance, and above that 102.70 and 102.95 come into play. If we break down, 101.76 becomes the first major support, and below that 101.49 and 101.16 come into play.
RSI has risen up toward the midline from the recent pullback, and that tells me the overall trend is stabilizing rather than deteriorating. Overall I am bullish as long as DXY is above 101.76 and the rising trendline. A close below 101.49 would change my view and a break through 102.49 would open up 102.70 and 102.95.
GBP/USD Technical Analysis: Sterling Retreats From 1.3284 as 1.3222 Comes Back Into Focus
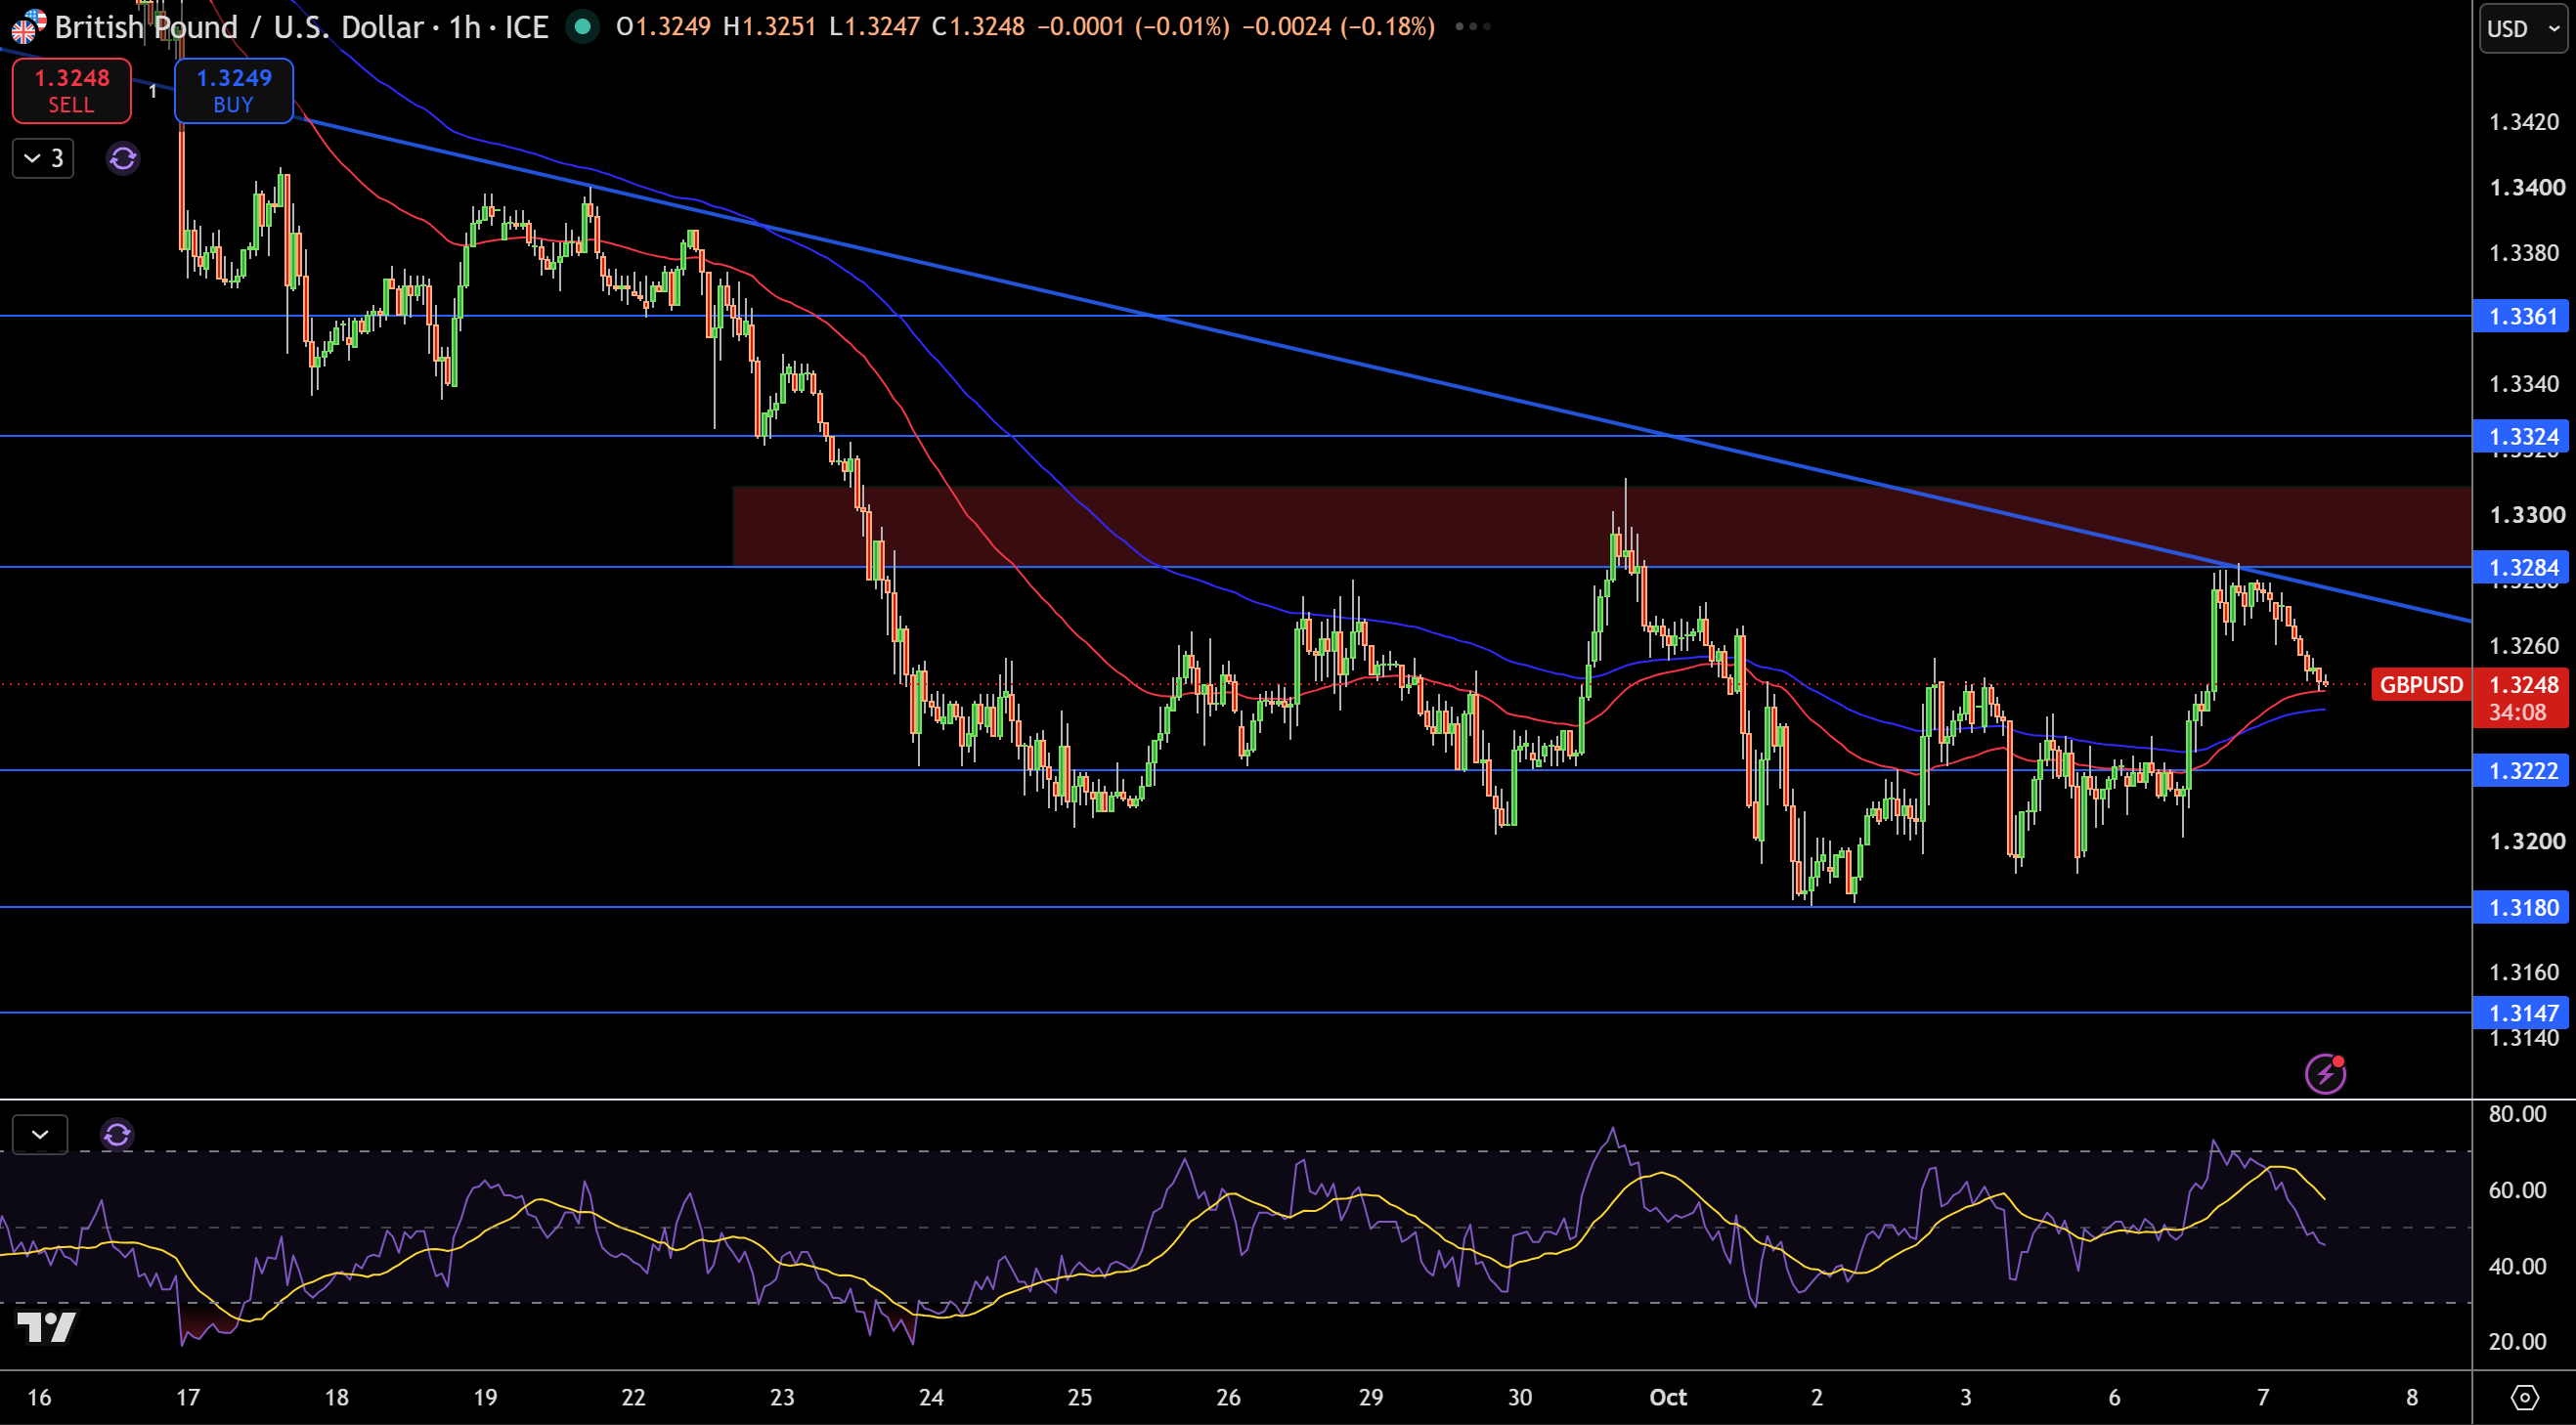
On the 1-hour chart, GBP/USD is at 1.3248, having failed to break above the 1.3284 resistance area and the descending trendline. Currently, GBP/USD is capped below the larger bearish structure, and is pulling back toward the shorter-term moving averages and support.
1.3222 is the first support I’m watching. A break below that would have support at 1.3180, and then 1.3147. The bigger areas of resistance are 1.3284, 1.3324, and 1.3361.
RSI has moved back closer to the 50 line, indicating bullish momentum was fading. I am looking to be bearish as long as GBP/USD is below 1.3284 and the descending trendline. A bullish break above 1.3324 would change the bias. A move below 1.3222 would allow for a more bearish bias and target 1.3180.
EUR/USD Technical Analysis: Euro Holds Near 1.1230 as 1.1131 Becomes the Next Major Downside Level
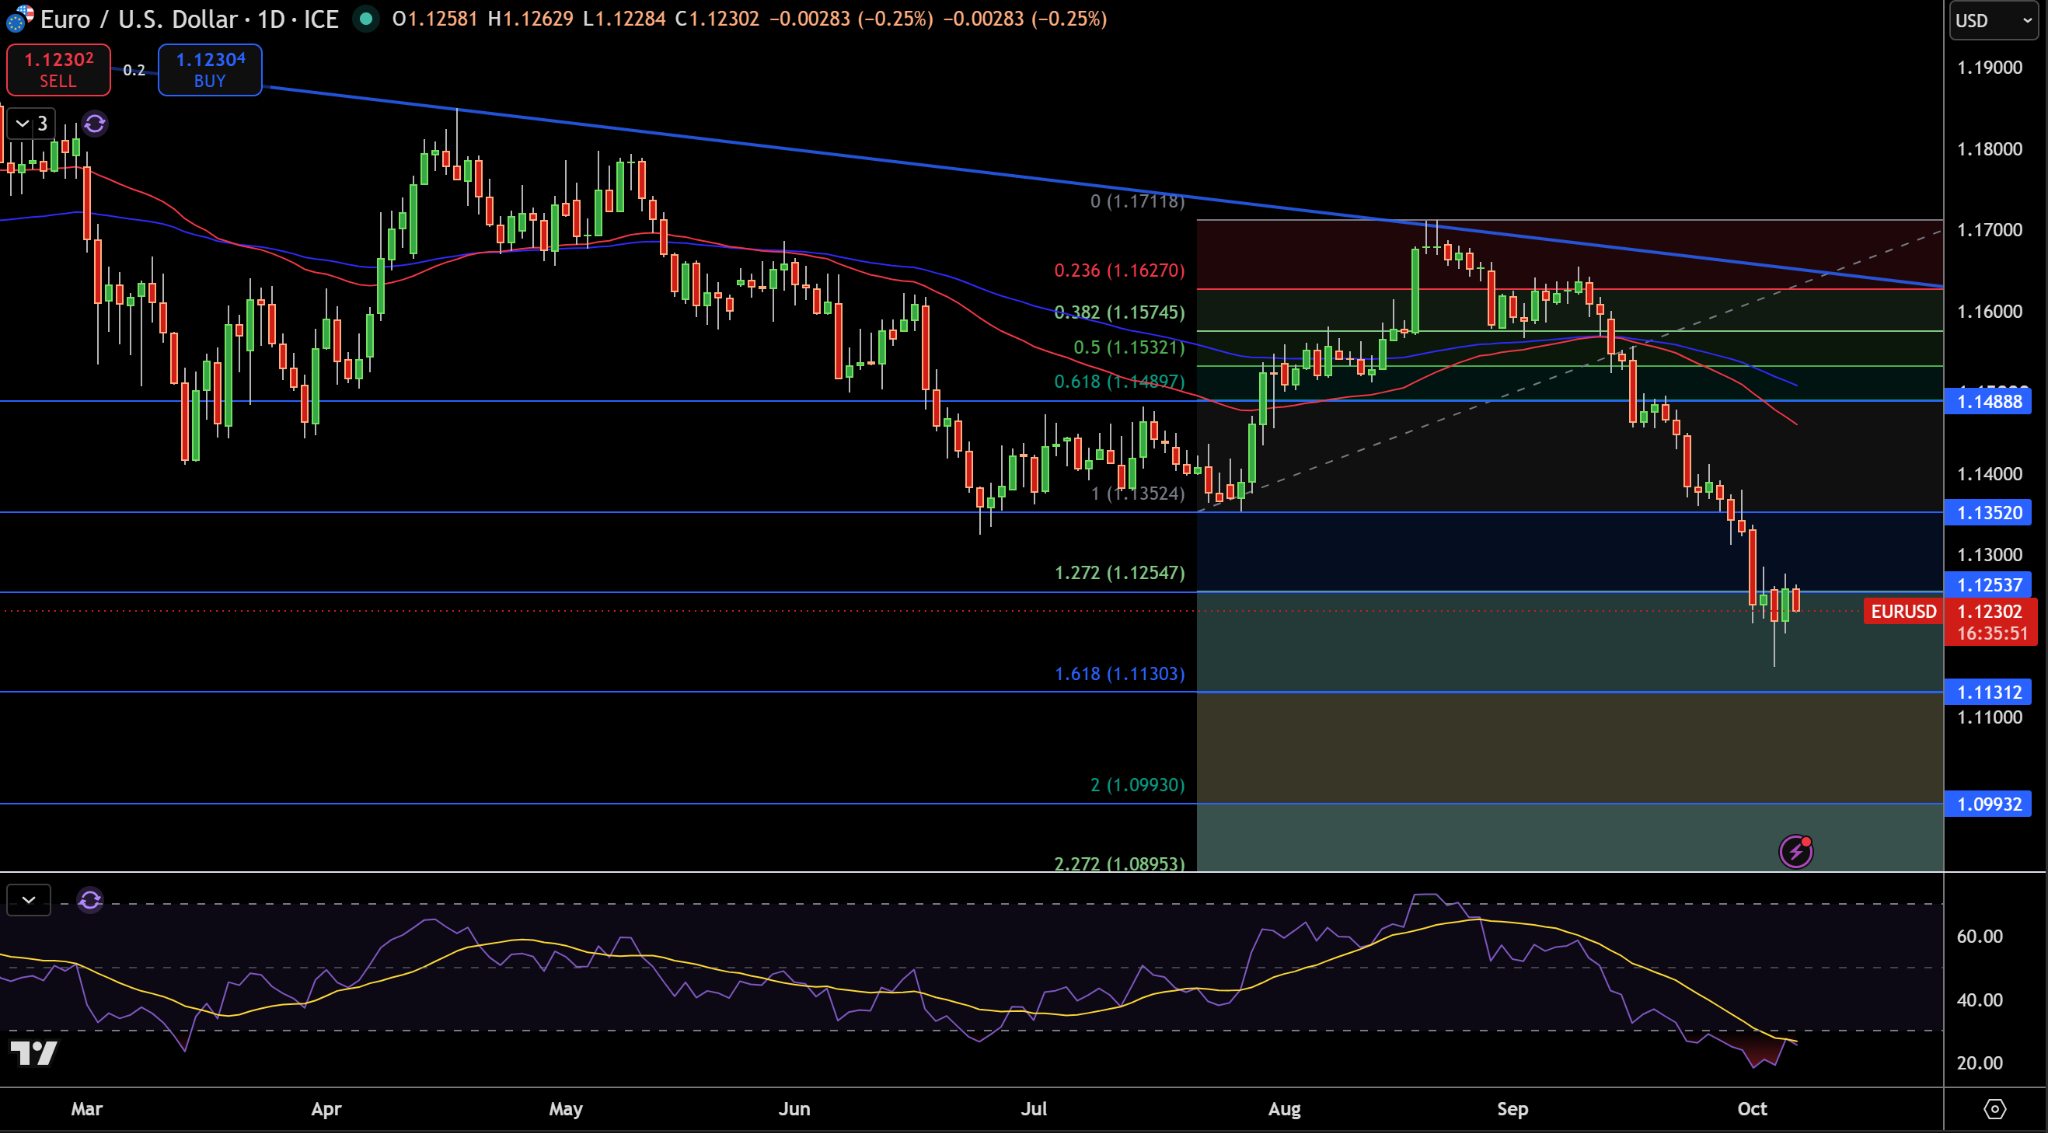
EUR/USD is near 1.1230 on the daily chart and has recently fallen from the 1.1352 area. I find it important that price is below both the moving averages and the rising trendline, and the latest leg lower has pushed the pair into the lower Fibonacci extension. From a larger time frame perspective, the structure is very bearish.
Support comes in at 1.1225. A downside break from that area would open up 1.1131 and then 1.0993. 1.1352 remains the first major barrier on the upside, with 1.1489 extending higher and coming into focus if we see a more decisive recovery.
RSI is extremely oversold and confirms the strength of the lower moves, however it also increases the probability of a minor bounce back higher. I am looking for opportunities to sell more aggressively should we remain below 1.1352 and within the existing descending trend. If 1.1489 comes into play, I will look to reverse my perspective. A break below 1.1225 would put 1.1131 in focus.