



Gold (XAU) and Bitcoin (BTC) prices show weakness ahead of the FOMC minutes on Wednesday. Gold has pulled back after the rebound on Tuesday, while Bitcoin slipped below $84,000 despite renewed ETF inflows. The rise in oil prices adds to inflation concerns and could strengthen the case for further rate hikes by the Fed. But the ratio charts show that Bitcoin has regained strength against gold. In my view, Bitcoin must attract strong buying to extend the recovery. This article examines the latest market developments, the ratios between gold and Bitcoin and key technical levels that may shape the next move in Bitcoin.

Gold vs. Bitcoin Outlook: FOMC Minutes and ETF Flows in Focus
Gold price increased to $4,184 on Tuesday as the dollar and Treasury yields eased. The concerns about the French bond market also encouraged the demand for gold as a safe haven. However, the pullback on Wednesday shows that buyers remain cautious.
The market still expects a high chance of a rate hike by the Fed by December. That leaves gold exposed to further tightening, even as the expectations for the increase in October have dropped. The high rates increase the appeal of assets that pay interest and can limit the demand for gold.
Bitcoin also faces uneven investment demand. U.S.-listed Bitcoin ETFs recorded $89.8 million in net outflows on October 5. However, Bitcoin recorded $118.8 million in net inflows on October 6. Bitcoin dropped below $84,000 during the Asian session on Wednesday, but the price action still suggests a positive trend. These developments suggest that demand remains too uneven to support a steady advance. The renewed inflows in ETFs would strengthen the case for Bitcoin to extend the recovery against gold.
The FOMC minutes could influence the next move in both markets. A strong preference for further rate increases would likely weigh on prices. But a more patient tone could support a recovery. The oil market adds another complication to both assets.
Oil prices rose on Wednesday as a storm approaching the Gulf of Mexico and attacks in the Middle East raised supply concerns. If the higher cost of energy keeps inflation elevated, the Fed may have less room to pause. In my view, the gold could still attract defensive buying during market stress, while the recovery in Bitcoin would benefit from a stronger appetite for risk.
Gold Price Forecast
Every new Gold analysis as it publishes, today's technical signal and key levels, live price — on one page.
See all Gold forecastsBitcoin-to-Gold Ratio: Recovery Faces Resistance at 35
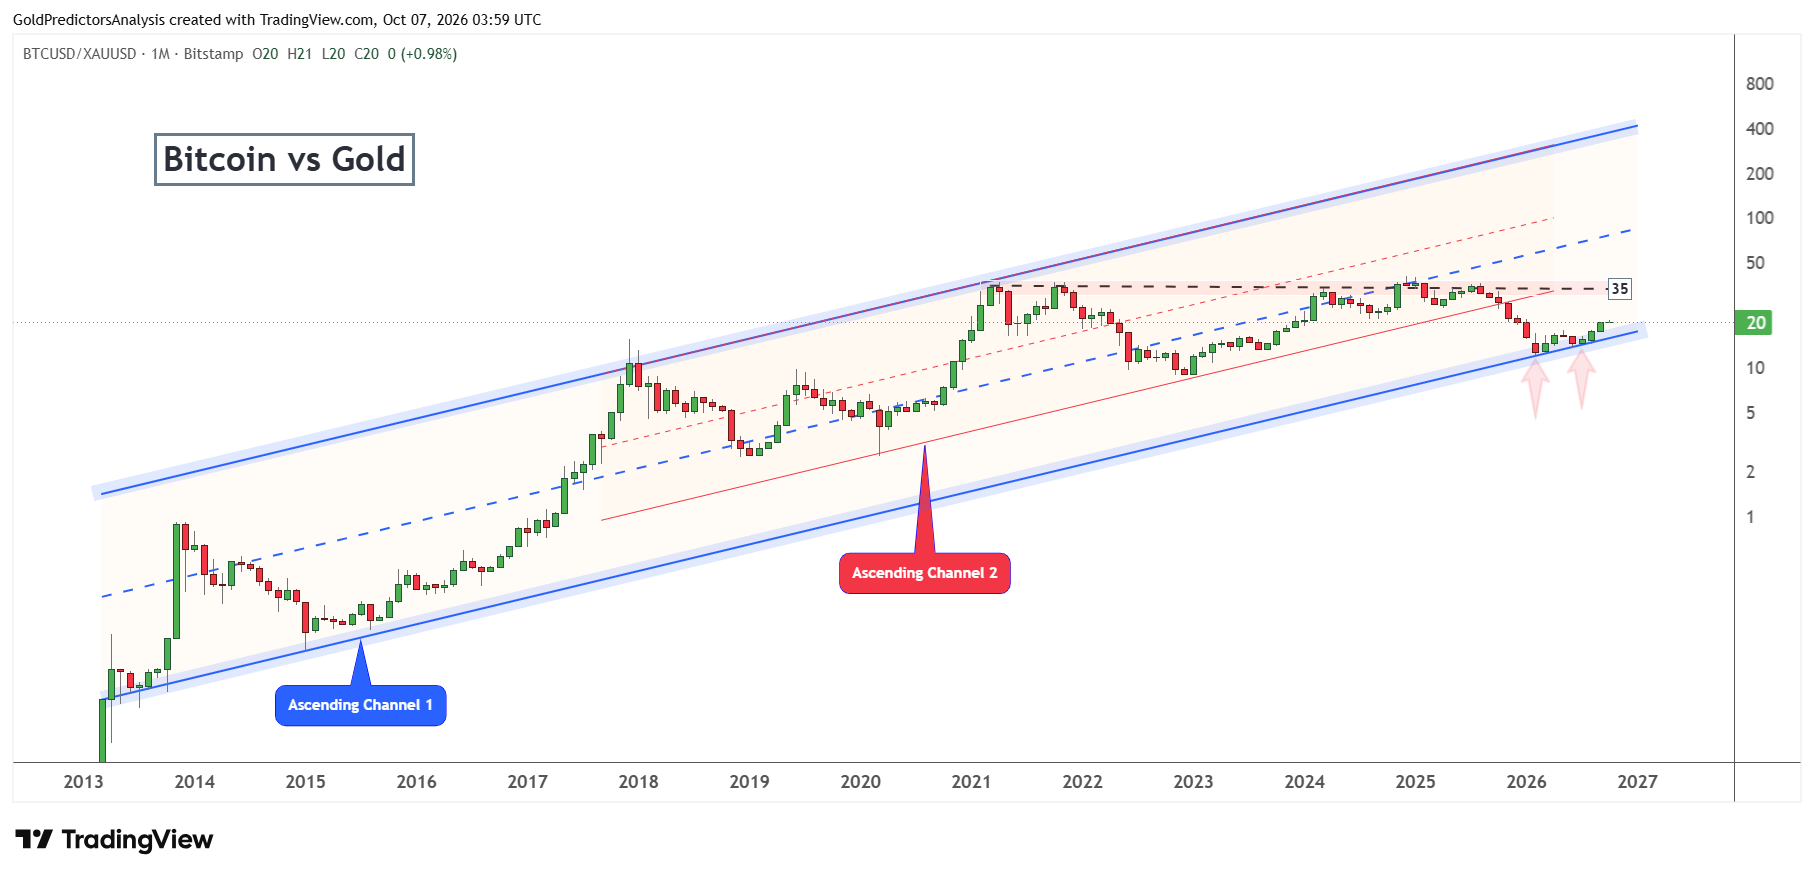
The ratio of Bitcoin to gold shows a rebound from the lower boundary of the broad ascending channel as seen in the chart below. This rebound shows that Bitcoin has regained ground against gold from the earlier lows.
However, the ratio must break above the resistance of 35 to strengthen the case for further outperformance in Bitcoin. A break below the lower boundary of the channel would weaken that outlook and favour gold.
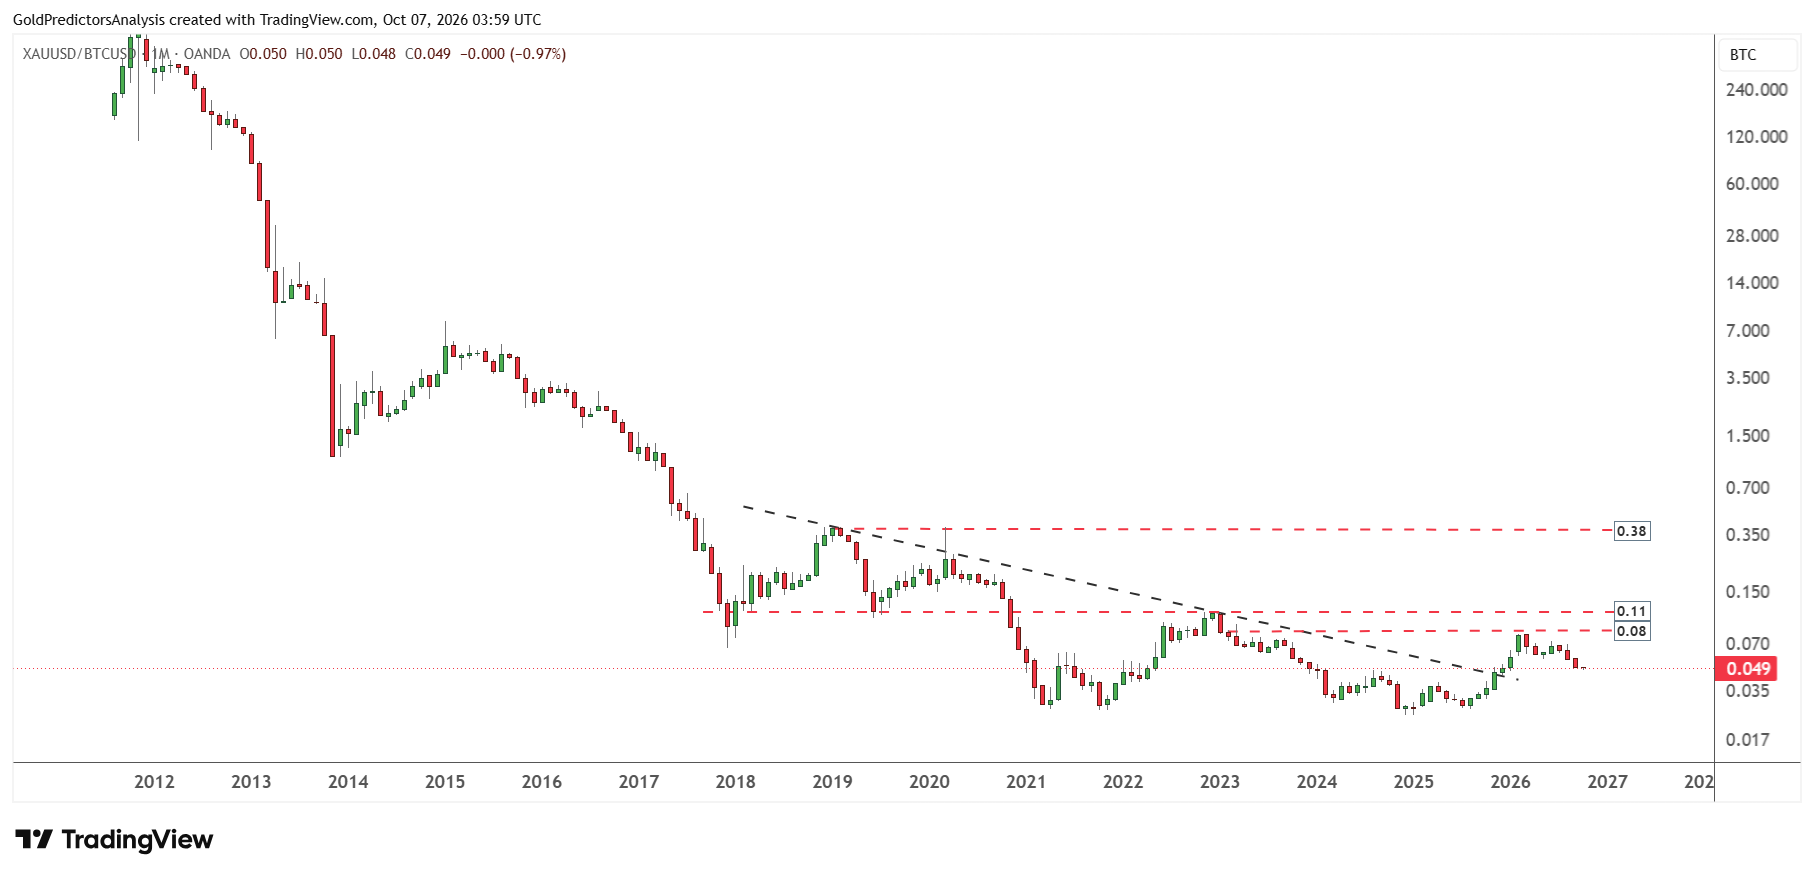
The ratio of gold to Bitcoin shows the reverse relationship. The ratio has dropped toward 0.049 after the rebound stalled near 0.08 as seen in the chart below. This decline matches the relative recovery in Bitcoin in 2026. The ratio needs to reclaim 0.08 before the next marked resistance at 0.11 comes into focus.
Bitcoin Price Forecast: $87,000 Breakout Could Open the Way to $100,000
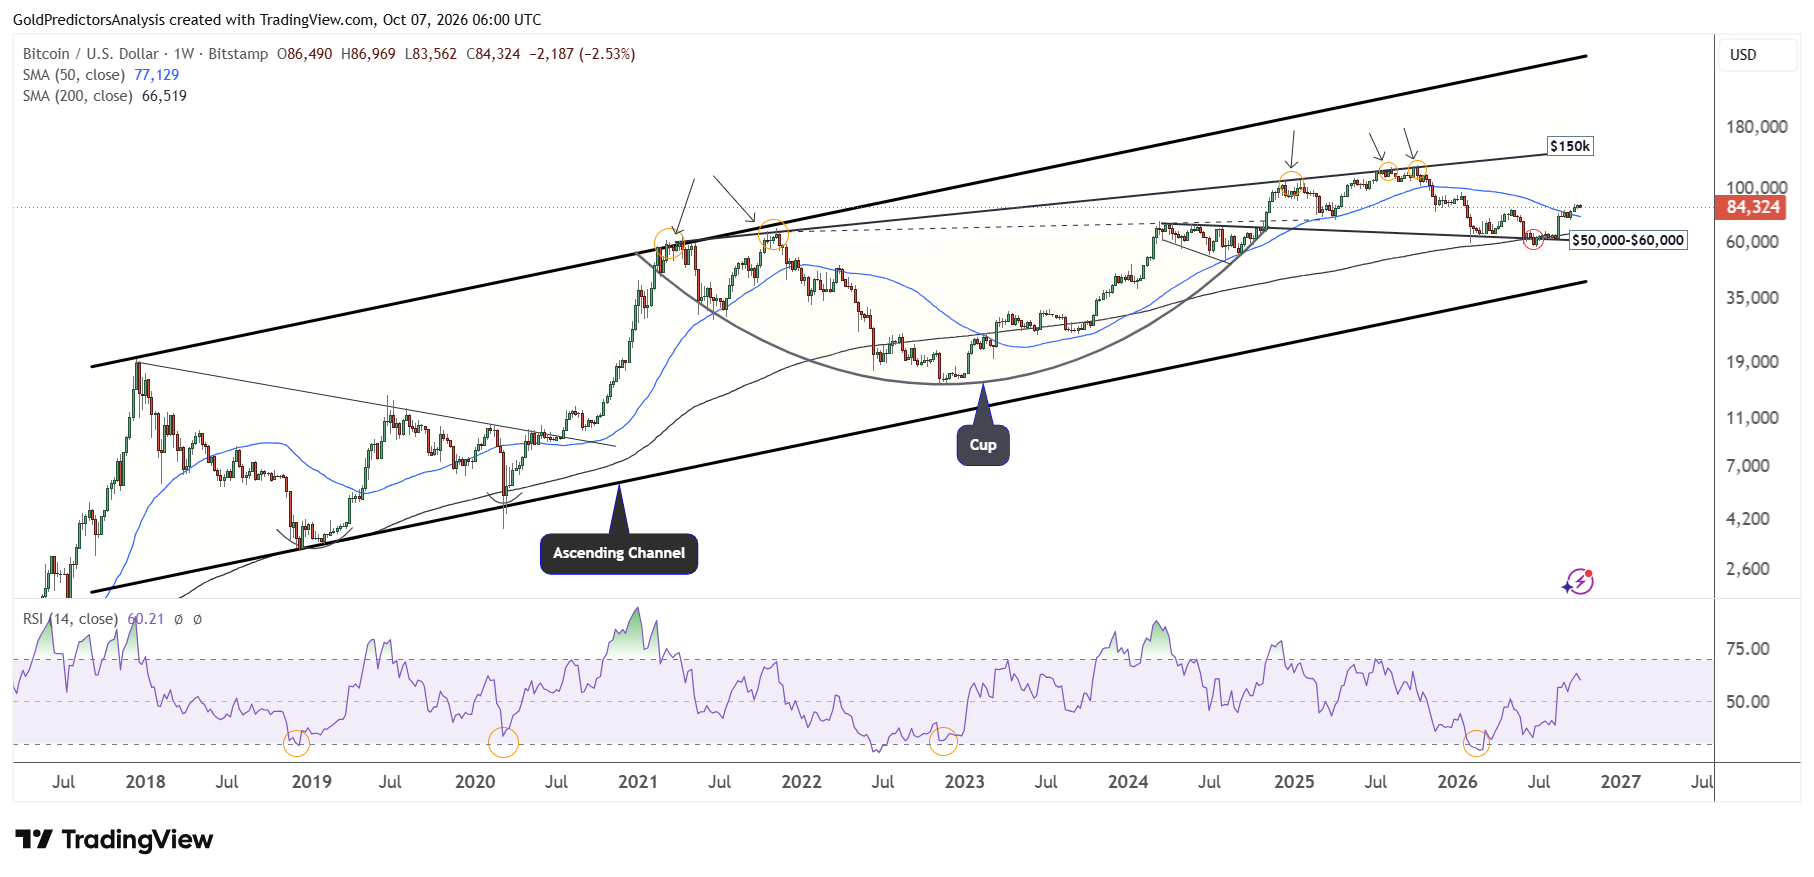
The weekly chart for Bitcoin shows that the price continues to show strength after forming a bottom at the long-term support zone of $50,000 to $60,000. As long as the Bitcoin price holds the $50,000 area, the possibility of another rally towards $100,000 is high.
A break above $100,000 will likely open the way for a strong surge to break the record high and push prices towards the $150,000 area.
The emergence of a cup pattern within the ascending channel pattern supports a strong bullish outlook. Therefore, the price must hold the $80,000 support in the short term for further upside.
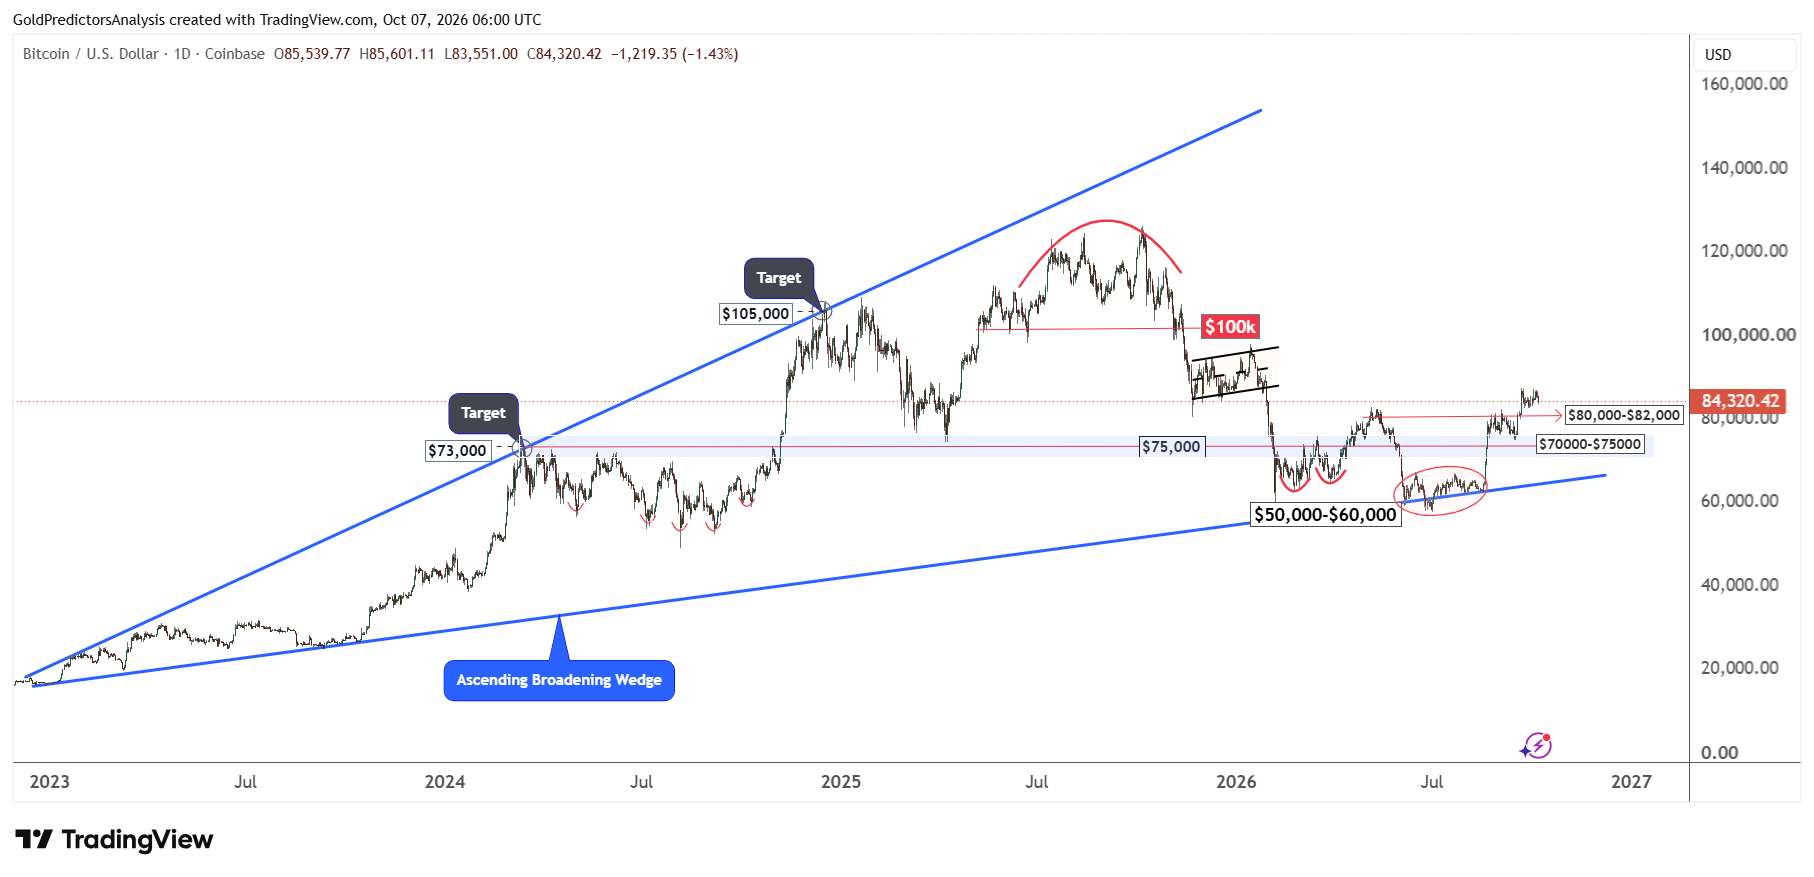
The constructive price action in Bitcoin is also evident on the daily chart, which shows that the price has been consolidating within the ascending broadening wedge.
The immediate support for Bitcoin remains in the $80,000 to $82,000 area. A break below $80,000 will likely push prices towards the $70,000-$75,000 range. But a break below $70,000 will likely open the way for a further drop towards the $65,000 area, which is considered strong support.
However, a rally above $87,000 will open the way for a strong rally towards the $100,000 area. As long as the $80,000 support holds, the Bitcoin price may remain strong in the short term.
Key Levels and Risks to Watch
Bitcoin keeps a positive technical outlook above $80,000. A break above $87,000 could open the way towards $100,000, while stronger ETF demand would help sustain the recovery against gold. The FOMC minutes remain a key test for both markets. Persistent inflation could keep the interest rates high and limit the recovery in both assets.
Gold may still attract buying as a safe haven if market stress increases. The ratio of Bitcoin to gold needs to clear 35 to strengthen the case for further outperformance in Bitcoin. A break below $80,000 would weaken the outlook for Bitcoin and increase the risk of deeper correction.
Read more: BTC Gains Against XAUUSD as ETF Demand Remains Firm


