


Gold (XAU) and silver (XAG) prices edge lower in early Asian trading on Wednesday. Gold trades near $4,150 an ounce while silver consolidates around $60.90. The correction in the US dollar on Tuesday supported the recovery in metals but traders remain cautious ahead of the September meeting minutes later today.
The market now expects 20.5% chance of a rate hike in October. But the probability of a December increase remains much higher. The drop in expectations for a rate hike in October supports the metal, but further rate hikes could still limit demand for both metals.
Oil prices also rebounded on Wednesday, with Brent oil rising over $104 a barrel. A developing storm threatens oil facilities in the US Gulf, while renewed attacks in the Middle East keep traders concerned about supply. The high energy prices could add to inflation and strengthen the case for further tightening.
Traders will watch the Fed minutes for clues about how officials weigh these risks. In my view, gold and silver remain vulnerable if the rise in oil prices revives the expectations for higher interest rates.

Gold Price Forecast: $4,100 Support at Risk
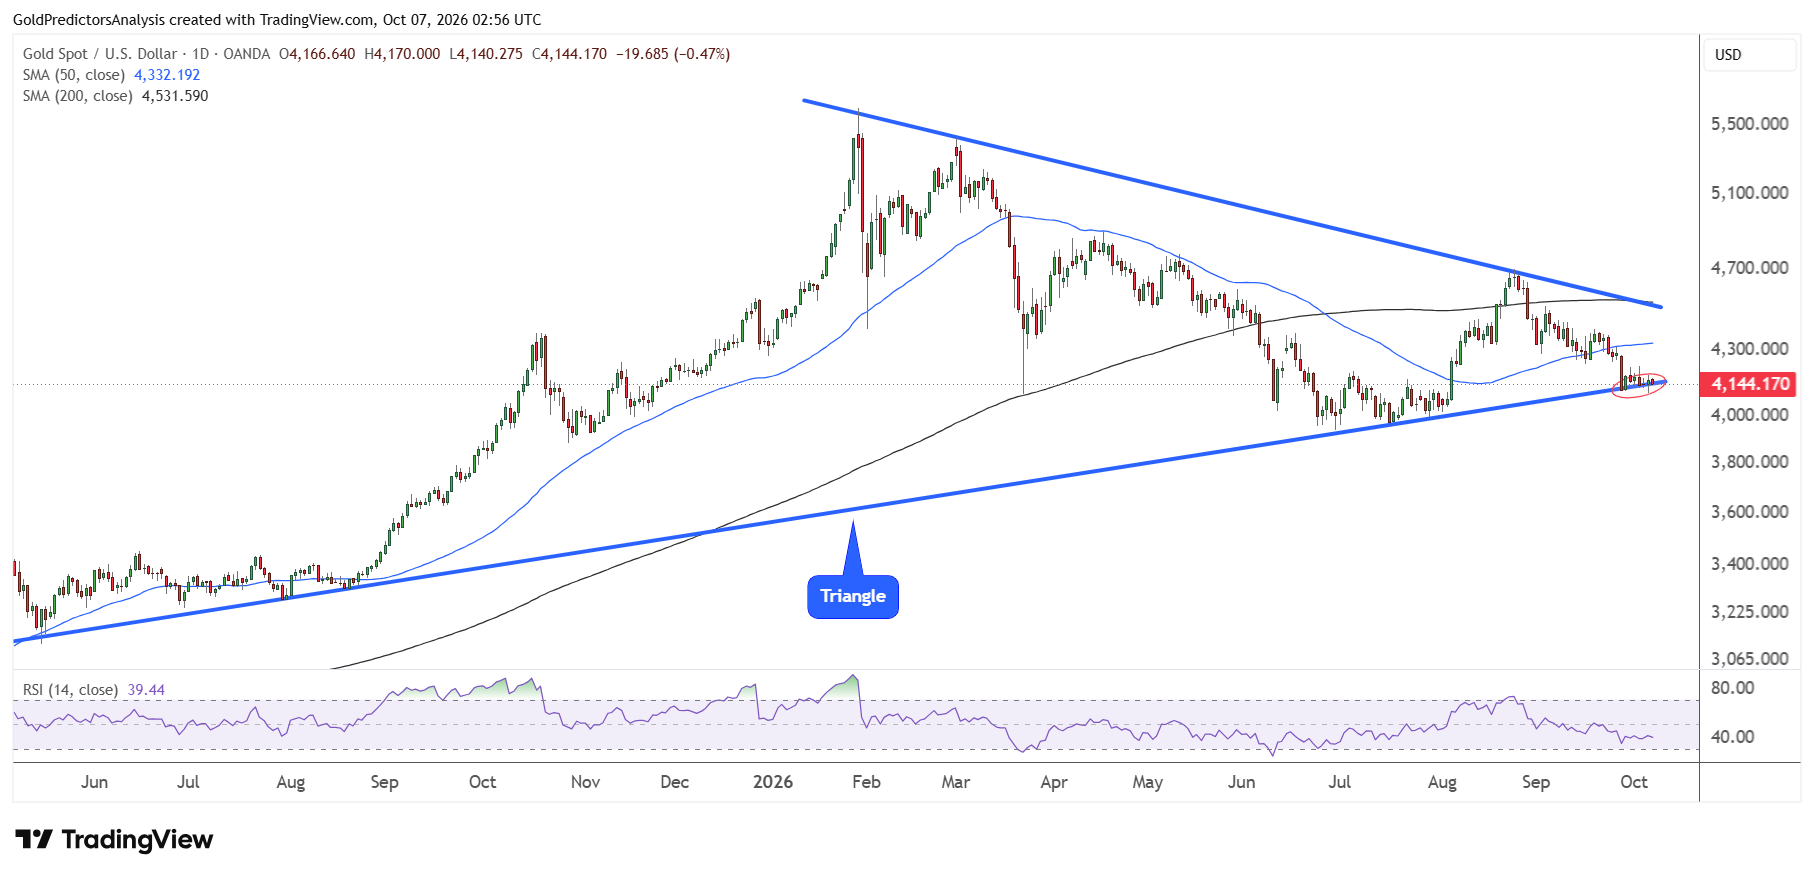
The daily chart for spot gold shows that the price has been consolidating at the edge of the triangle and remains under bearish pressure. A break below $4,100 will likely open the way for a quick drop towards the $4,000 area.
But a recovery above $4,300 is required to initiate a rebound towards the 200-day SMA at $4,500. The resistance of the triangle now intersects with the 200-day SMA at $4,530. A break above this level will likely open the way for a strong rally towards the $5,000 region. The RSI remains below the midline and continues to drop, which suggests bearish pressure in the short term.
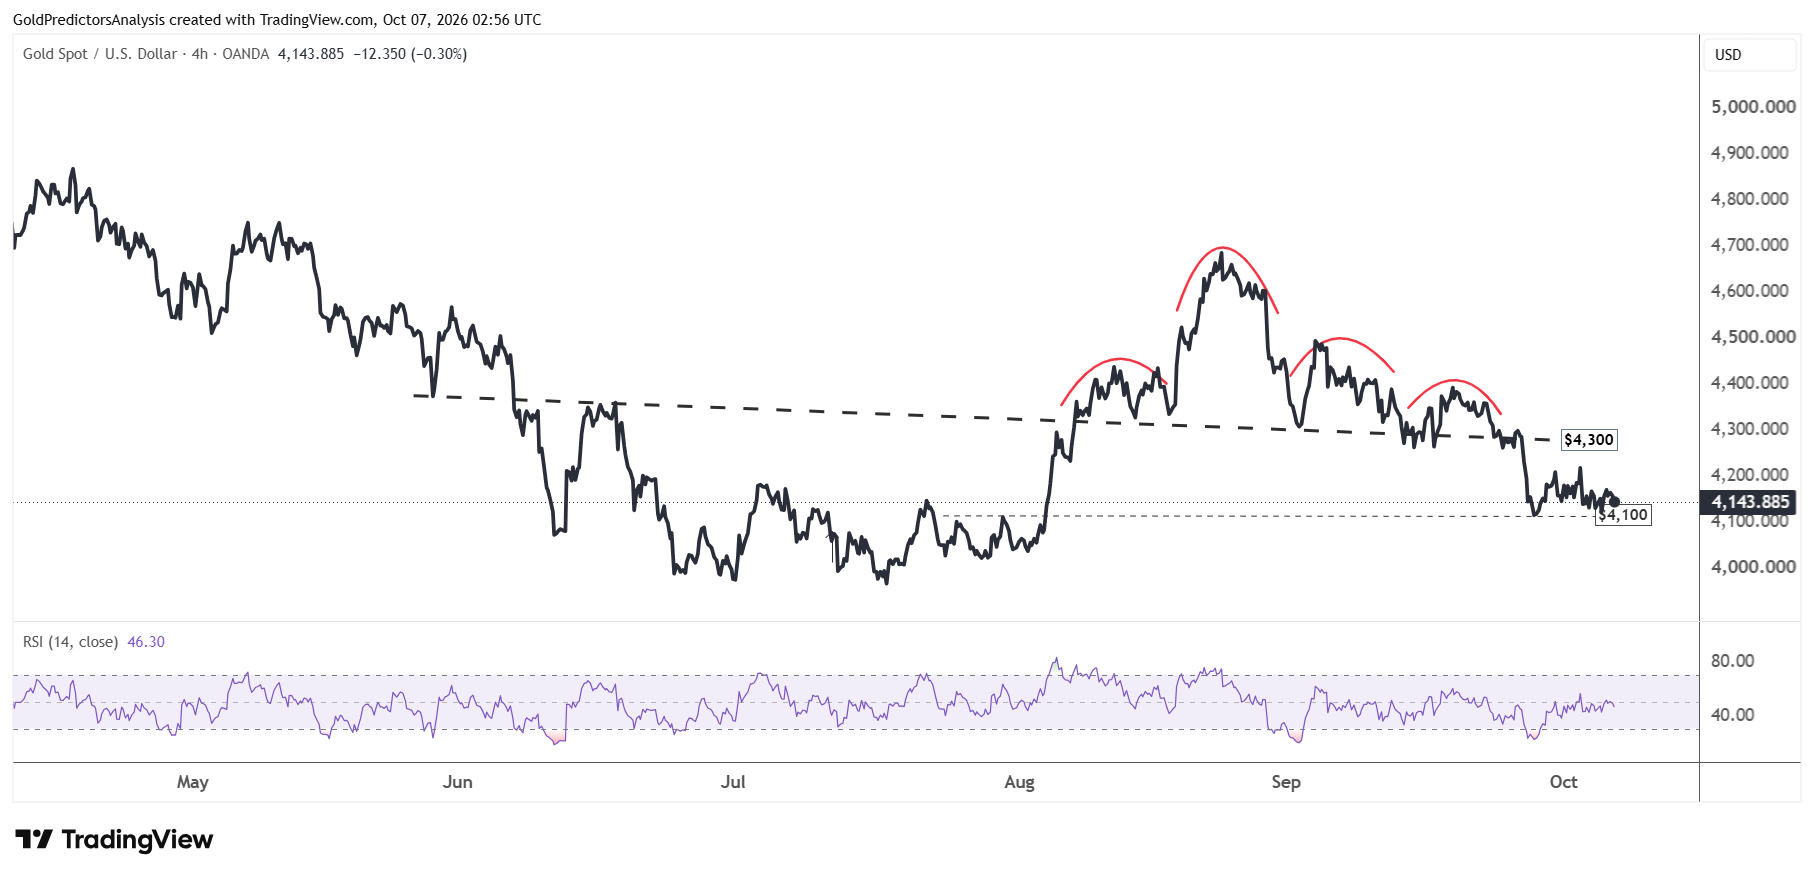
The 4-hour chart for spot gold shows negative price action below $4,300. The price is now consolidating around $4,100. A break below this level will likely trigger a strong drop towards the $4,000 area. The RSI on the 4-hour chart also remains below the midline, which suggests negative price action in the short term.
Gold Price Forecast
Every new Gold analysis as it publishes, today's technical signal and key levels, live price — on one page.
See all Gold forecastsSilver Price Forecast: Break Below $60 Could Expose $55
The daily chart for spot silver also shows a negative price structure below the $72 area. The price failed multiple times in August to break above $68. The RSI remains below the midline, which increases the likelihood of further downside.
A recovery above $64 is required to initiate a rally towards the $72 area. However, the strong US dollar and positive momentum in Treasury yields suggest negative price action in the short term.
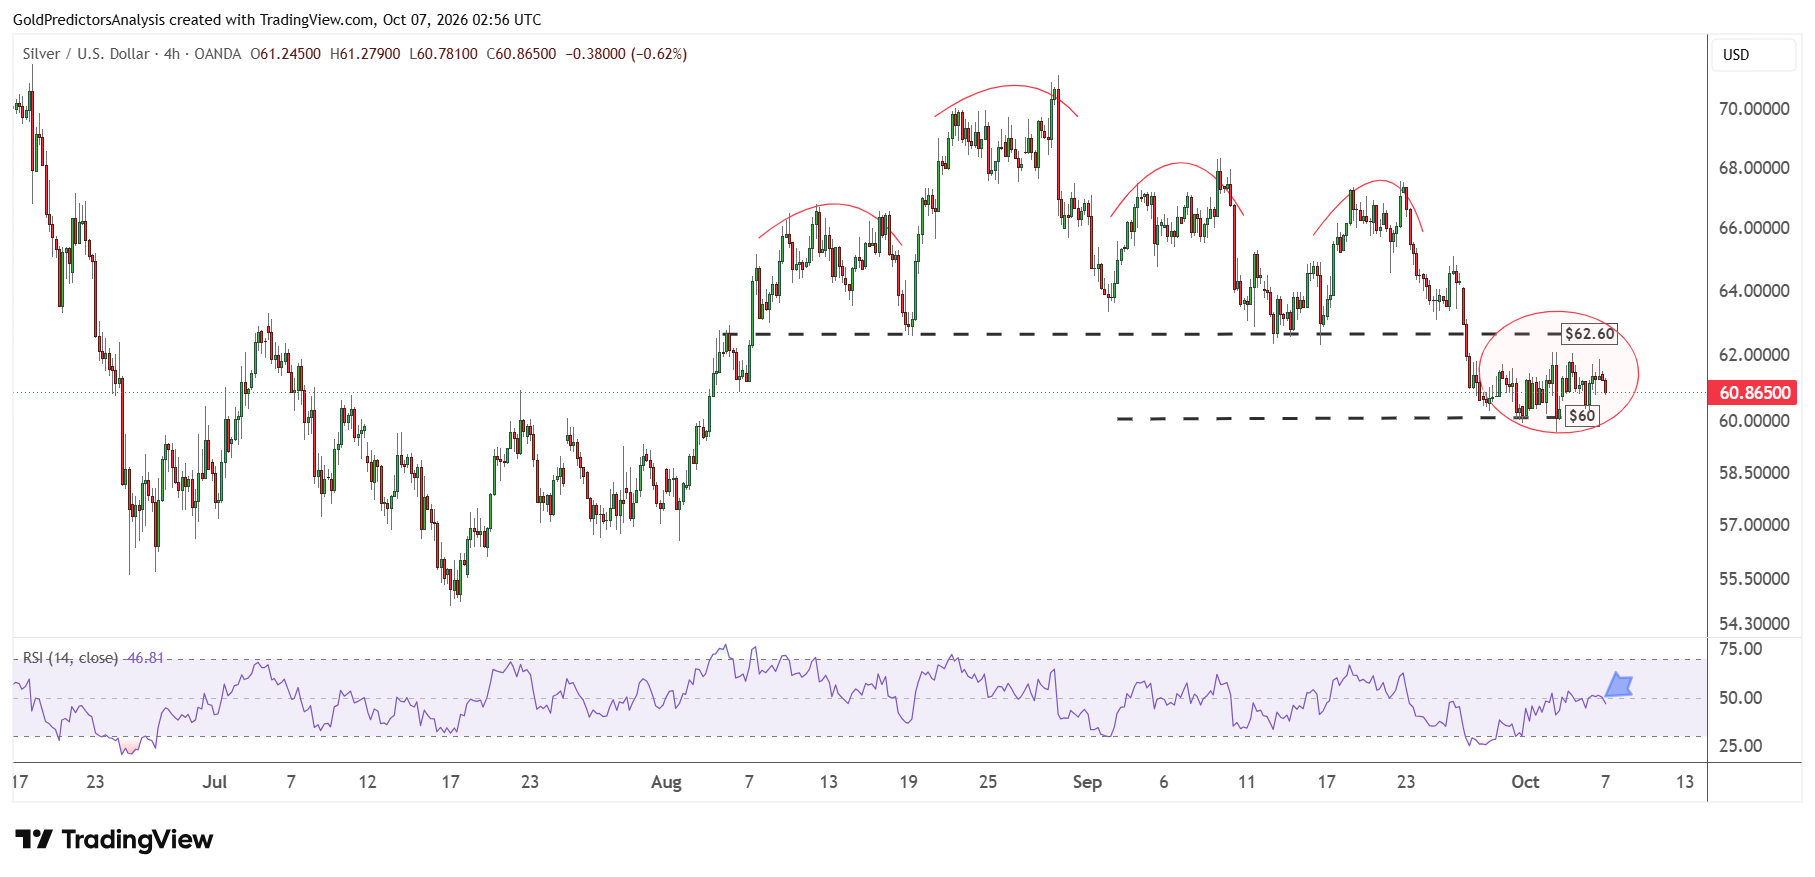
A break below $60 will likely push spot silver prices towards the $55 area, but a recovery above $64 is required to push the prices back to $72.
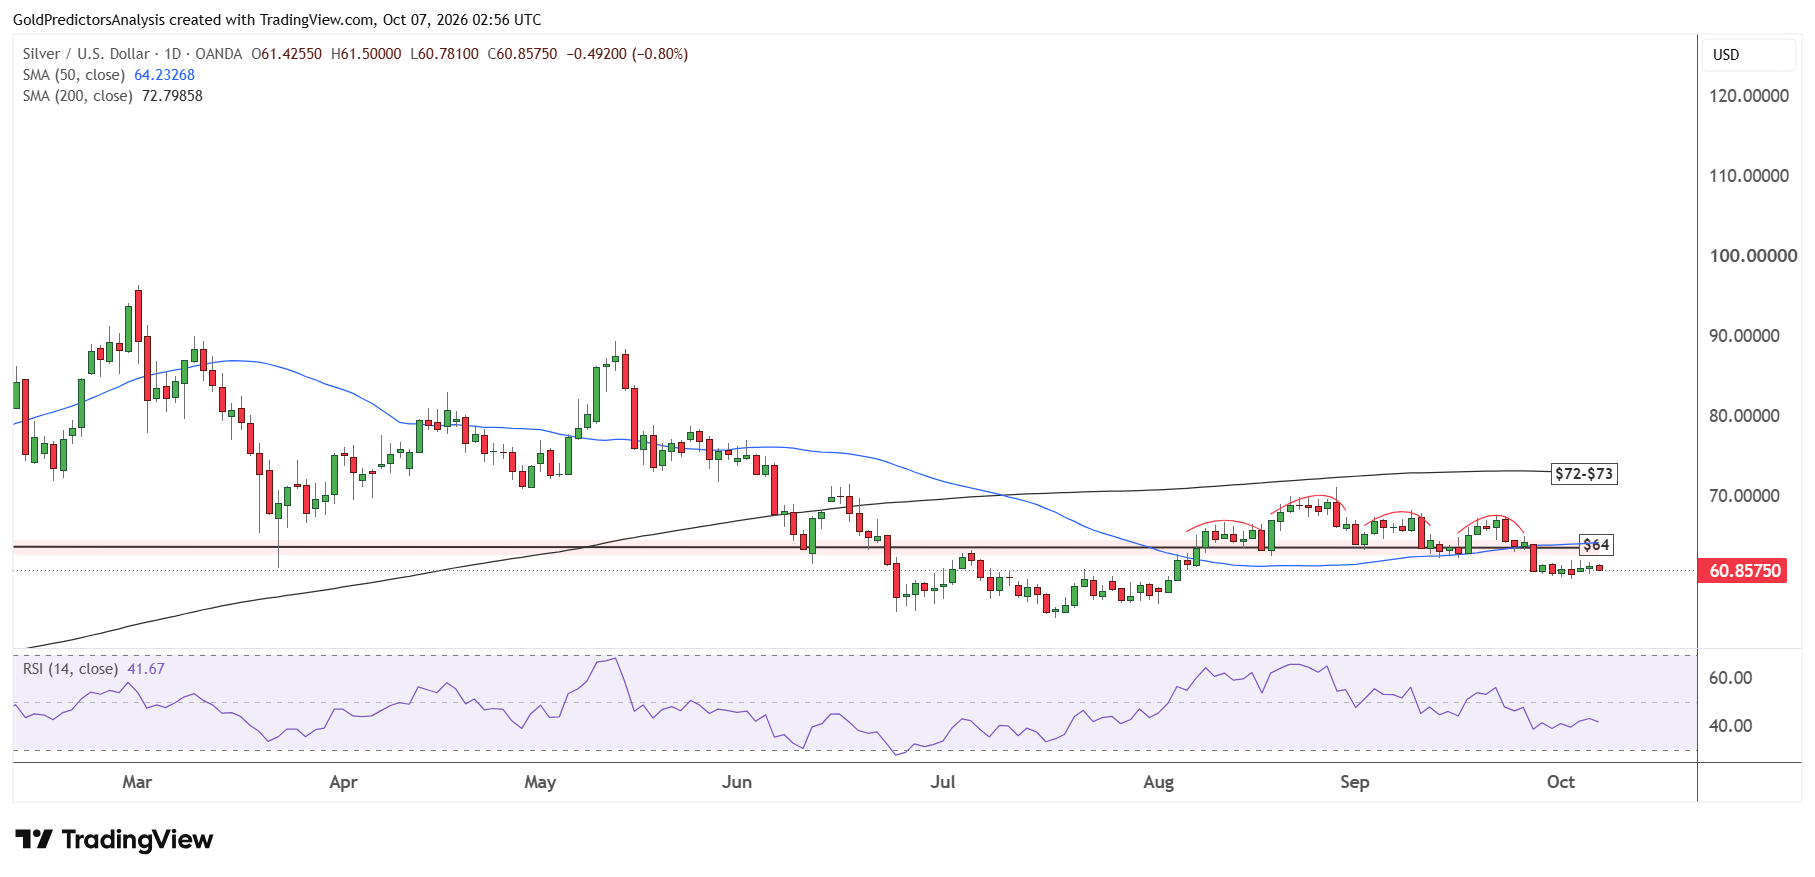
The 4-hour chart for spot silver shows consolidation between $60 and $62.60 in the short term. However, the development of bearish price action below $72 increases the possibility of a breakdown below $60. A break below $60 will open the way for a further drop towards the $55 area.
What to Watch Next for Gold and Silver
Traders will watch the Fed minutes for clues about further rate hikes. A strong US dollar could pressure the metals while the increase in oil prices may keep inflation concerns alive. The key support level for gold remains at $4,100. A break below this level could bring $4,000 into view, but a recovery above $4,300 would improve the outlook.
Silver faces a similar test at $60. A break below this level may open the way toward $55. Buyers need to push silver above $64 to support a rebound towards $72. Until both metals regain these resistance levels, the risk of another drop is high.
Read more: Gold and Silver Rebound Faces Risk of a Deeper Drop


