



Bitcoin (BTC) is regaining ground against gold (XAU) as the ratio of Bitcoin to gold reaches 20. This recovery follows the sharp decline earlier this year and points to improvement in the strength of Bitcoin. Fresh ETF inflows offer support, while high Treasury yields continue to challenge both assets. Softer comments from the Federal Reserve have eased some concerns about another immediate rate hike. In my view, Bitcoin needs sustained demand to extend the recovery against gold.

Bitcoin and Gold Outlook: ETF Inflows Support BTC as Fed Hike Bets Ease
US Bitcoin ETFs attracted $66.2 million in net inflows on September 29. BlackRock’s IBIT received $51.1 million while ARK’s ARKB added $33.2 million. These inflows support demand. Bitcoin also gained new investment route in Europe. HANetf’s Arrow Bitcoin EUR Hedged ETC is listed in Paris on Tuesday. The product reduces the impact of euro-dollar movements for European investors which may help broaden demand over time.
The main policy development came from New York Fed President John Williams on Tuesday. He said that the Fed has time to assess additional data after the rate increase in September. He still sees room for one further hike late this year. His comments pushed the expectations for the October hike lower and pushed the 2-year Treasury yield toward 4.88%.
Gold also struggled to turn the rebound into a stronger recovery. The gold price rebounded to $4,187 on Tuesday following the sharp decline on Monday. A strong dollar and high Treasury yields continued to limit demand for gold. The market will now watch the US PCE inflation data on Wednesday and the jobs data on Friday.
A softer inflation data could ease pressure on yields and support both gold and Bitcoin. But the strong reading could renew expectations of further tightening by the Fed. The key question for Bitcoin is whether demand for ETFs can absorb selling if costs for borrowing remain elevated.
Bitcoin Price Forecast
Every new Bitcoin analysis as it publishes, today's technical signal and key levels, live price — on one page.
See all Bitcoin forecastsGold vs Bitcoin: Ratio Recovery Faces Key Resistance at 23
These competing forces make the ratio between Bitcoin and gold useful to judge the relative performance of these assets. The ratio has rebounded from the 13 support region. This rebound shows that Bitcoin has regained purchasing power against gold.
The monthly chart below shows an important limit to this recovery. The ratio previously traded within the marked ascending triangle. But it broke below the rising support line in late 2025. The ratio found support in early 2026 and rebounded toward 20. That bounce improves the position for Bitcoin but the ratio remains below the broken trend line.
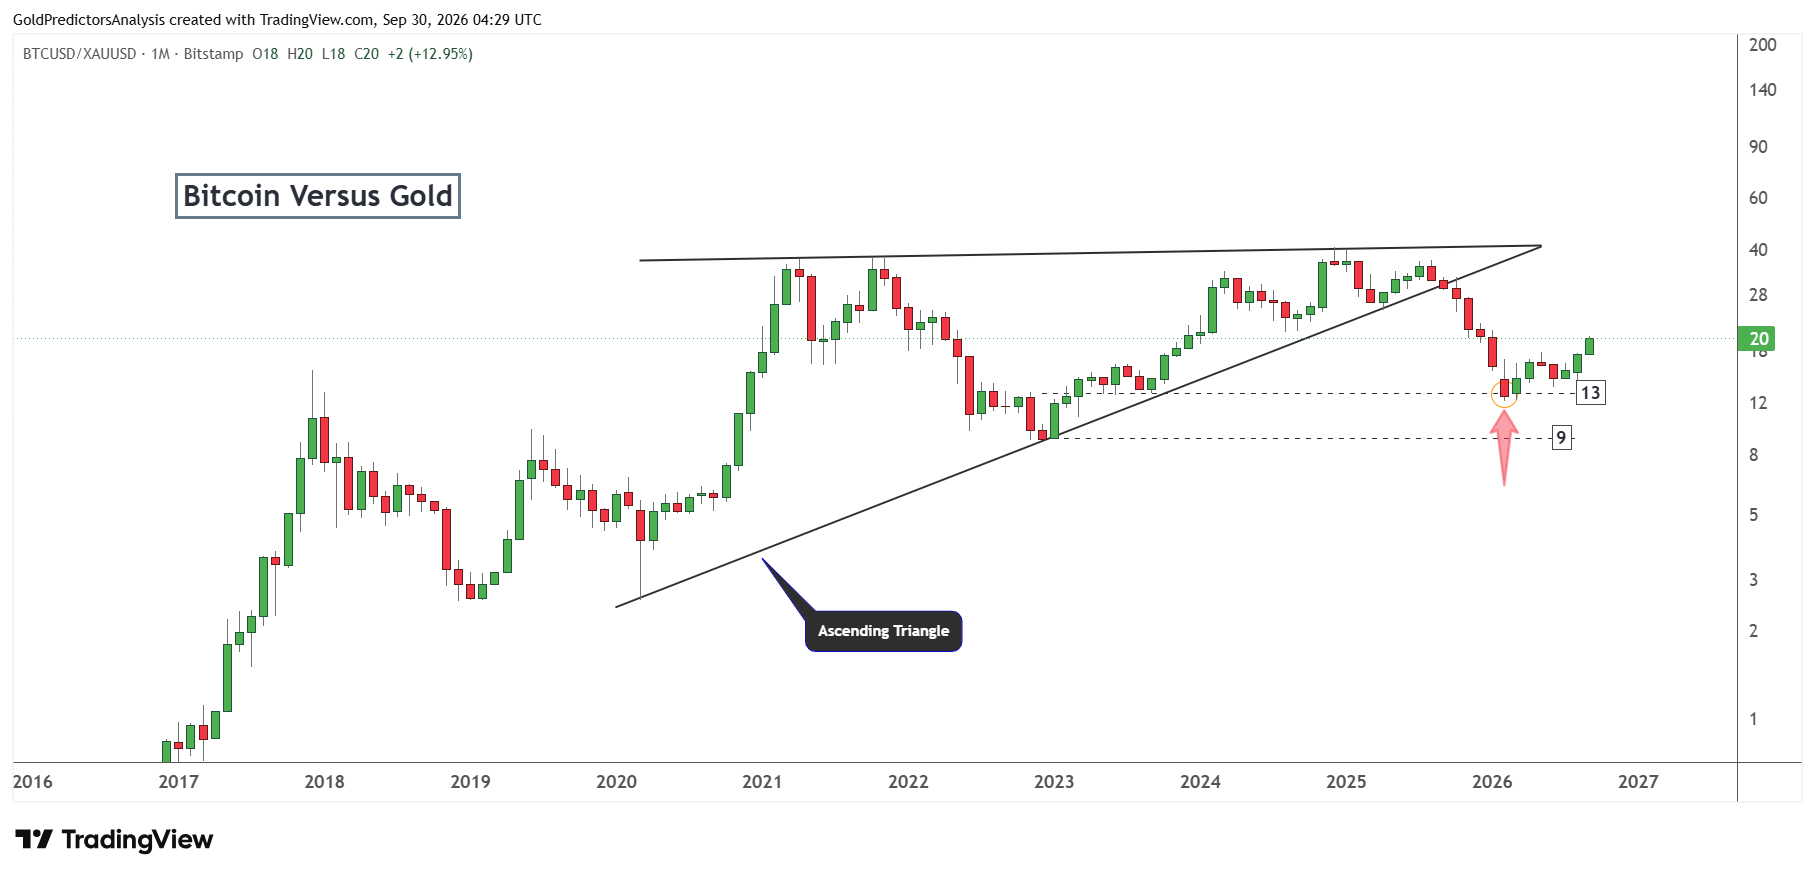
The ratio needs to recover above the 40 level to confirm a rally in the Bitcoin market in the long term.
The weekly chart for the ratio gives a more positive signal. The ratio has formed rounded lows and recovered from the support region near 13. The recent price action also shows higher lows, which suggests that the relative weakness in Bitcoin is easing.
The weekly RSI has climbed above the midline to about 63.5. This supports the recovery in momentum for the ratio. The similar basing formations preceded the rally in 2023 but the current setup still needs a break above the 23 region.
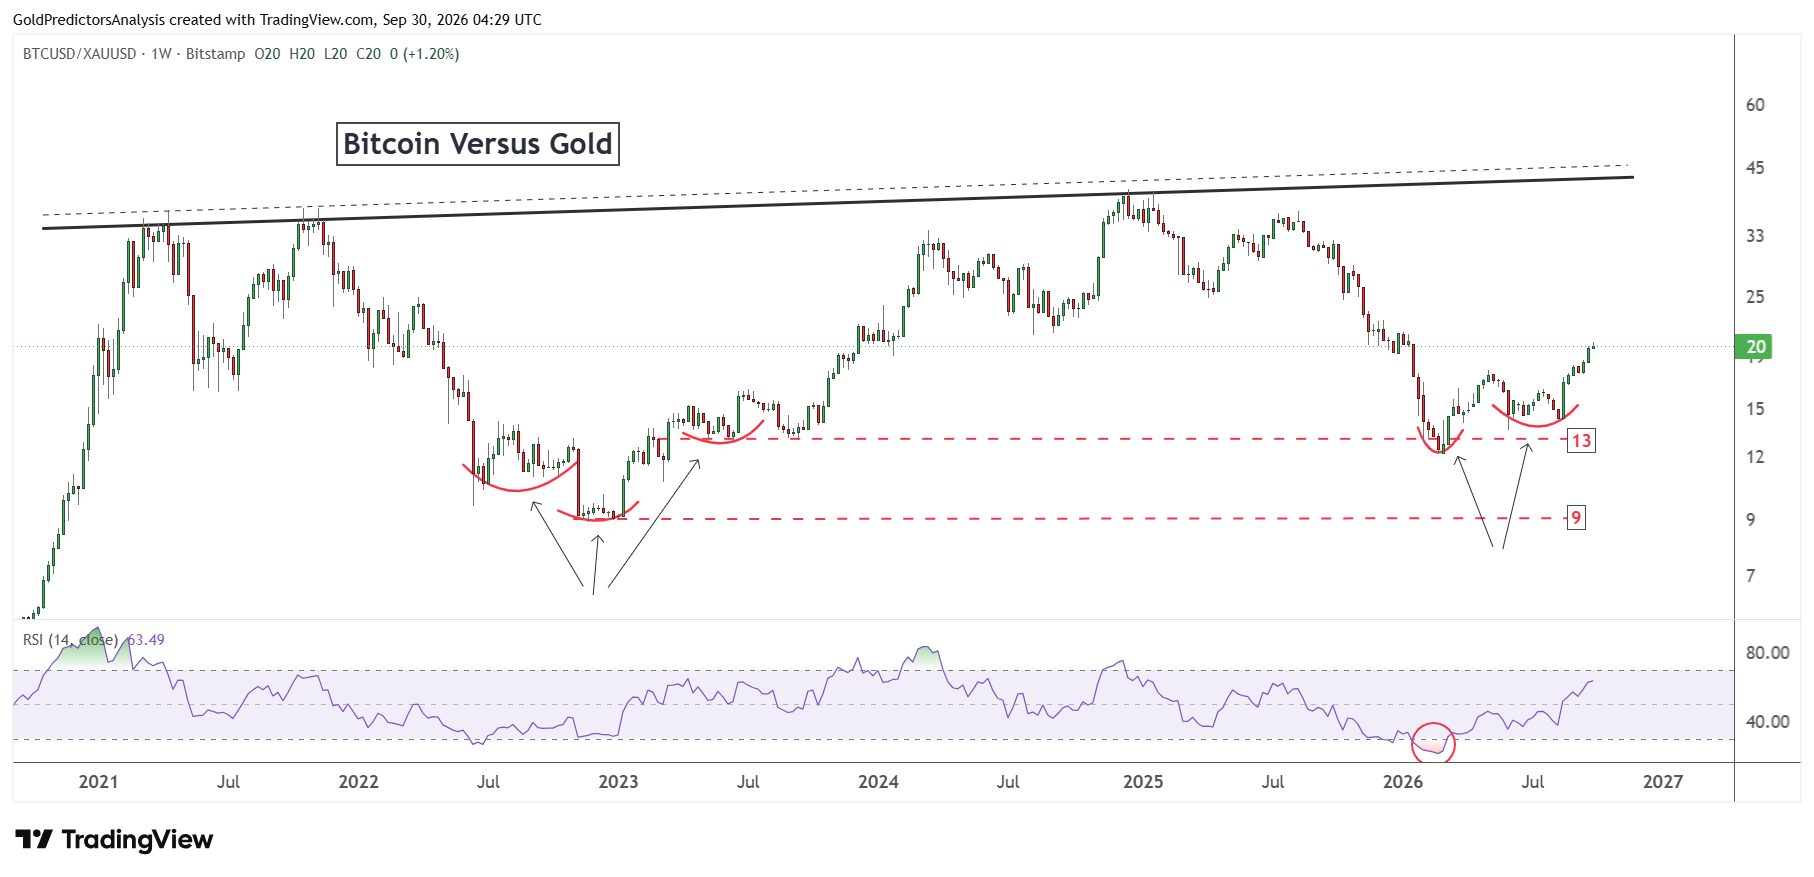
In my opinion, if the ratio breaks above 23, it would strengthen the case for further outperformance in Bitcoin. A break above 23 may push the ratio to 25 and 36.
A reversal toward 13 would weaken that view and signal renewed strength in gold relative to Bitcoin. A break below 13 would indicate further downside in the ratio to 9.
Bitcoin Price Forecast: $82,300 Support Keeps $100,000 in View
The weekly chart for Bitcoin shows that the price has broken above $82,300 after producing a strong bottom at the $60,000 support. Now, the price must hold $82,300 to initiate another rally towards the $100,000 level. The rebound from the $60,000 level appears constructive and indicates that prices may continue to rally further in the next few weeks.
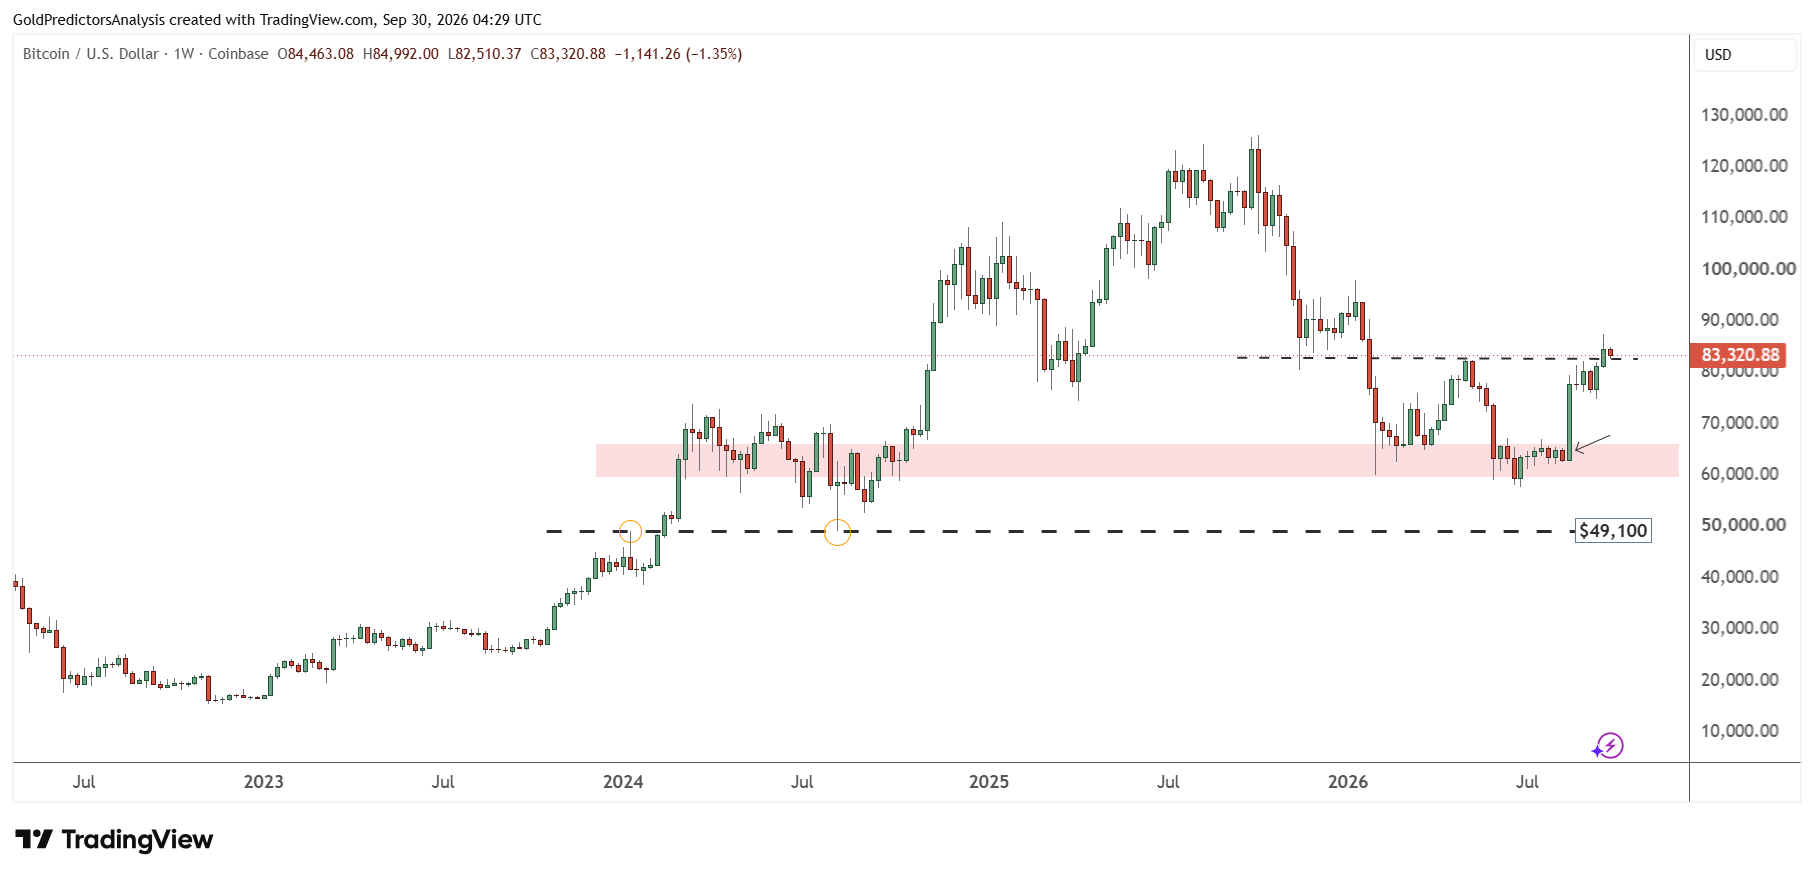
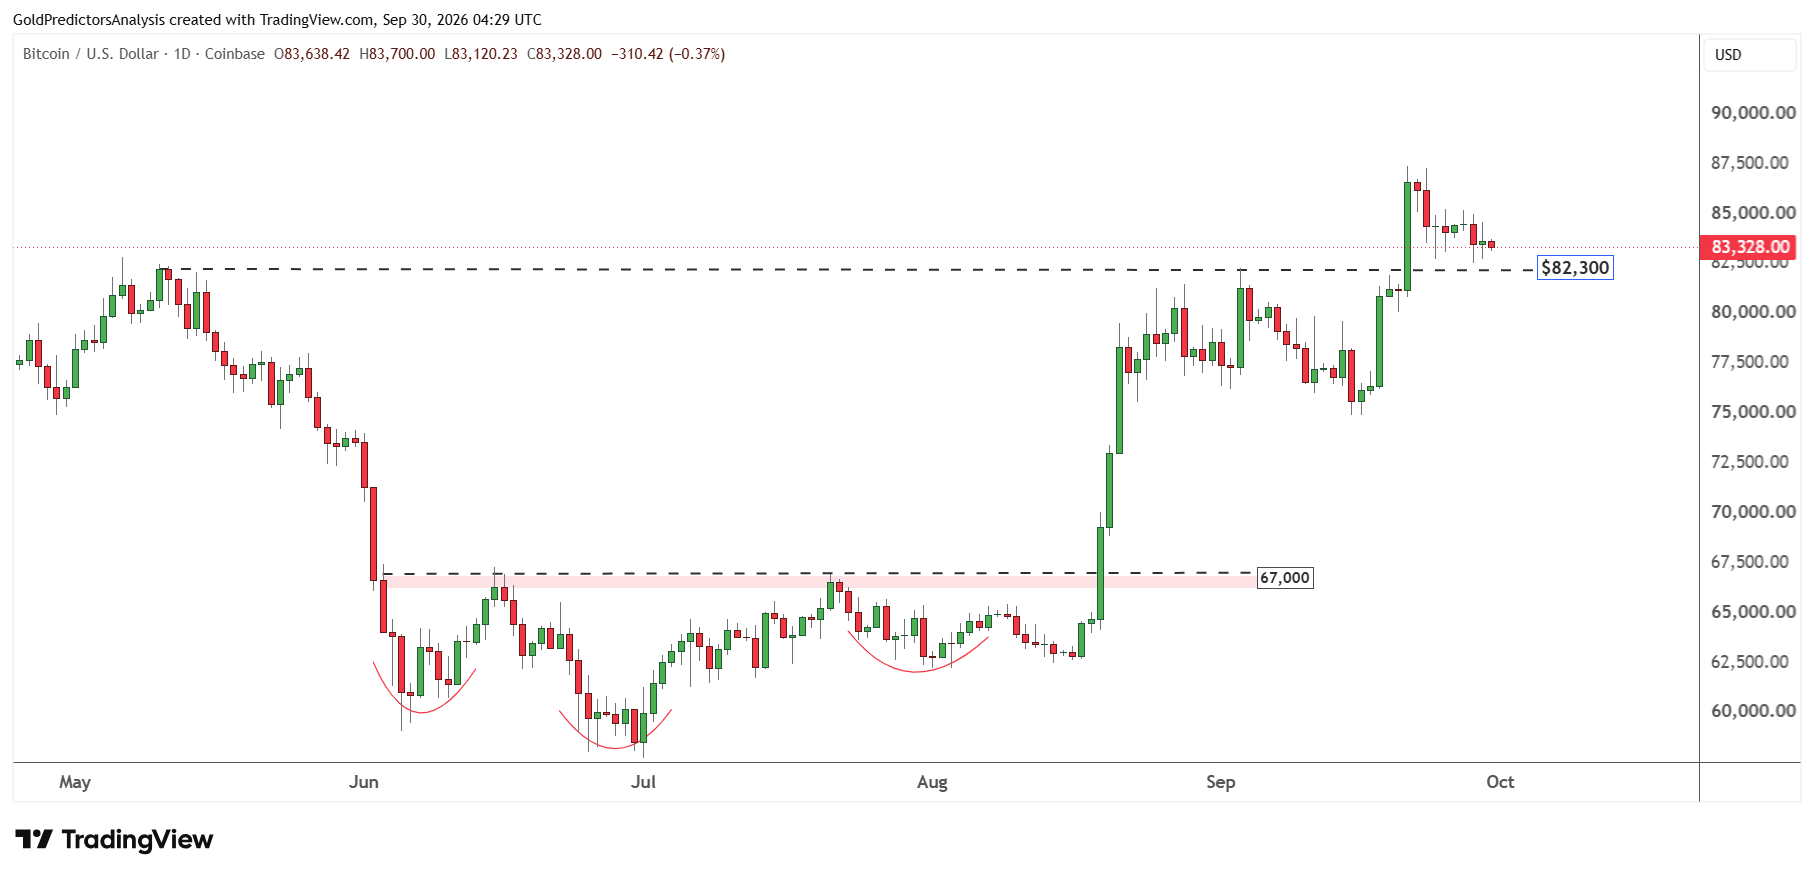
The importance of the $82,300 support is also observed on the daily chart, which shows that the price has already broken above the May 2026 highs. However, the price must hold this level to prevent further downside towards $75,000. If the $82,300 level holds, the next move in Bitcoin will likely be higher toward $100,000.
The important support at the $60,000 level is also evident on the ascending broadening wedge pattern. The chart shows that as long as this $60,000 support holds, the possibility of a strong rally towards the record level is high.
Overall, the emergence of the ascending broadening wedge pattern highlights strong volatility in the Bitcoin market. However, the formation of constructive price action around $60,000 supports a bullish outlook in the medium term.
What to Watch Next
The recovery in Bitcoin against gold looks constructive, but it still needs confirmation. If the Bitcoin price holds at $82,300, it would keep moving toward $100,000. A break above 23 in the ratio of Bitcoin to gold would strengthen the case for further outperformance in Bitcoin. The inflows in ETF support demand, while high Treasury yields limit the recovery.
The softer US inflation data could ease expectations of a rate hike and support both assets. But the stronger data could add pressure to both assets. In my view, the outlook for Bitcoin remains positive while key support holds, but a break below $82,300 would increase the risk of a decline toward $75,000.



